Federal Electoral District Fact Sheets
-
Electoral District:
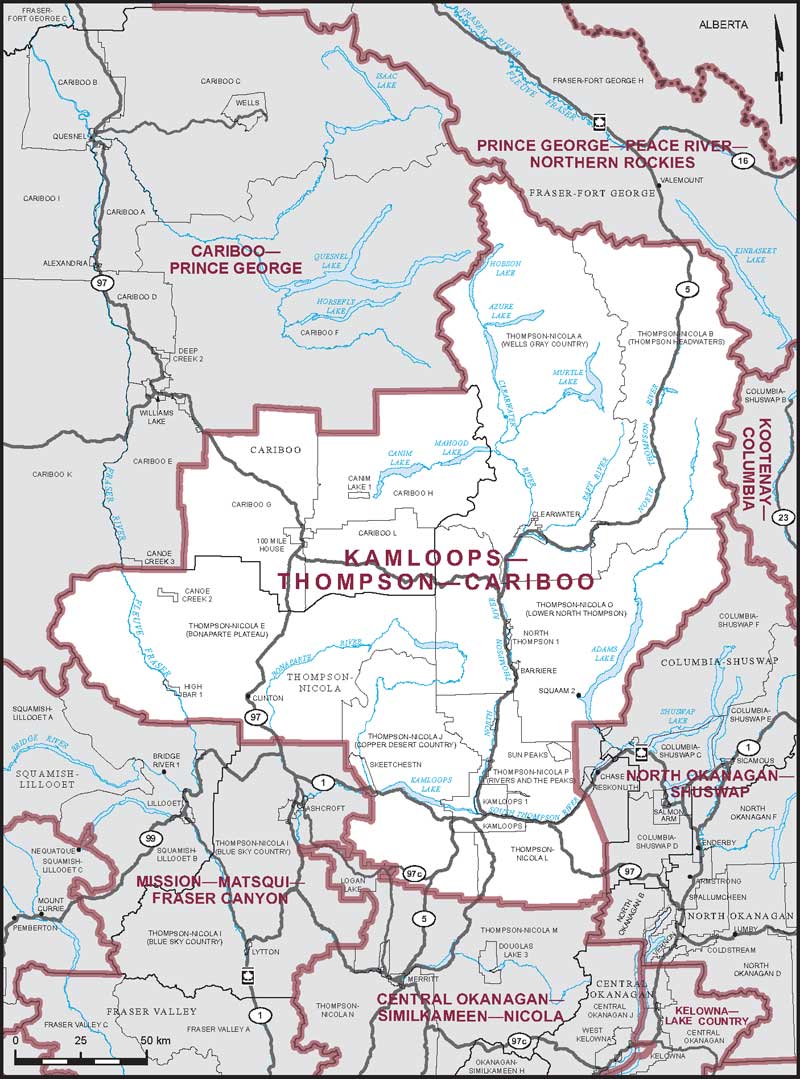
Kamloops—Thompson—CaribooProvince/Territory:
British Columbia-
Population:
135,492 -
Area:
37,623 km² -
Population density:
4.00/km² -
Population change:
+9% -
Average age:
44 -
Average income:
$51,900 -
Voter turnout:
66%
Language spoken most often at home:
-
English:
127,130 -
French:
235 -
Indigenous language:
25 -
Most popular other language:
-
Punjabi (Panjabi):
1,270
-
-
All others:
3,305
-
-
Electoral District:
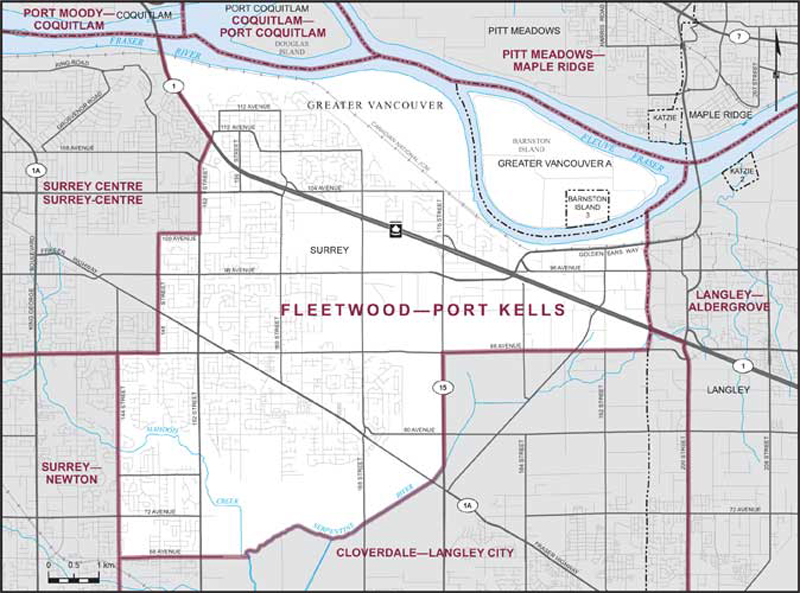
Fleetwood—Port KellsProvince/Territory:
British Columbia-
Population:
124,987 -
Area:
70 km² -
Population density:
1,798.00/km² -
Population change:
+6.9% -
Average age:
40 -
Average income:
$47,000 -
Voter turnout:
59%
Language spoken most often at home:
-
English:
65,180 -
French:
150 -
Indigenous language:
0 -
Most popular other language:
-
Punjabi (Panjabi):
18,690
-
-
All others:
28,685
-
-
Electoral District:
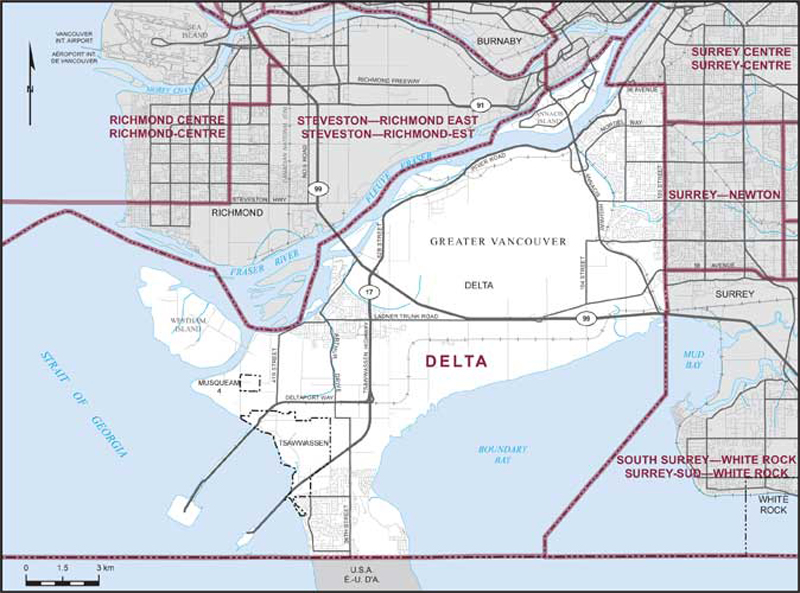
DeltaProvince/Territory:
British Columbia-
Population:
110,721 -
Area:
187 km² -
Population density:
593.00/km² -
Population change:
+7.4% -
Average age:
43 -
Average income:
$55,700 -
Voter turnout:
67%
Language spoken most often at home:
-
English:
80,115 -
French:
200 -
Indigenous language:
0 -
Most popular other language:
-
Punjabi (Panjabi):
11,895
-
-
All others:
11,330
-
-
Electoral District:
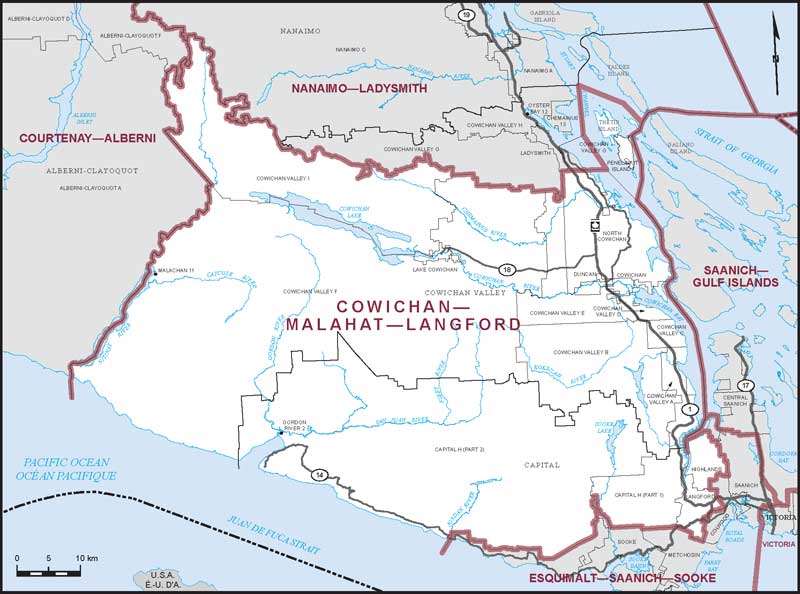
Cowichan—Malahat—LangfordProvince/Territory:
British Columbia-
Population:
124,247 -
Area:
4,554 km² -
Population density:
27.00/km² -
Population change:
+15% -
Average age:
44 -
Average income:
$51,500 -
Voter turnout:
64%
Language spoken most often at home:
-
English:
117,355 -
French:
365 -
Indigenous language:
65 -
Most popular other language:
-
Punjabi (Panjabi):
605
-
-
All others:
3,580
-
-
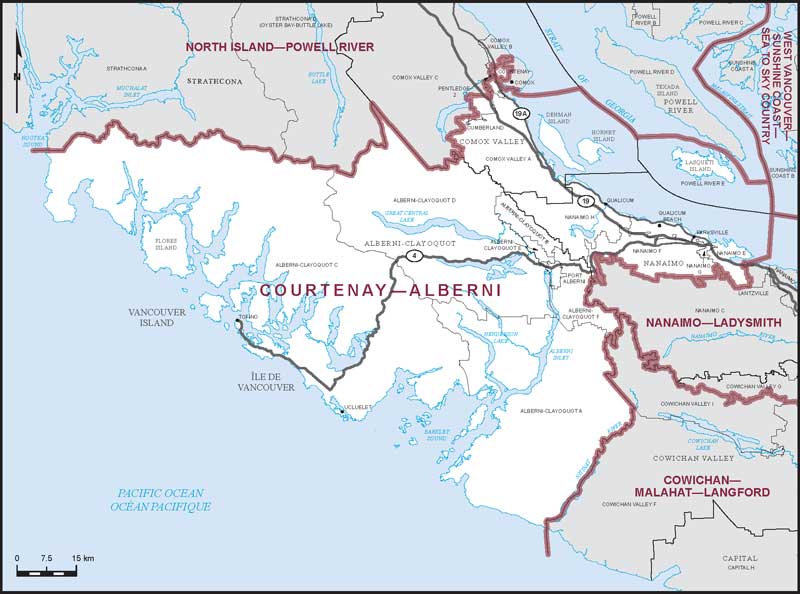
Electoral District:
Courtenay—AlberniProvince/Territory:
British Columbia-
Population:
125,116 -
Area:
7,899 km² -
Population density:
16.00/km² -
Population change:
+9.1% -
Average age:
49 -
Average income:
$47,760 -
Voter turnout:
65%
Language spoken most often at home:
-
English:
120,295 -
French:
515 -
Indigenous language:
30 -
Most popular other language:
-
Punjabi (Panjabi):
260
-
-
All others:
1,940
-
-
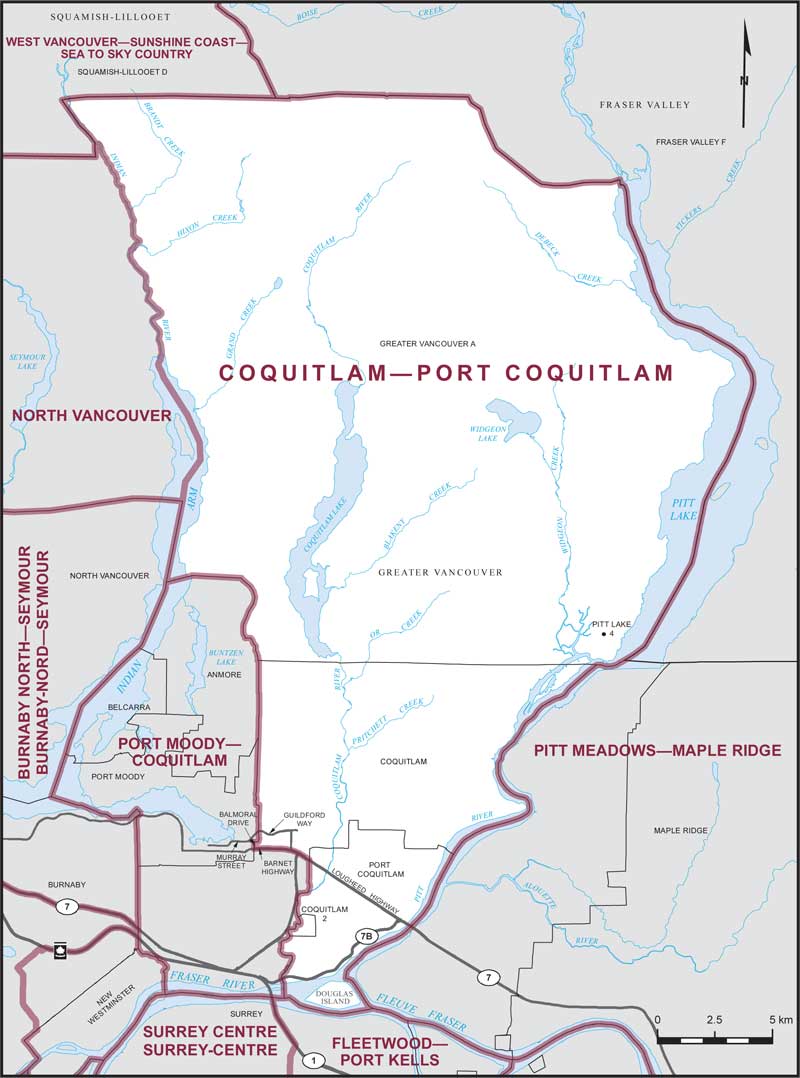
Electoral District:
Coquitlam—Port CoquitlamProvince/Territory:
British Columbia-
Population:
132,004 -
Area:
597 km² -
Population density:
221.00/km² -
Population change:
+6.8% -
Average age:
41 -
Average income:
$53,250 -
Voter turnout:
60%
Language spoken most often at home:
-
English:
86,160 -
French:
410 -
Indigenous language:
0 -
Most popular other language:
-
Mandarin & Yue (Cantonese):
14,770
-
-
All others:
22,230
-
-
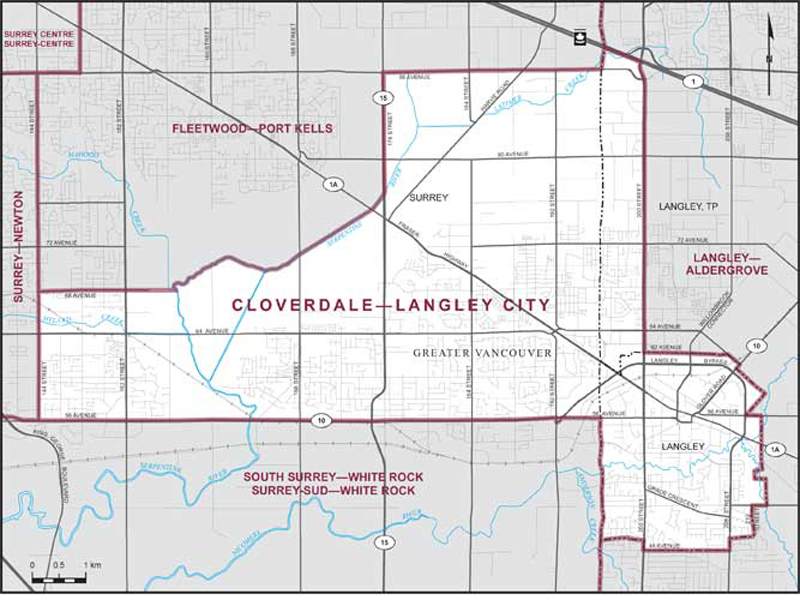
Electoral District:
Cloverdale—Langley CityProvince/Territory:
British Columbia-
Population:
130,665 -
Area:
59 km² -
Population density:
2,199.00/km² -
Population change:
+11.1% -
Average age:
39 -
Average income:
$53,050 -
Voter turnout:
61%
Language spoken most often at home:
-
English:
99,535 -
French:
245 -
Indigenous language:
0 -
Most popular other language:
-
Punjabi (Panjabi):
9,885
-
-
All others:
13,140
-
-
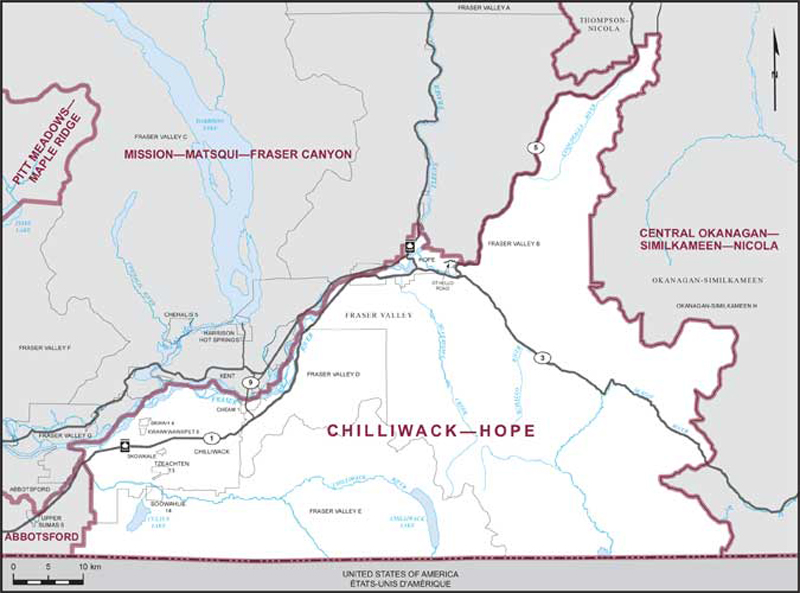
Electoral District:
Chilliwack—HopeProvince/Territory:
British Columbia-
Population:
112,037 -
Area:
3,284 km² -
Population density:
34.00/km² -
Population change:
+11.9% -
Average age:
43 -
Average income:
$48,920 -
Voter turnout:
61%
Language spoken most often at home:
-
English:
104,260 -
French:
240 -
Indigenous language:
5 -
Most popular other language:
-
Punjabi (Panjabi):
925
-
-
All others:
4,190
-
-
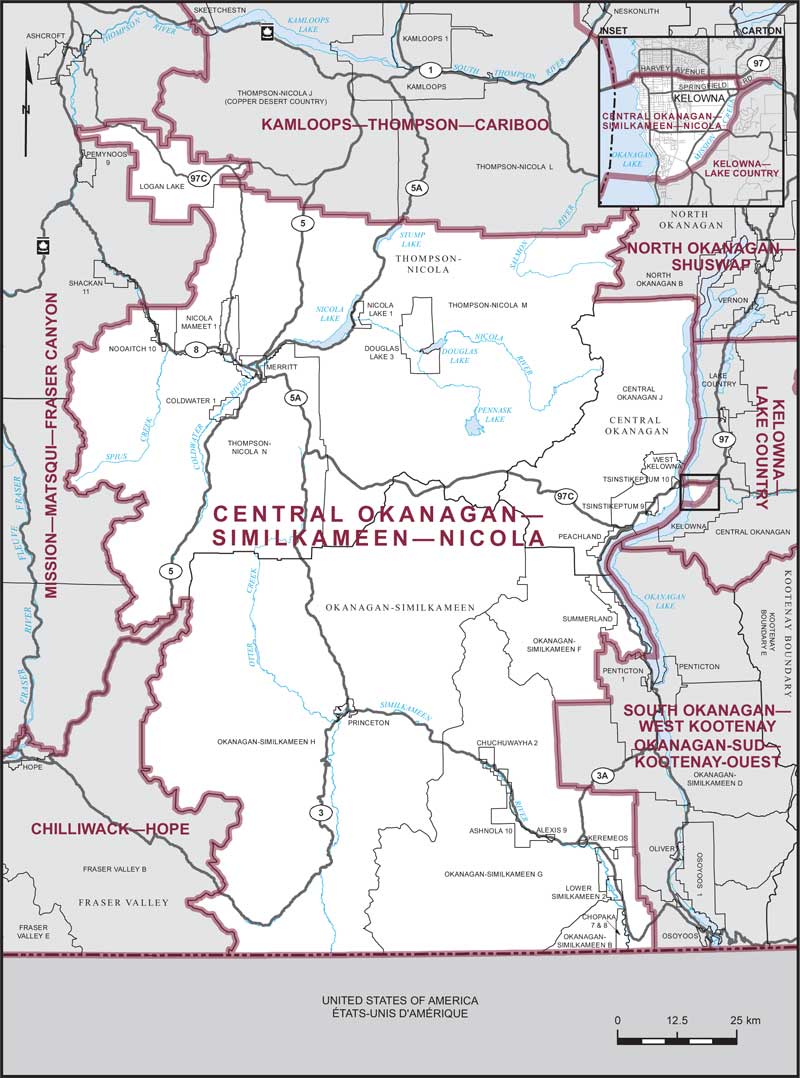
Electoral District:
Central Okanagan—Similkameen—NicolaProvince/Territory:
British Columbia-
Population:
122,340 -
Area:
15,966 km² -
Population density:
8.00/km² -
Population change:
+10.9% -
Average age:
47 -
Average income:
$50,440 -
Voter turnout:
65%
Language spoken most often at home:
-
English:
114,740 -
French:
330 -
Indigenous language:
30 -
Most popular other language:
-
Punjabi (Panjabi):
810
-
-
All others:
3,475
-
-
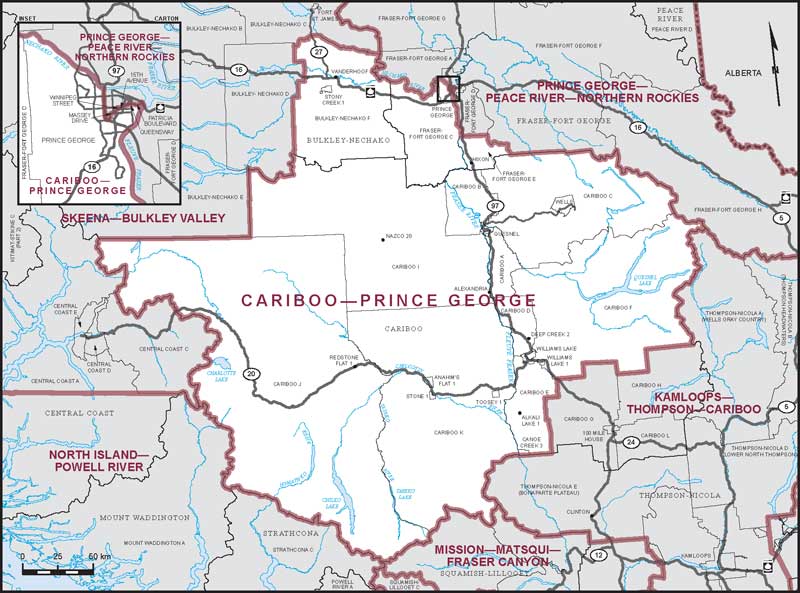
Electoral District:
Cariboo—Prince GeorgeProvince/Territory:
British Columbia-
Population:
111,226 -
Area:
82,820 km² -
Population density:
1.00/km² -
Population change:
+2.1% -
Average age:
42 -
Average income:
$51,700 -
Voter turnout:
60%
Language spoken most often at home:
-
English:
103,830 -
French:
150 -
Indigenous language:
260 -
Most popular other language:
-
Punjabi (Panjabi):
1,885
-
-
All others:
2,435
-
-
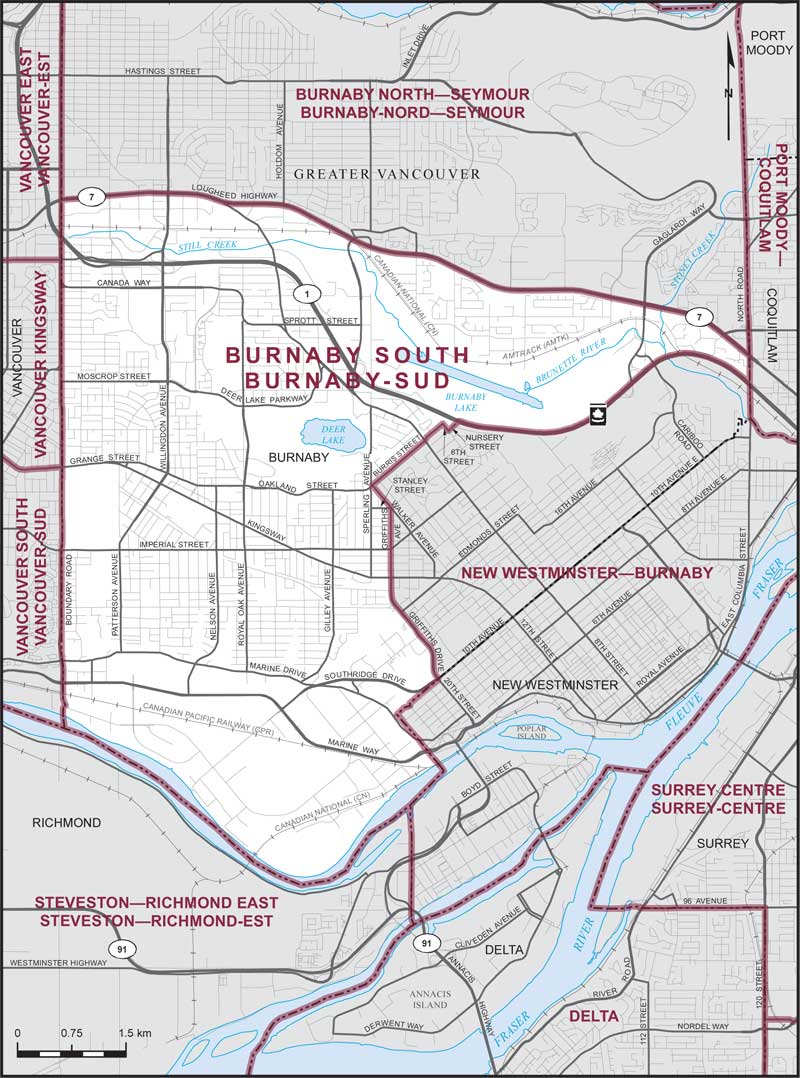
Electoral District:
Burnaby SouthProvince/Territory:
British Columbia-
Population:
120,305 -
Area:
46 km² -
Population density:
2,612.00/km² -
Population change:
+7.4% -
Average age:
42 -
Average income:
$50,280 -
Voter turnout:
51%
Language spoken most often at home:
-
English:
62,715 -
French:
250 -
Indigenous language:
5 -
Most popular other language:
-
Mandarin & Yue (Cantonese):
25,700
-
-
All others:
20,920
-
-
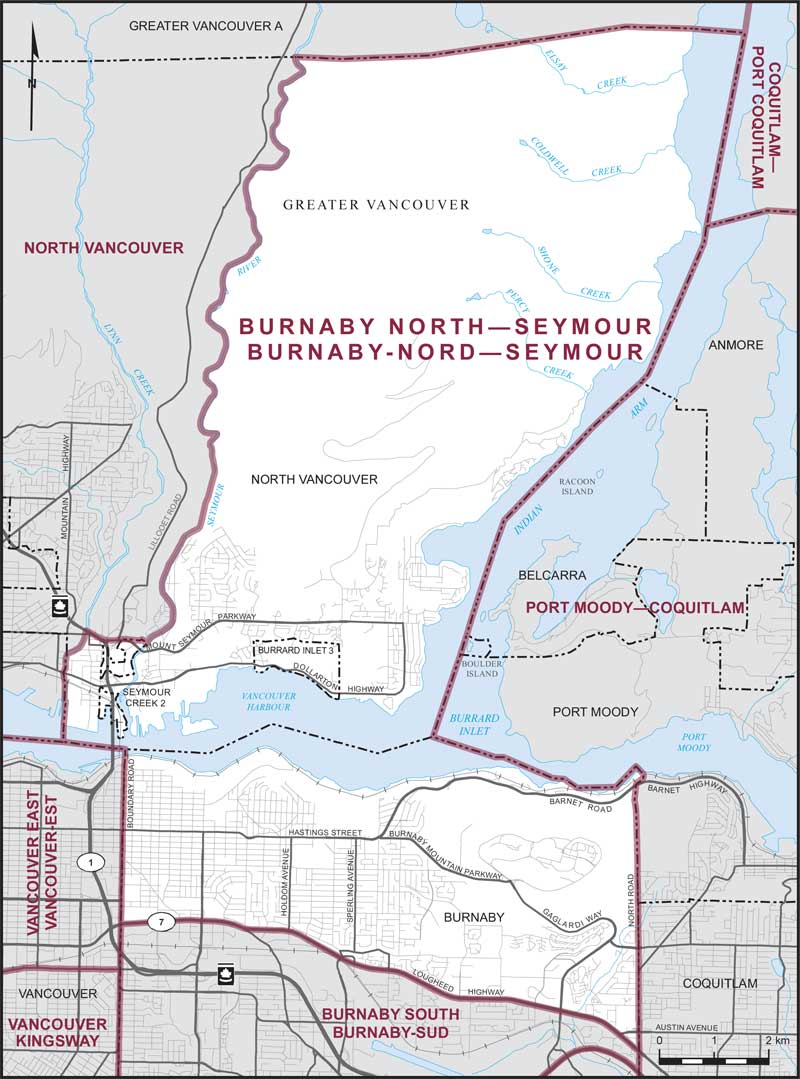
Electoral District:
Burnaby North—SeymourProvince/Territory:
British Columbia-
Population:
108,794 -
Area:
115 km² -
Population density:
950.00/km² -
Population change:
+6.2% -
Average age:
42 -
Average income:
$60,600 -
Voter turnout:
62%
Language spoken most often at home:
-
English:
77,440 -
French:
345 -
Indigenous language:
0 -
Most popular other language:
-
Yue (Cantonese) & Mandarin:
12,370
-
-
All others:
12,955
-
-
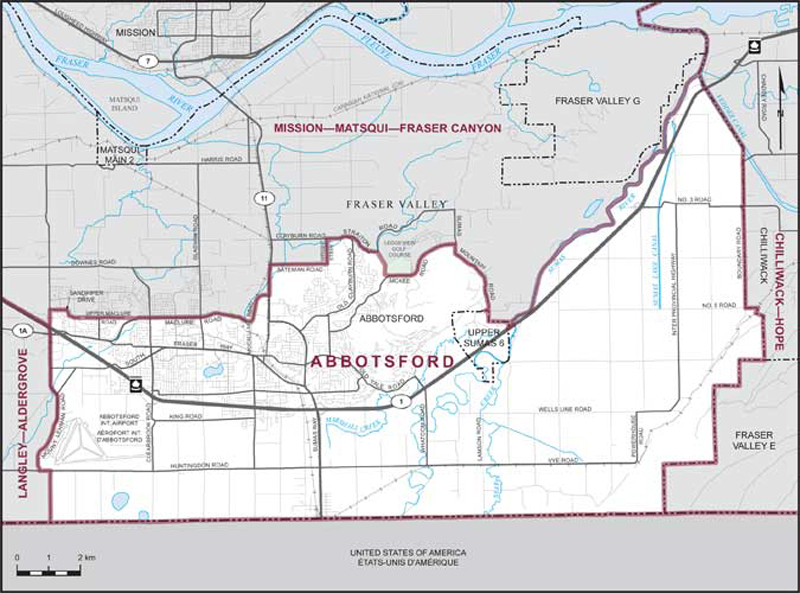
Electoral District:
AbbotsfordProvince/Territory:
British Columbia-
Population:
110,331 -
Area:
175 km² -
Population density:
630.00/km² -
Population change:
+8.4% -
Average age:
42 -
Average income:
$48,000 -
Voter turnout:
59%
Language spoken most often at home:
-
English:
83,305 -
French:
175 -
Indigenous language:
5 -
Most popular other language:
-
Punjabi (Panjabi):
14,570
-
-
All others:
6,210
-
-
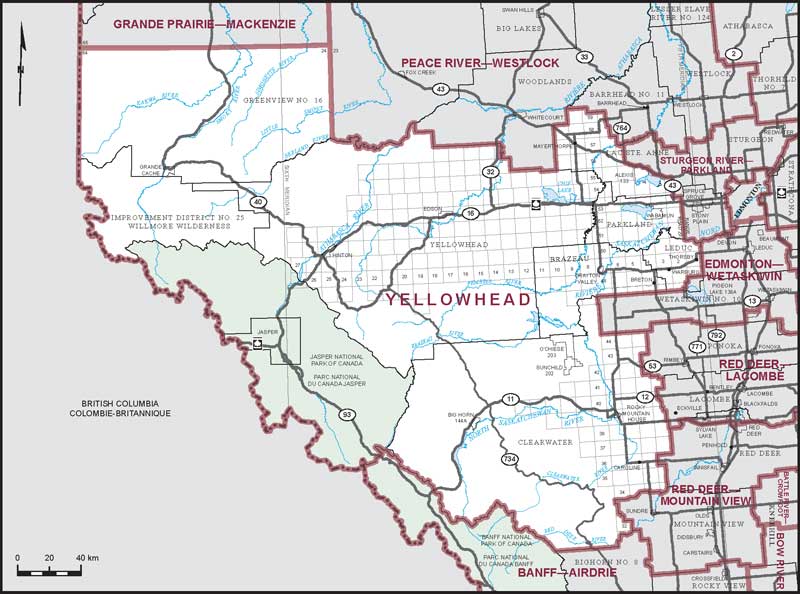
Electoral District:
YellowheadProvince/Territory:
Alberta-
Population:
99,218 -
Area:
77,134 km² -
Population density:
1.00/km² -
Population change:
-2.7% -
Average age:
41 -
Average income:
$55,400 -
Voter turnout:
68%
Language spoken most often at home:
-
English:
94,040 -
French:
365 -
Indigenous language:
225 -
Most popular other language:
-
Tagalog (Pilipino, Filipino):
705
-
-
All others:
1,705
-
-
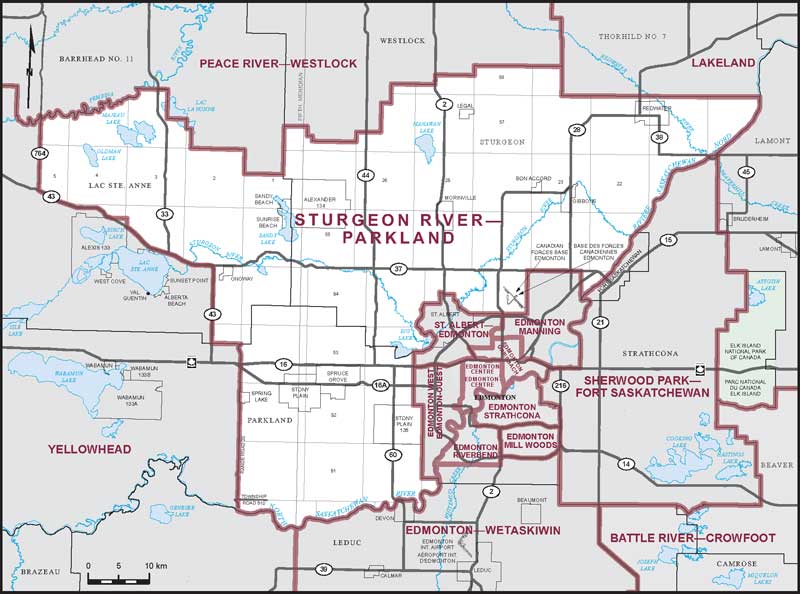
Electoral District:
Sturgeon River—ParklandProvince/Territory:
Alberta-
Population:
124,849 -
Area:
3,977 km² -
Population density:
31.00/km² -
Population change:
+3.4% -
Average age:
39 -
Average income:
$62,500 -
Voter turnout:
70%
Language spoken most often at home:
-
English:
119,410 -
French:
785 -
Indigenous language:
65 -
Most popular other language:
-
Tagalog (Pilipino, Filipino):
635
-
-
All others:
1,795
-
-
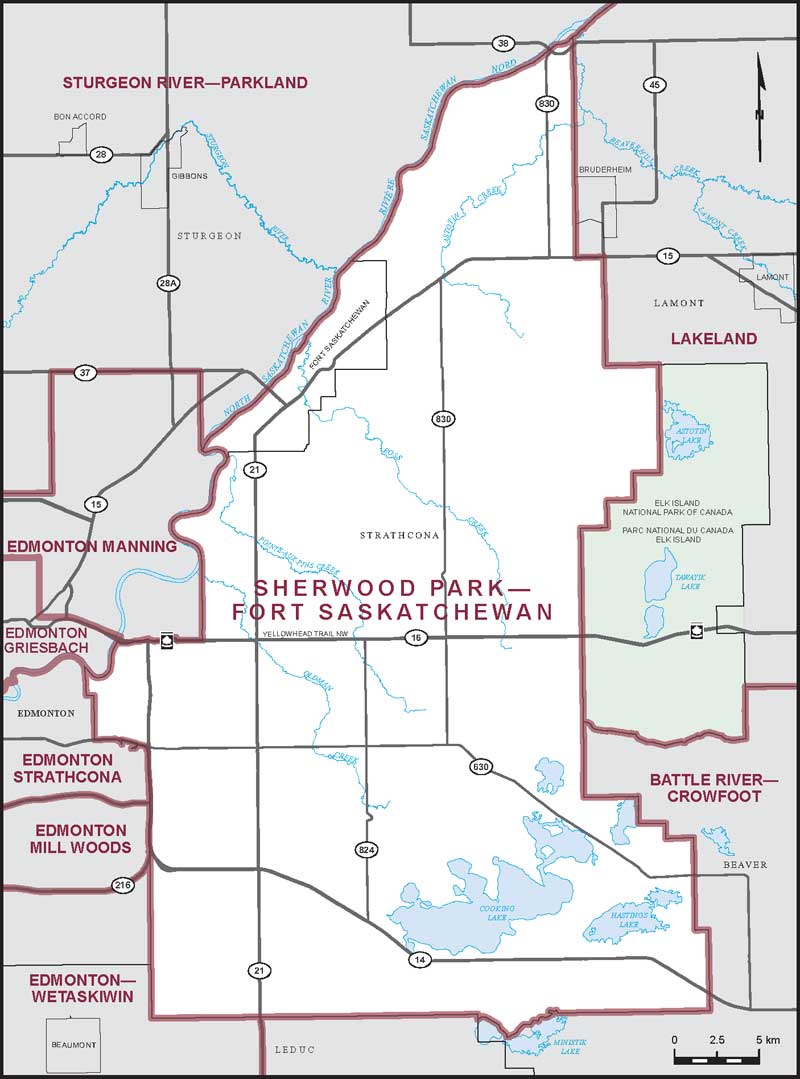
Electoral District:
Sherwood Park—Fort SaskatchewanProvince/Territory:
Alberta-
Population:
126,313 -
Area:
1,227 km² -
Population density:
103.00/km² -
Population change:
+3.4% -
Average age:
41 -
Average income:
$70,700 -
Voter turnout:
74%
Language spoken most often at home:
-
English:
118,605 -
French:
635 -
Indigenous language:
5 -
Most popular other language:
-
Tagalog (Pilipino, Filipino):
1,065
-
-
All others:
3,050
-