Federal Electoral District Fact Sheets
-
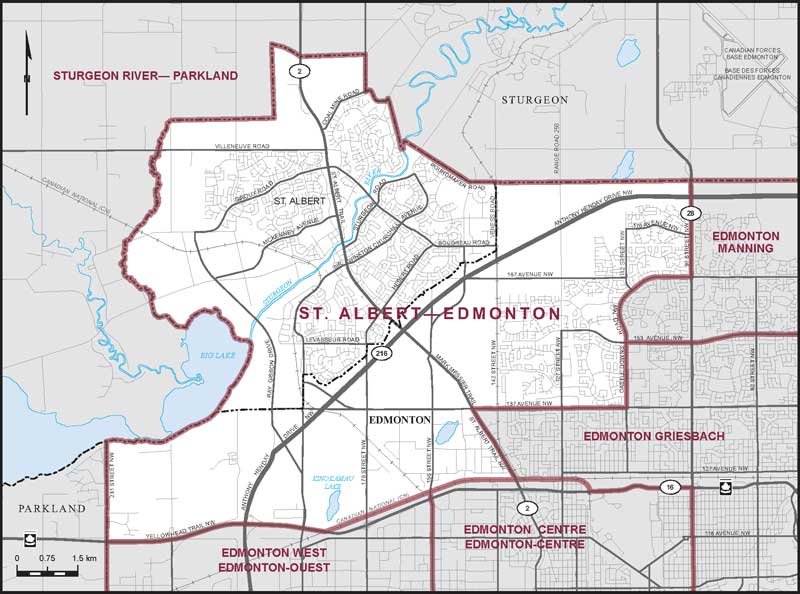
Electoral District:
St. Albert—EdmontonProvince/Territory:
Alberta-
Population:
130,822 -
Area:
104 km² -
Population density:
1,253.00/km² -
Population change:
+7.8% -
Average age:
39 -
Average income:
$62,500 -
Voter turnout:
66%
Language spoken most often at home:
-
English:
109,115 -
French:
865 -
Indigenous language:
20 -
Most popular other language:
-
Arabic:
2,345
-
-
All others:
10,860
-
-
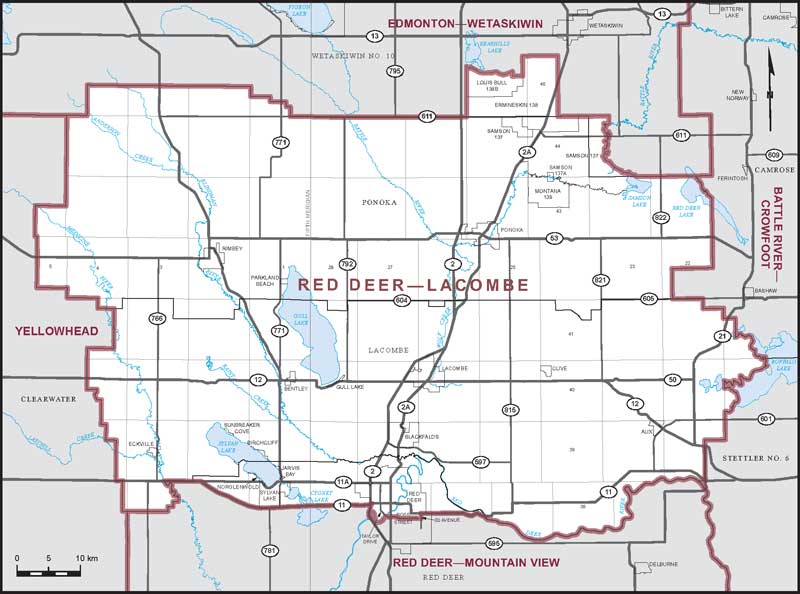
Electoral District:
Red Deer—LacombeProvince/Territory:
Alberta-
Population:
131,575 -
Area:
6,200 km² -
Population density:
21.00/km² -
Population change:
+2.2% -
Average age:
39 -
Average income:
$52,600 -
Voter turnout:
65%
Language spoken most often at home:
-
English:
119,580 -
French:
335 -
Indigenous language:
380 -
Most popular other language:
-
Tagalog (Pilipino, Filipino):
2,205
-
-
All others:
4,630
-
-
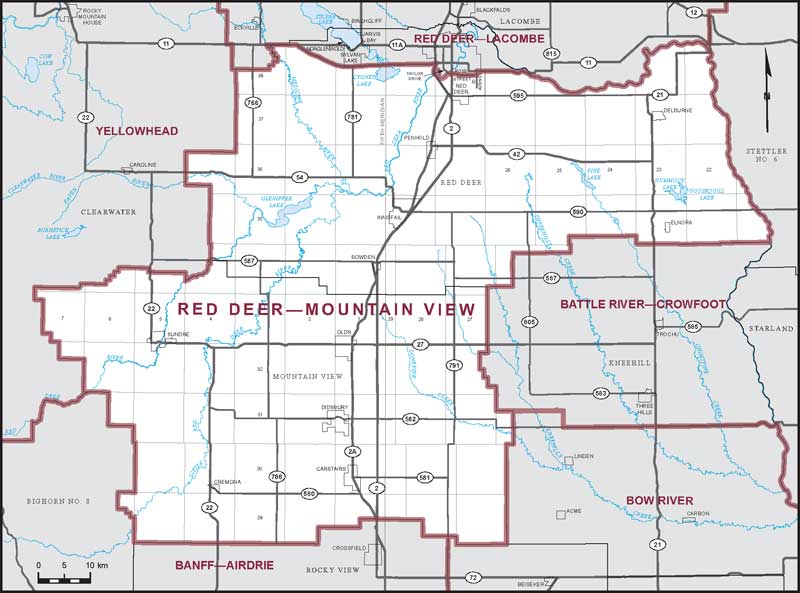
Electoral District:
Red Deer—Mountain ViewProvince/Territory:
Alberta-
Population:
120,739 -
Area:
7,646 km² -
Population density:
16.00/km² -
Population change:
+1.4% -
Average age:
42 -
Average income:
$56,400 -
Voter turnout:
70%
Language spoken most often at home:
-
English:
110,590 -
French:
270 -
Indigenous language:
15 -
Most popular other language:
-
Tagalog (Pilipino, Filipino):
1,420
-
-
All others:
4,155
-
-
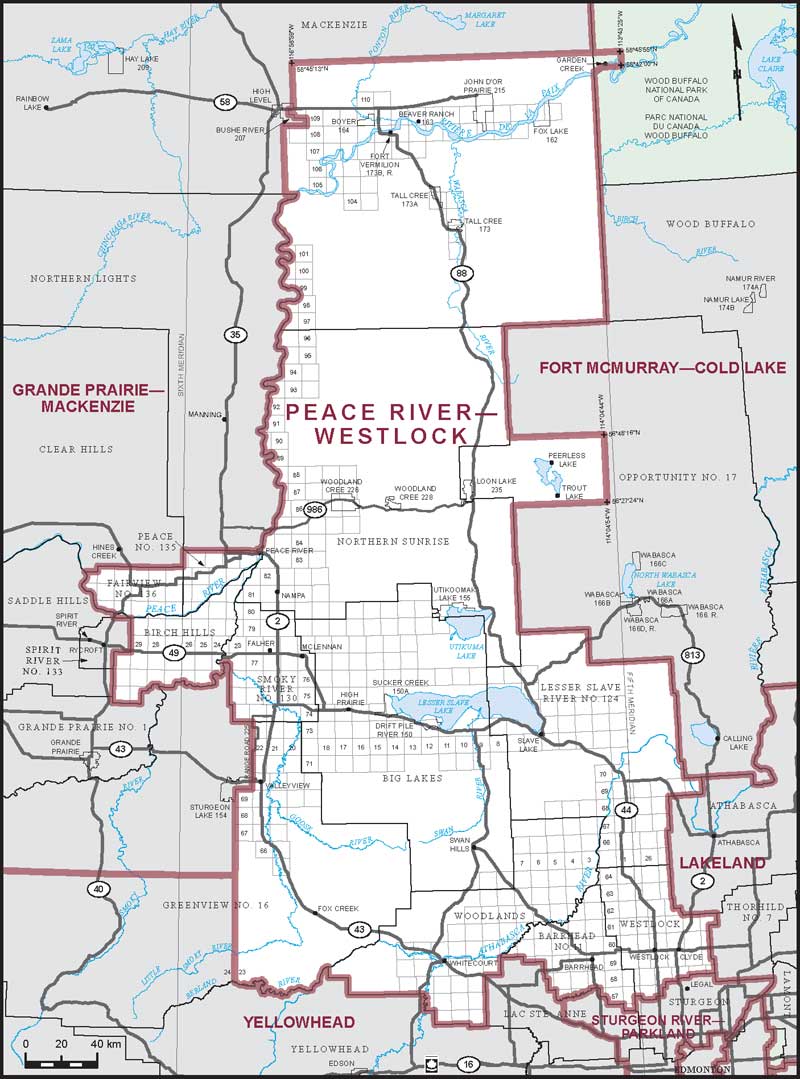
Electoral District:
Peace River—WestlockProvince/Territory:
Alberta-
Population:
107,223 -
Area:
106,395 km² -
Population density:
1.00/km² -
Population change:
-2.5% -
Average age:
38 -
Average income:
$52,550 -
Voter turnout:
62%
Language spoken most often at home:
-
English:
88,775 -
French:
1,020 -
Indigenous language:
3,340 -
Most popular other language:
-
German:
4,290
-
-
All others:
6,370
-
-
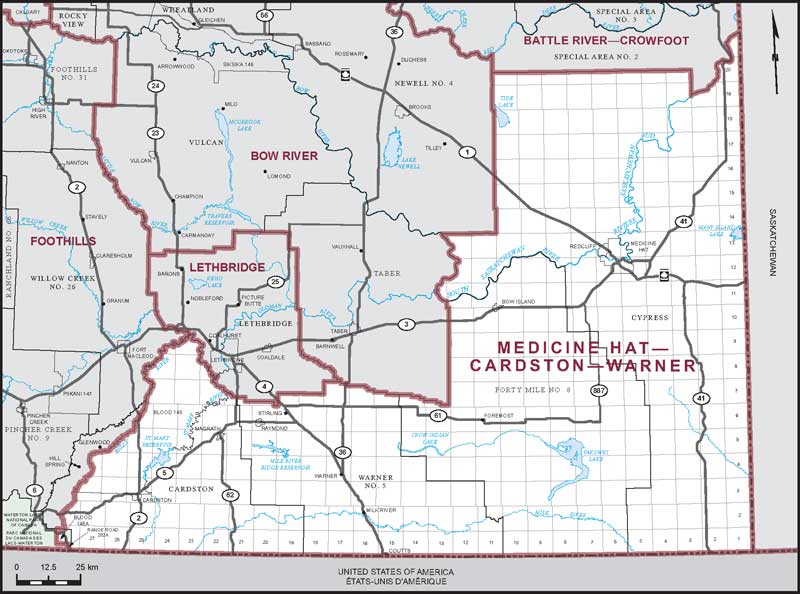
Electoral District:
Medicine Hat—Cardston—WarnerProvince/Territory:
Alberta-
Population:
108,391 -
Area:
29,137 km² -
Population density:
4.00/km² -
Population change:
+1.4% -
Average age:
41 -
Average income:
$51,000 -
Voter turnout:
61%
Language spoken most often at home:
-
English:
96,310 -
French:
180 -
Indigenous language:
555 -
Most popular other language:
-
German:
4,805
-
-
All others:
3,535
-
-
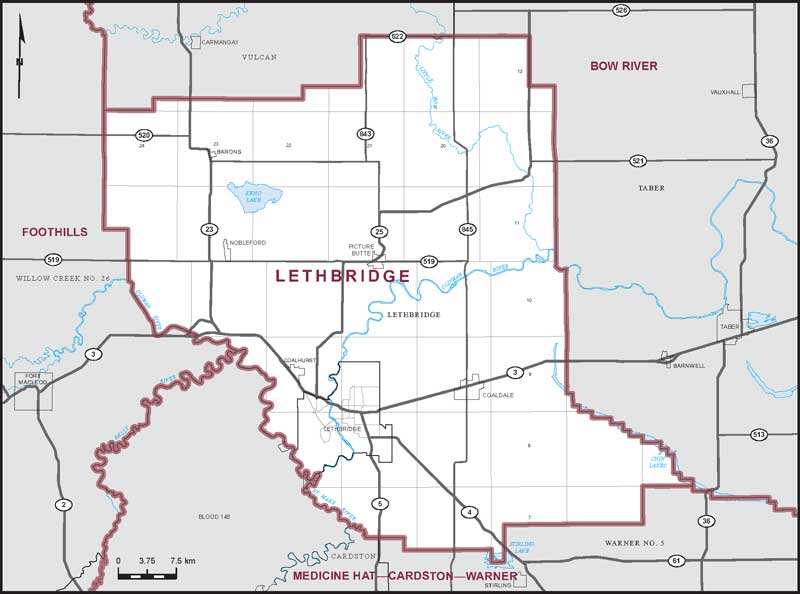
Electoral District:
LethbridgeProvince/Territory:
Alberta-
Population:
123,847 -
Area:
2,959 km² -
Population density:
42.00/km² -
Population change:
+5.5% -
Average age:
39 -
Average income:
$52,450 -
Voter turnout:
65%
Language spoken most often at home:
-
English:
110,425 -
French:
275 -
Indigenous language:
85 -
Most popular other language:
-
German:
1,500
-
-
All others:
7,330
-
-
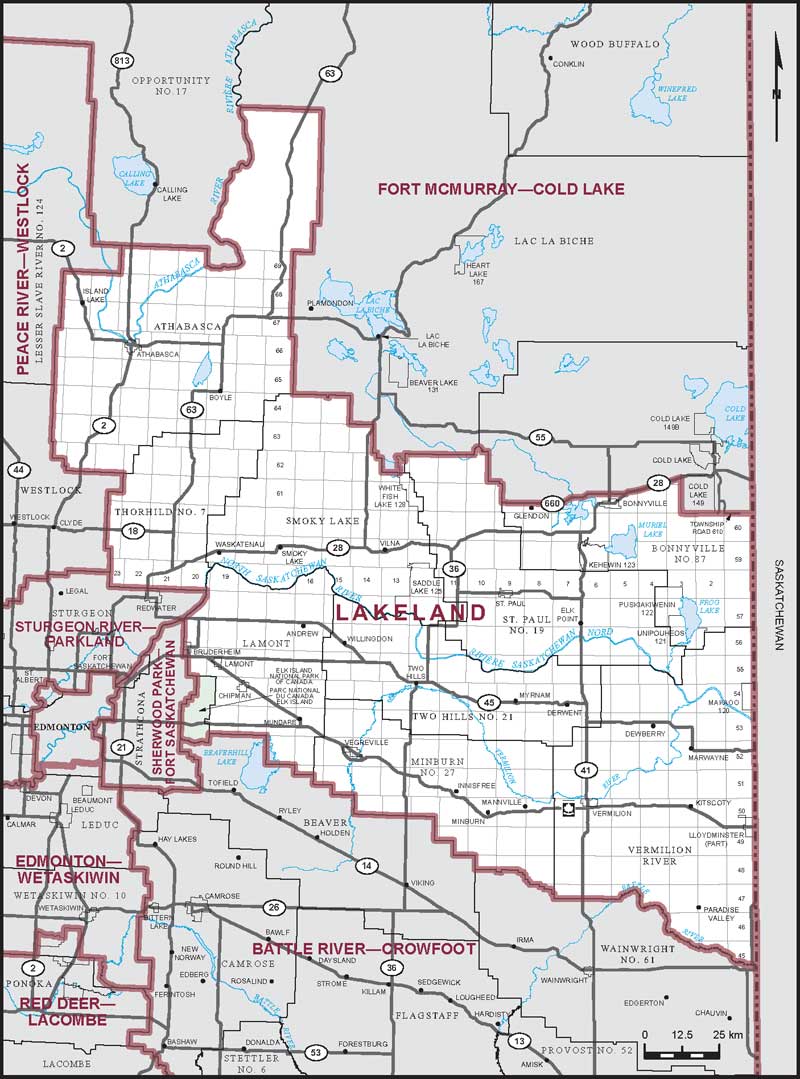
Electoral District:
LakelandProvince/Territory:
Alberta-
Population:
105,993 -
Area:
31,028 km² -
Population density:
3.00/km² -
Population change:
-2.5% -
Average age:
41 -
Average income:
$54,000 -
Voter turnout:
67%
Language spoken most often at home:
-
English:
96,640 -
French:
600 -
Indigenous language:
215 -
Most popular other language:
-
German:
2,165
-
-
All others:
3,140
-
-
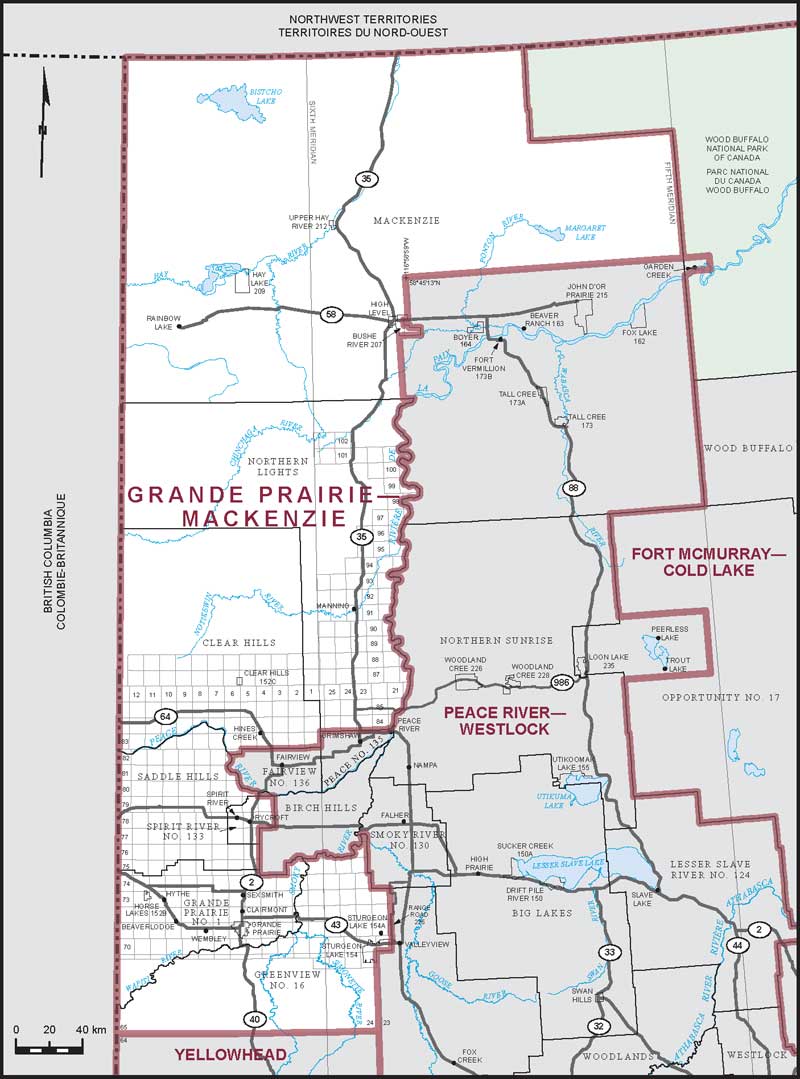
Electoral District:
Grande Prairie—MackenzieProvince/Territory:
Alberta-
Population:
119,586 -
Area:
111,865 km² -
Population density:
1.00/km² -
Population change:
+1.9% -
Average age:
36 -
Average income:
$59,700 -
Voter turnout:
63%
Language spoken most often at home:
-
English:
108,775 -
French:
550 -
Indigenous language:
550 -
Most popular other language:
-
Tagalog (Pilipino, Filipino):
1,605
-
-
All others:
4,795
-
-
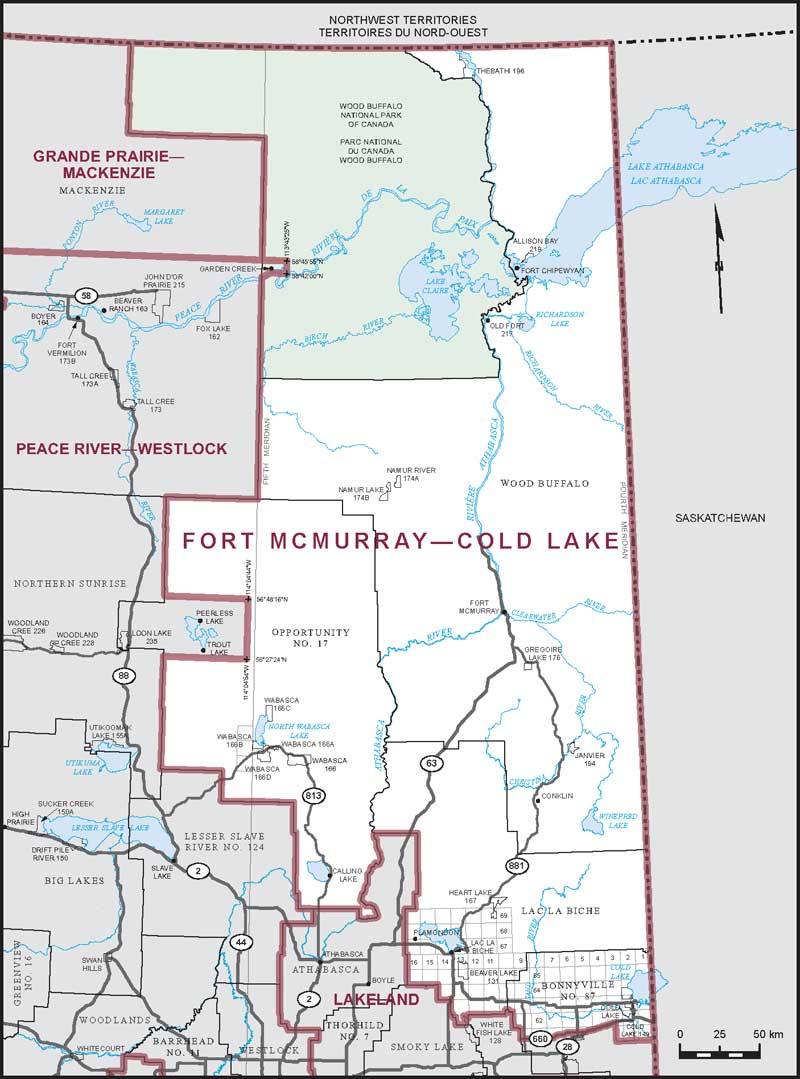
Electoral District:
Fort McMurray—Cold LakeProvince/Territory:
Alberta-
Population:
110,163 -
Area:
142,870 km² -
Population density:
0.80/km² -
Population change:
+0.1% -
Average age:
34 -
Average income:
$84,500 -
Voter turnout:
56%
Language spoken most often at home:
-
English:
95,860 -
French:
1,135 -
Indigenous language:
810 -
Most popular other language:
-
Tagalog (Pilipino, Filipino):
2,225
-
-
All others:
5,975
-
-
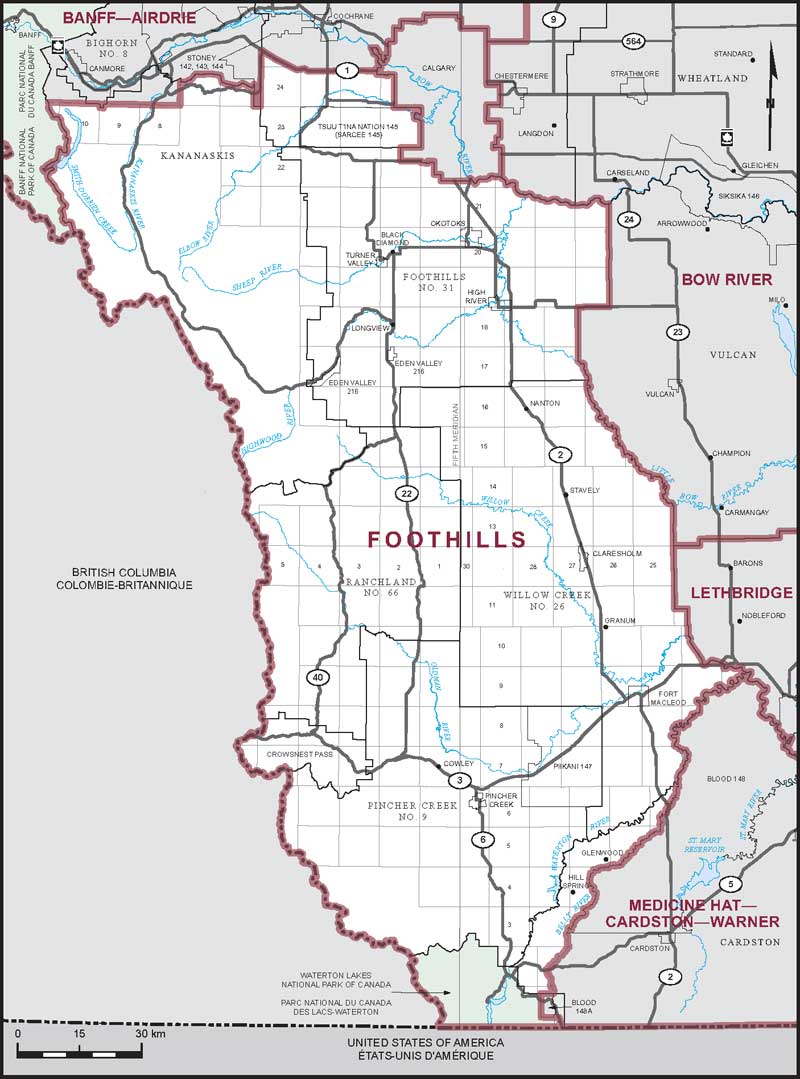
Electoral District:
FoothillsProvince/Territory:
Alberta-
Population:
115,118 -
Area:
20,752 km² -
Population density:
6.00/km² -
Population change:
+1.7% -
Average age:
43 -
Average income:
$73,200 -
Voter turnout:
72%
Language spoken most often at home:
-
English:
106,890 -
French:
335 -
Indigenous language:
75 -
Most popular other language:
-
German:
1,875
-
-
All others:
3,605
-
-
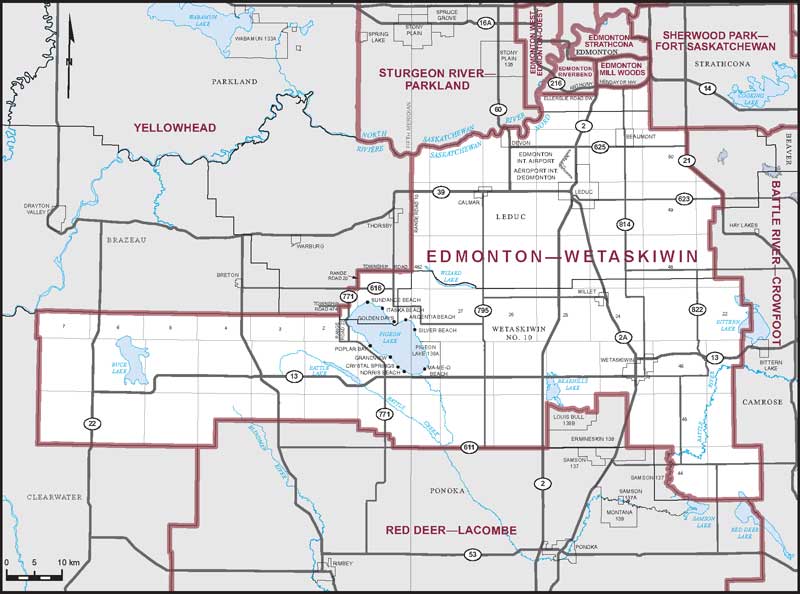
Electoral District:
Edmonton—WetaskiwinProvince/Territory:
Alberta-
Population:
209,431 -
Area:
4,833 km² -
Population density:
43.00/km² -
Population change:
+31.9% -
Average age:
36 -
Average income:
$59,700 -
Voter turnout:
65%
Language spoken most often at home:
-
English:
163,540 -
French:
1,315 -
Indigenous language:
100 -
Most popular other language:
-
Punjabi (Panjabi):
7,070
-
-
All others:
26,155
-
-
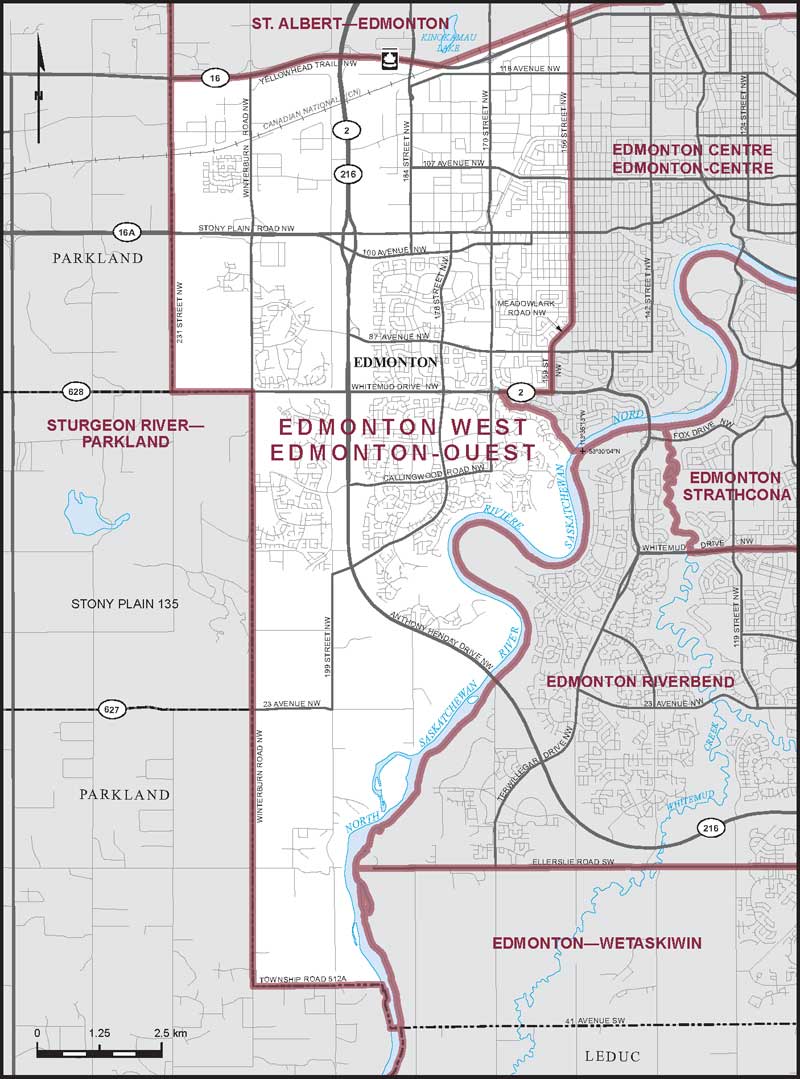
Electoral District:
Edmonton WestProvince/Territory:
Alberta-
Population:
134,194 -
Area:
105 km² -
Population density:
1,284.00/km² -
Population change:
+10.1% -
Average age:
39 -
Average income:
$58,400 -
Voter turnout:
62%
Language spoken most often at home:
-
English:
101,660 -
French:
590 -
Indigenous language:
50 -
Most popular other language:
-
Tagalog (Pilipino, Filipino):
6,315
-
-
All others:
16,320
-
-
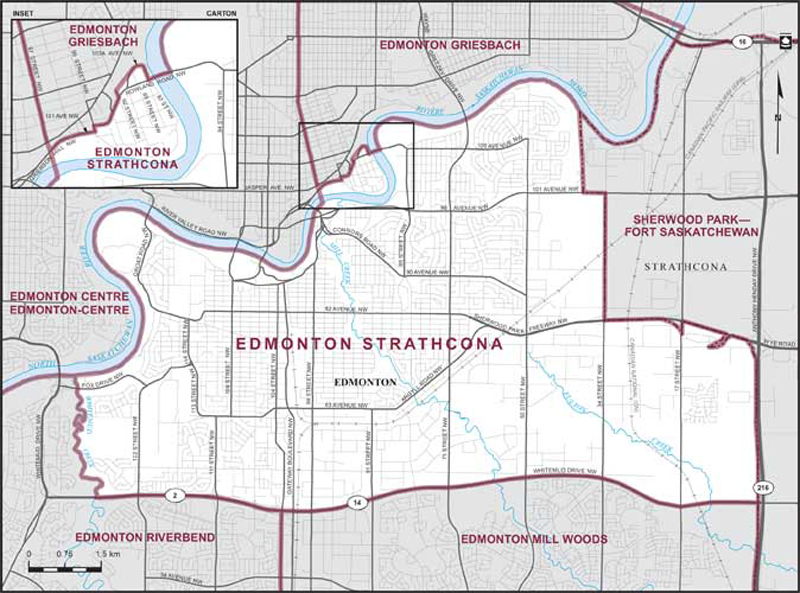
Electoral District:
Edmonton StrathconaProvince/Territory:
Alberta-
Population:
102,188 -
Area:
82 km² -
Population density:
1,251.00/km² -
Population change:
-3.7% -
Average age:
41 -
Average income:
$60,750 -
Voter turnout:
69%
Language spoken most often at home:
-
English:
87,395 -
French:
1,620 -
Indigenous language:
15 -
Most popular other language:
-
Mandarin:
1,805
-
-
All others:
7,300
-
-
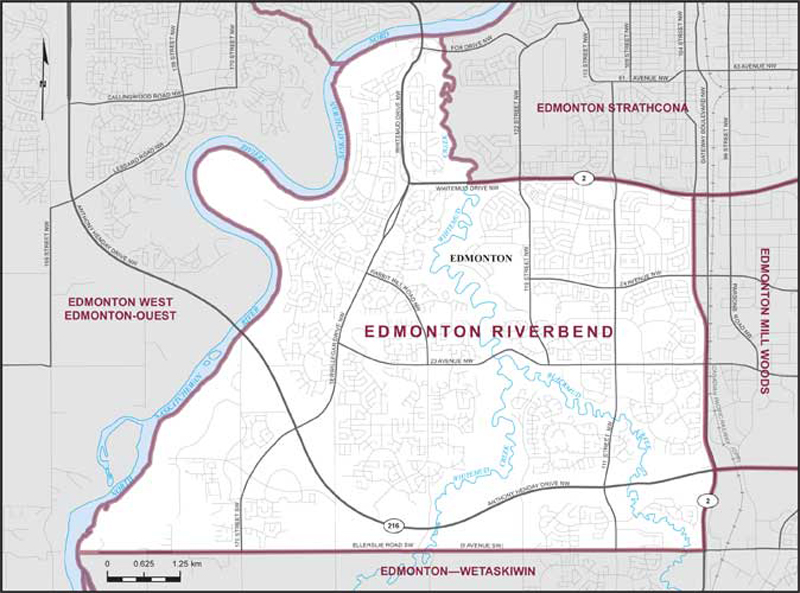
Electoral District:
Edmonton RiverbendProvince/Territory:
Alberta-
Population:
124,144 -
Area:
61 km² -
Population density:
2,020.00/km² -
Population change:
+2.7% -
Average age:
40 -
Average income:
$70,800 -
Voter turnout:
66%
Language spoken most often at home:
-
English:
92,165 -
French:
565 -
Indigenous language:
25 -
Most popular other language:
-
Mandarin & Yue (Cantonese):
8,215
-
-
All others:
15,440
-
-
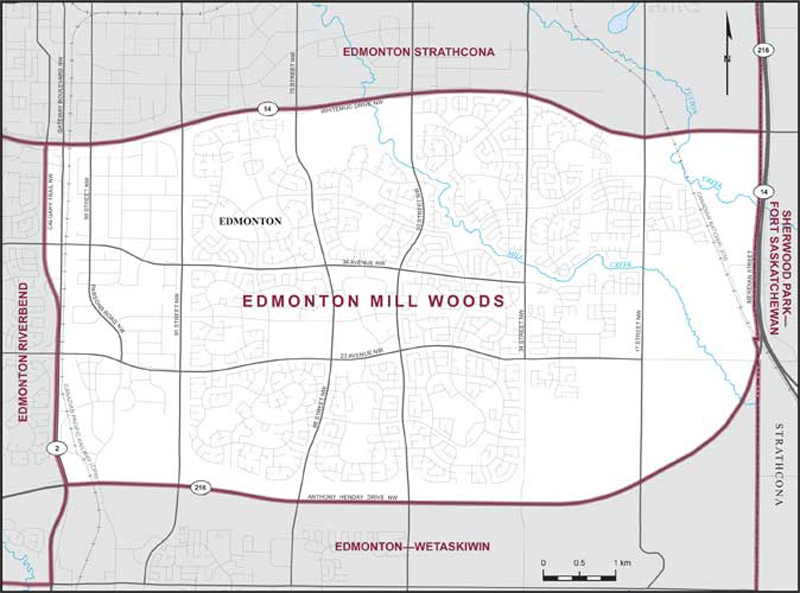
Electoral District:
Edmonton Mill WoodsProvince/Territory:
Alberta-
Population:
125,992 -
Area:
51 km² -
Population density:
2,460.00/km² -
Population change:
+6.3% -
Average age:
37 -
Average income:
$48,000 -
Voter turnout:
63%
Language spoken most often at home:
-
English:
77,385 -
French:
855 -
Indigenous language:
35 -
Most popular other language:
-
Punjabi (Panjabi):
18,450
-
-
All others:
18,325
-
-
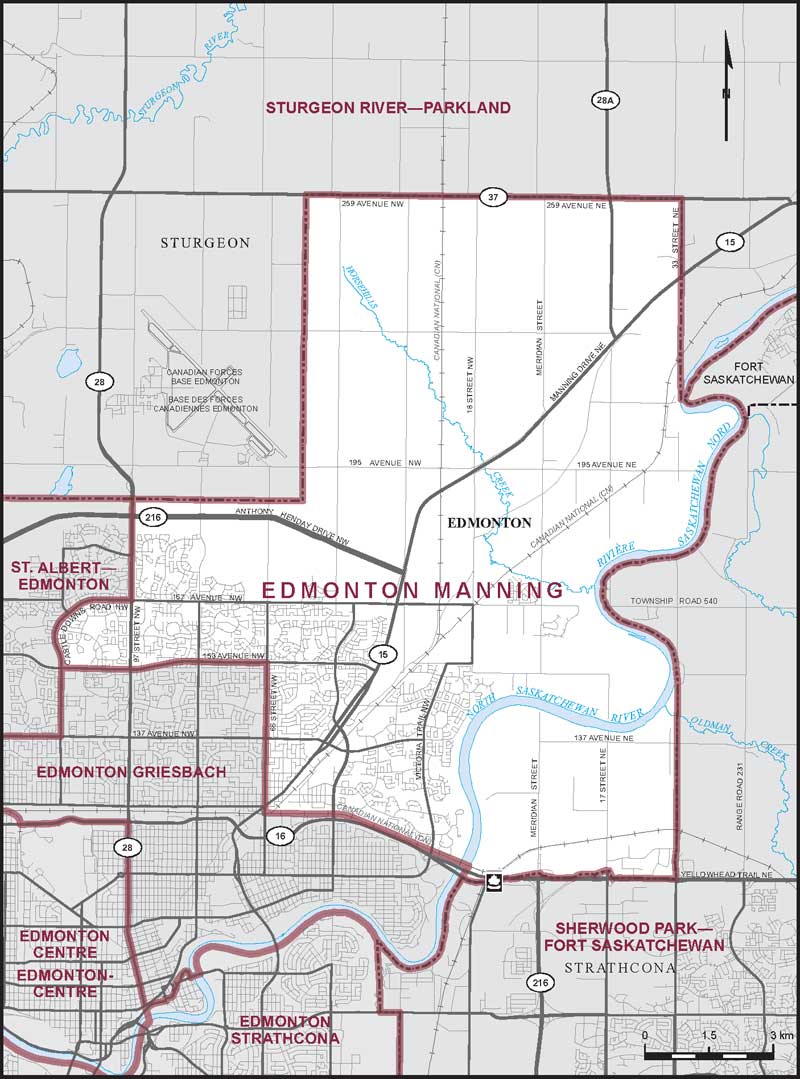
Electoral District:
Edmonton ManningProvince/Territory:
Alberta-
Population:
132,224 -
Area:
157 km² -
Population density:
842.00/km² -
Population change:
+9.2% -
Average age:
37 -
Average income:
$51,250 -
Voter turnout:
55%
Language spoken most often at home:
-
English:
97,130 -
French:
985 -
Indigenous language:
50 -
Most popular other language:
-
Punjabi (Panjabi):
3,200
-
-
All others:
21,545
-