Federal Electoral District Fact Sheets
-
Electoral District:
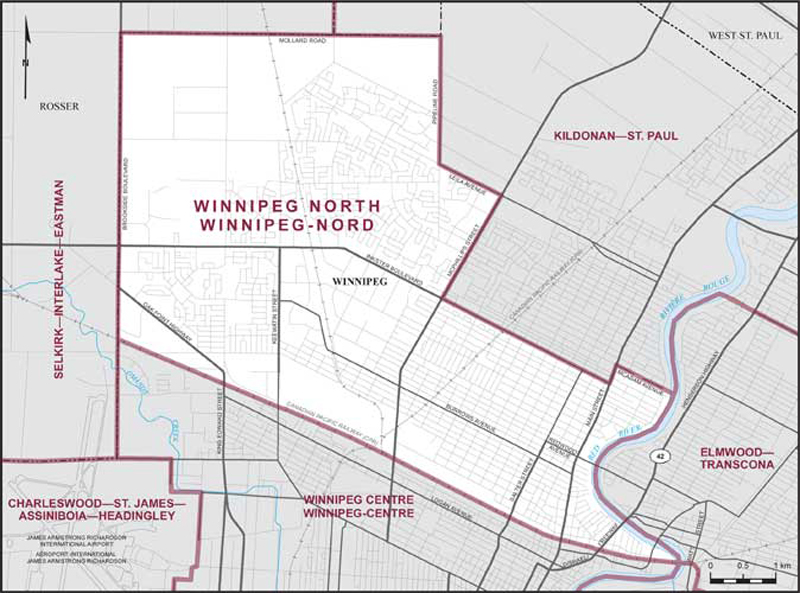
Winnipeg NorthProvince/Territory:
Manitoba-
Population:
101,221 -
Area:
37 km² -
Population density:
2,707.00/km² -
Population change:
+5.8% -
Average age:
38 -
Average income:
$38,760 -
Voter turnout:
51%
Language spoken most often at home:
-
English:
61,280 -
French:
110 -
Indigenous language:
235 -
Most popular other language:
-
Tagalog (Pilipino, Filipino):
12,515
-
-
All others:
17,485
-
-
Electoral District:
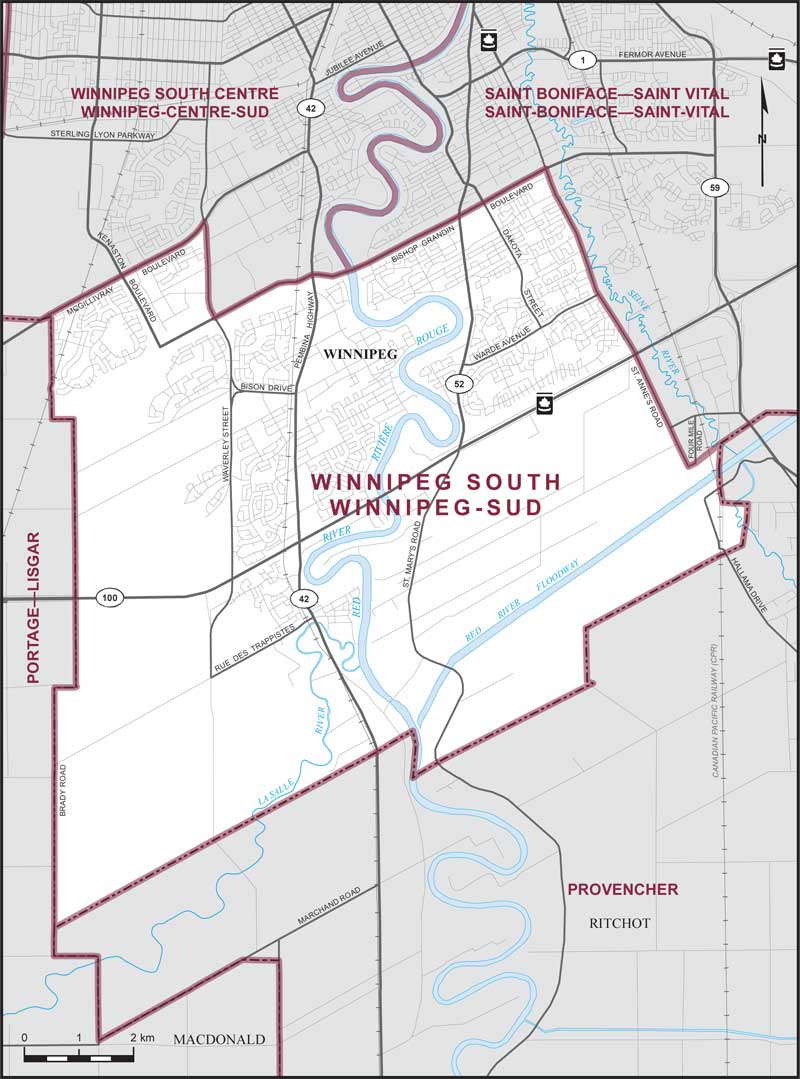
Winnipeg SouthProvince/Territory:
Manitoba-
Population:
113,370 -
Area:
101 km² -
Population density:
1,120.00/km² -
Population change:
+13.7% -
Average age:
38 -
Average income:
$53,800 -
Voter turnout:
68%
Language spoken most often at home:
-
English:
77,595 -
French:
1,515 -
Indigenous language:
55 -
Most popular other language:
-
Mandarin:
6,565
-
-
All others:
19,385
-
-
Electoral District:
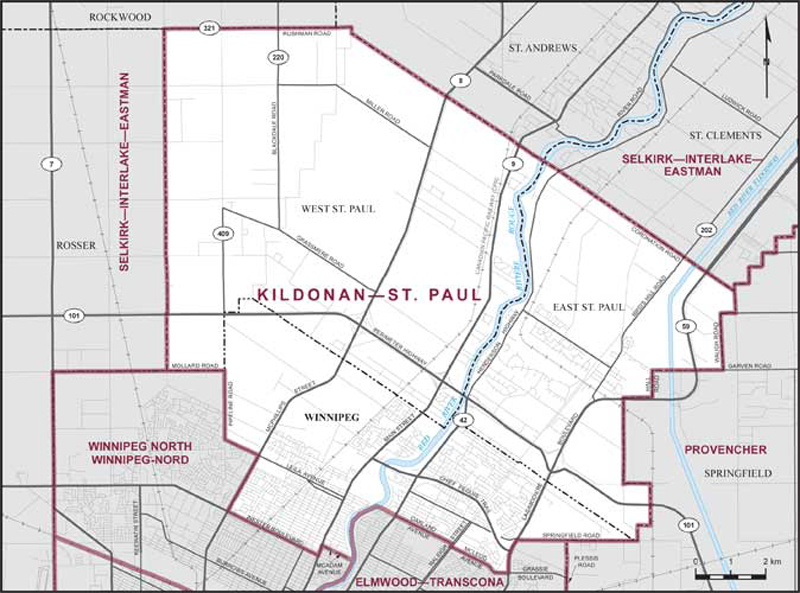
Kildonan—St. PaulProvince/Territory:
Manitoba-
Population:
91,480 -
Area:
170 km² -
Population density:
539.00/km² -
Population change:
+8.8% -
Average age:
42 -
Average income:
$53,350 -
Voter turnout:
66%
Language spoken most often at home:
-
English:
73,675 -
French:
170 -
Indigenous language:
55 -
Most popular other language:
-
Punjabi (Panjabi):
4,105
-
-
All others:
8,665
-
-
Electoral District:
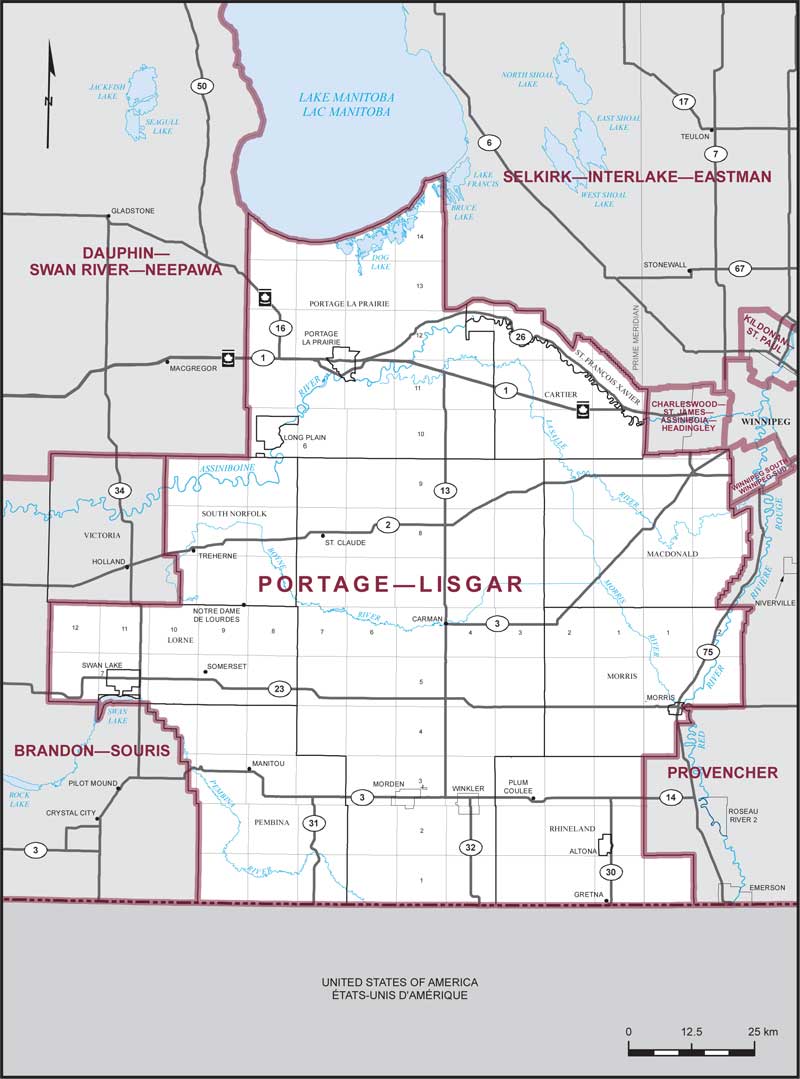
Portage—LisgarProvince/Territory:
Manitoba-
Population:
100,417 -
Area:
12,559 km² -
Population density:
8.00/km² -
Population change:
+3.1% -
Average age:
38 -
Average income:
$47,320 -
Voter turnout:
66%
Language spoken most often at home:
-
English:
82,310 -
French:
1,060 -
Indigenous language:
50 -
Most popular other language:
-
German:
6,930
-
-
All others:
6,550
-
-
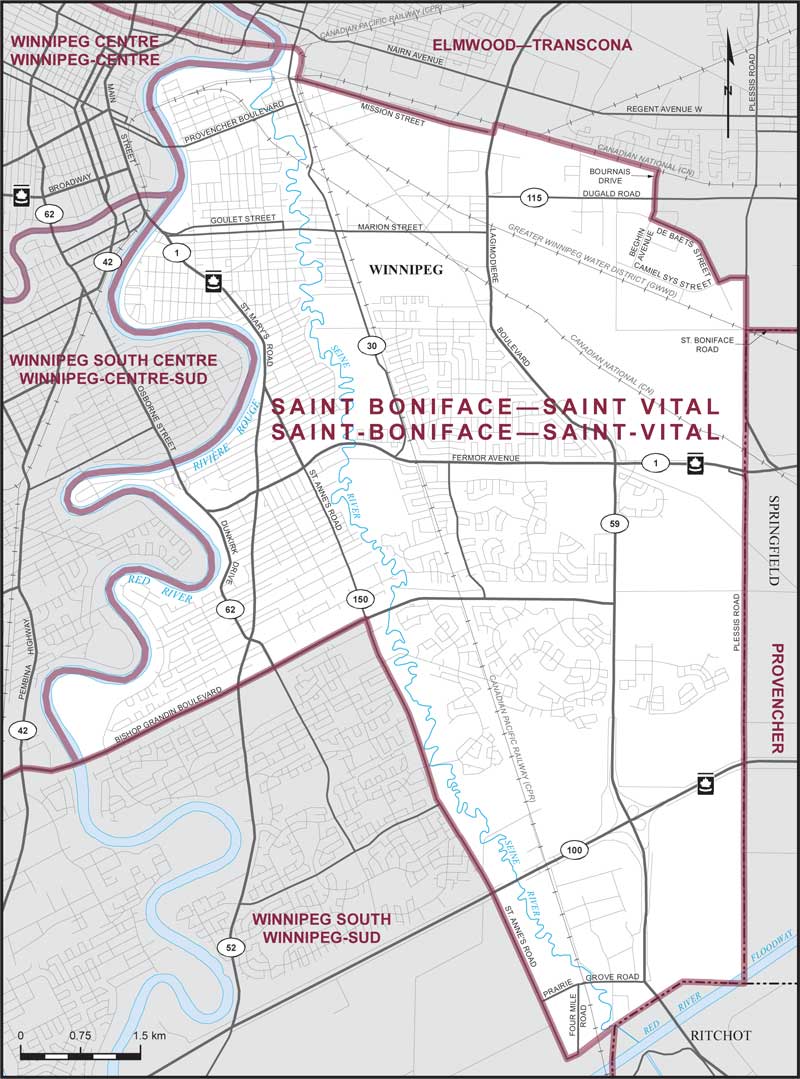
Electoral District:
Saint Boniface—Saint VitalProvince/Territory:
Manitoba-
Population:
95,514 -
Area:
63 km² -
Population density:
1,519.00/km² -
Population change:
+6.3% -
Average age:
41 -
Average income:
$53,500 -
Voter turnout:
66%
Language spoken most often at home:
-
English:
76,710 -
French:
4,575 -
Indigenous language:
40 -
Most popular other language:
-
Punjabi (Panjabi):
1,115
-
-
All others:
8,105
-
-
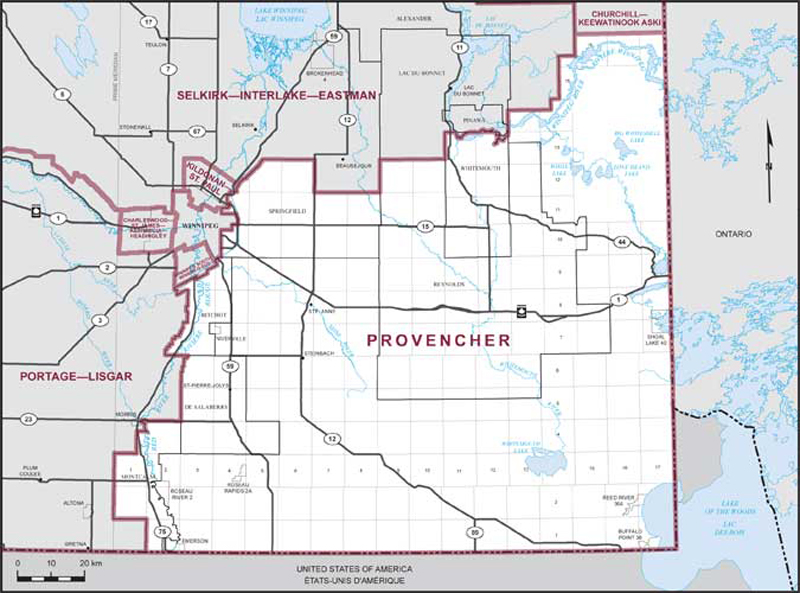
Electoral District:
ProvencherProvince/Territory:
Manitoba-
Population:
109,445 -
Area:
18,031 km² -
Population density:
6.00/km² -
Population change:
+9.5% -
Average age:
37 -
Average income:
$48,880 -
Voter turnout:
67%
Language spoken most often at home:
-
English:
91,865 -
French:
4,235 -
Indigenous language:
20 -
Most popular other language:
-
German:
5,370
-
-
All others:
4,250
-
-
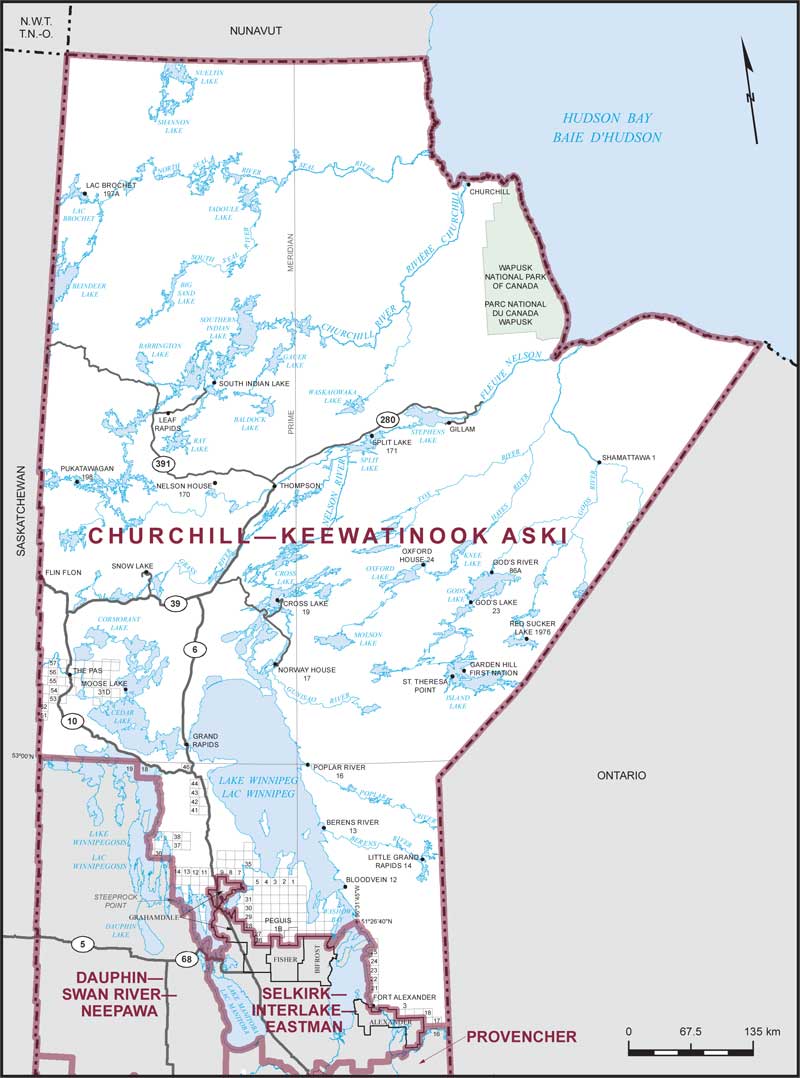
Electoral District:
Churchill—Keewatinook AskiProvince/Territory:
Manitoba-
Population:
81,258 -
Area:
420,975 km² -
Population density:
0.20/km² -
Population change:
-6.5% -
Average age:
32 -
Average income:
$41,080 -
Voter turnout:
36%
Language spoken most often at home:
-
English:
68,120 -
French:
150 -
Indigenous language:
6,035 -
Most popular other language:
-
Punjabi (Panjabi):
360
-
-
All others:
960
-
-
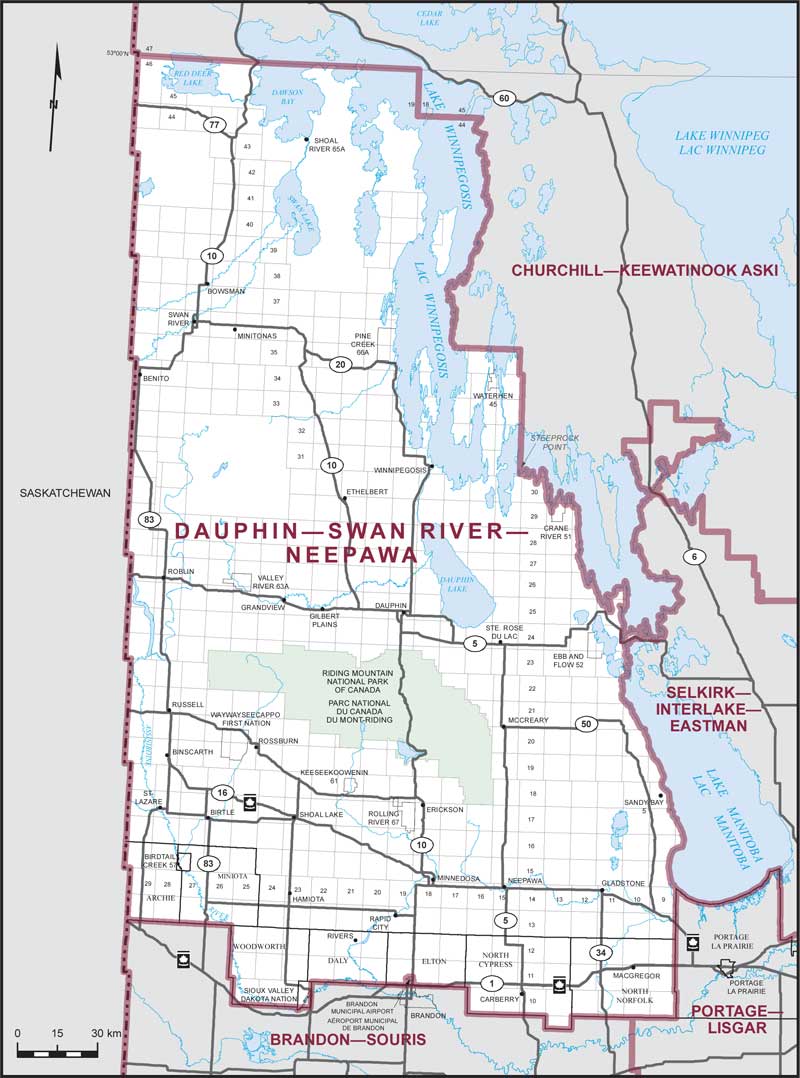
Electoral District:
Dauphin—Swan River—NeepawaProvince/Territory:
Manitoba-
Population:
89,503 -
Area:
50,867 km² -
Population density:
2.00/km² -
Population change:
+2.3% -
Average age:
41 -
Average income:
$43,160 -
Voter turnout:
61%
Language spoken most often at home:
-
English:
80,685 -
French:
210 -
Indigenous language:
545 -
Most popular other language:
-
German:
2,330
-
-
All others:
2,985
-
-
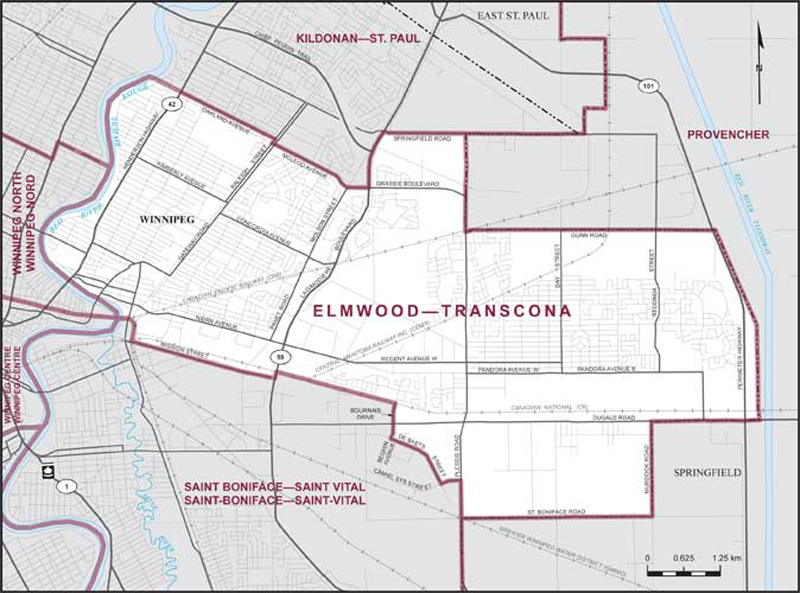
Electoral District:
Elmwood—TransconaProvince/Territory:
Manitoba-
Population:
101,691 -
Area:
50 km² -
Population density:
2,053.00/km² -
Population change:
+9.7% -
Average age:
39 -
Average income:
$46,120 -
Voter turnout:
60%
Language spoken most often at home:
-
English:
82,315 -
French:
695 -
Indigenous language:
60 -
Most popular other language:
-
Punjabi (Panjabi):
3,880
-
-
All others:
9,620
-
-
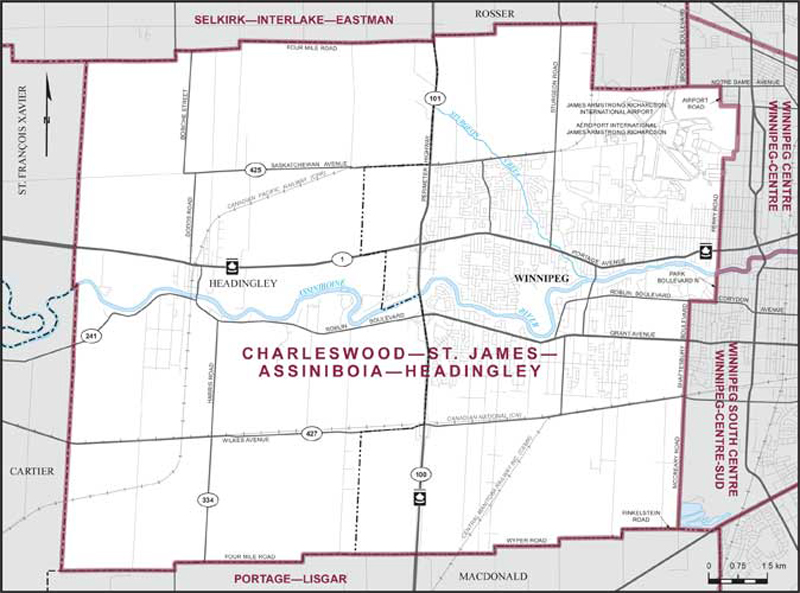
Electoral District:
Charleswood—St. James--Assiniboia—HeadingleyProvince/Territory:
Manitoba-
Population:
84,767 -
Area:
205 km² -
Population density:
414.00/km² -
Population change:
+2.7% -
Average age:
44 -
Average income:
$57,050 -
Voter turnout:
69%
Language spoken most often at home:
-
English:
76,150 -
French:
285 -
Indigenous language:
75 -
Most popular other language:
-
Tagalog (Pilipino, Filipino):
1,050
-
-
All others:
3,700
-
-
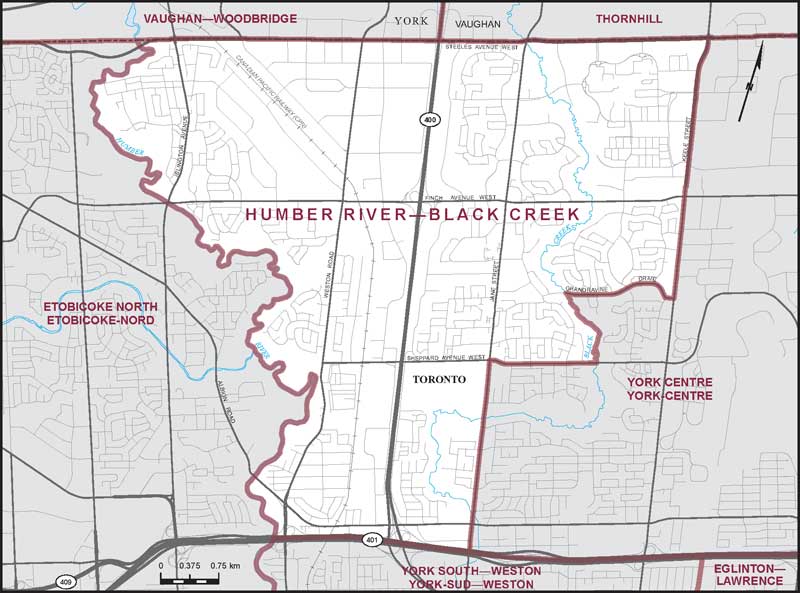
Electoral District:
Humber River—Black CreekProvince/Territory:
Ontario-
Population:
111,593 -
Area:
31 km² -
Population density:
3,646.00/km² -
Population change:
+3.3% -
Average age:
39 -
Average income:
$37,240 -
Voter turnout:
49%
Language spoken most often at home:
-
English:
64,545 -
French:
310 -
Indigenous language:
5 -
Most popular other language:
-
Vietnamese:
5,670
-
-
All others:
30,340
-
-
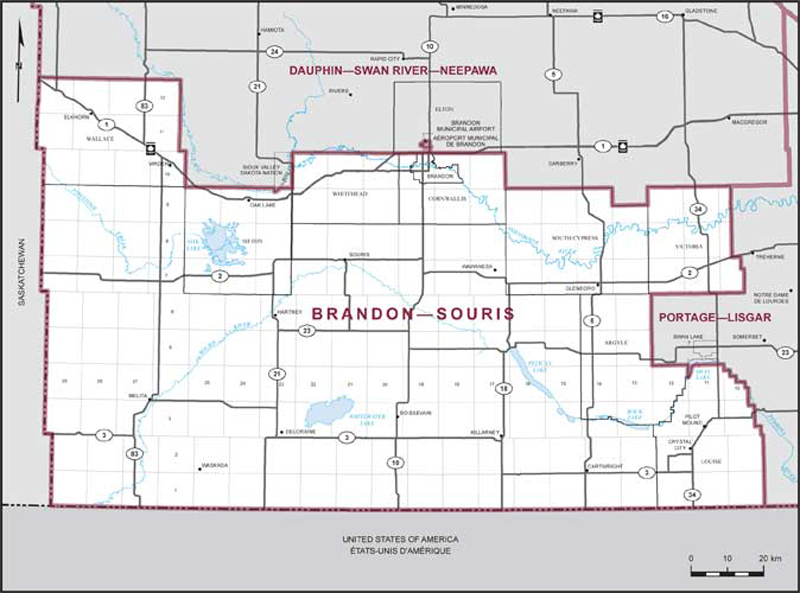
Electoral District:
Brandon—SourisProvince/Territory:
Manitoba-
Population:
89,812 -
Area:
17,969 km² -
Population density:
5.00/km² -
Population change:
+1.9% -
Average age:
40 -
Average income:
$48,680 -
Voter turnout:
62%
Language spoken most often at home:
-
English:
77,510 -
French:
275 -
Indigenous language:
60 -
Most popular other language:
-
Spanish:
1,645
-
-
All others:
6,750
-
-
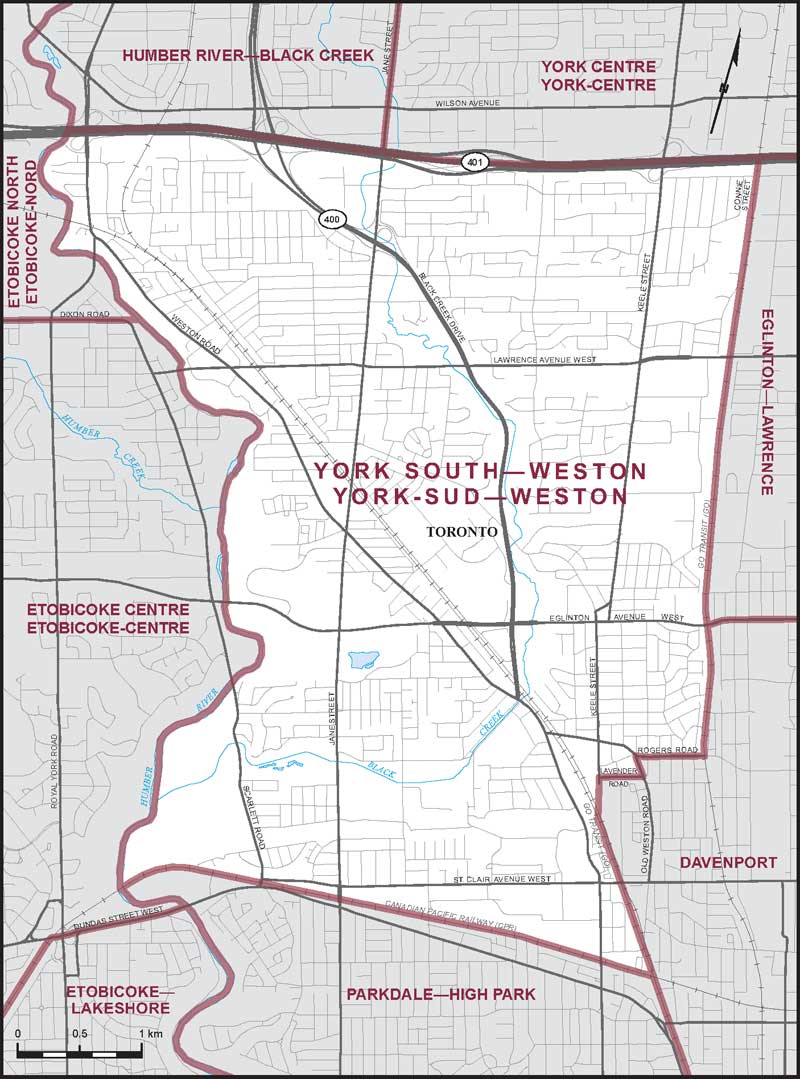
Electoral District:
York South—WestonProvince/Territory:
Ontario-
Population:
116,757 -
Area:
25 km² -
Population density:
4,708.00/km² -
Population change:
+0.1% -
Average age:
41 -
Average income:
$43,360 -
Voter turnout:
51%
Language spoken most often at home:
-
English:
75,305 -
French:
390 -
Indigenous language:
10 -
Most popular other language:
-
Portuguese:
7,105
-
-
All others:
24,420
-
-
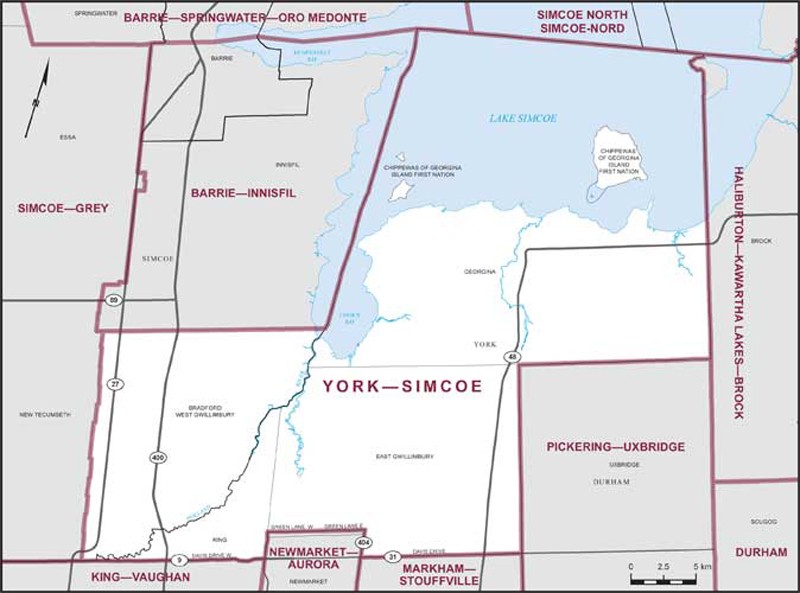
Electoral District:
York—SimcoeProvince/Territory:
Ontario-
Population:
124,458 -
Area:
791 km² -
Population density:
157.00/km² -
Population change:
+19.7% -
Average age:
40 -
Average income:
$55,200 -
Voter turnout:
54%
Language spoken most often at home:
-
English:
103,020 -
French:
320 -
Indigenous language:
0 -
Most popular other language:
-
Mandarin & Yue (Cantonese):
3,350
-
-
All others:
12,010
-
-
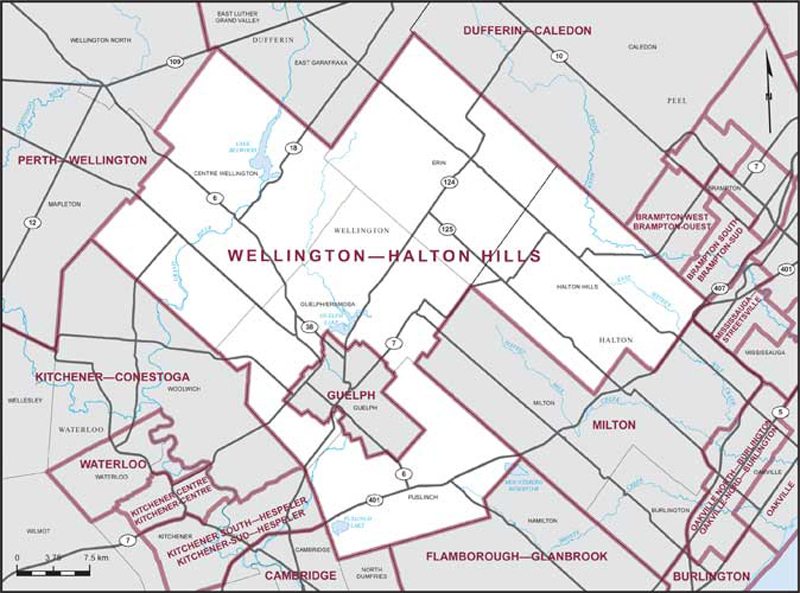
Electoral District:
Wellington—Halton HillsProvince/Territory:
Ontario-
Population:
127,873 -
Area:
1,493 km² -
Population density:
86.00/km² -
Population change:
+5.7% -
Average age:
42 -
Average income:
$66,200 -
Voter turnout:
67%
Language spoken most often at home:
-
English:
118,775 -
French:
410 -
Indigenous language:
0 -
Most popular other language:
-
Punjabi (Panjabi):
985
-
-
All others:
4,735
-
-
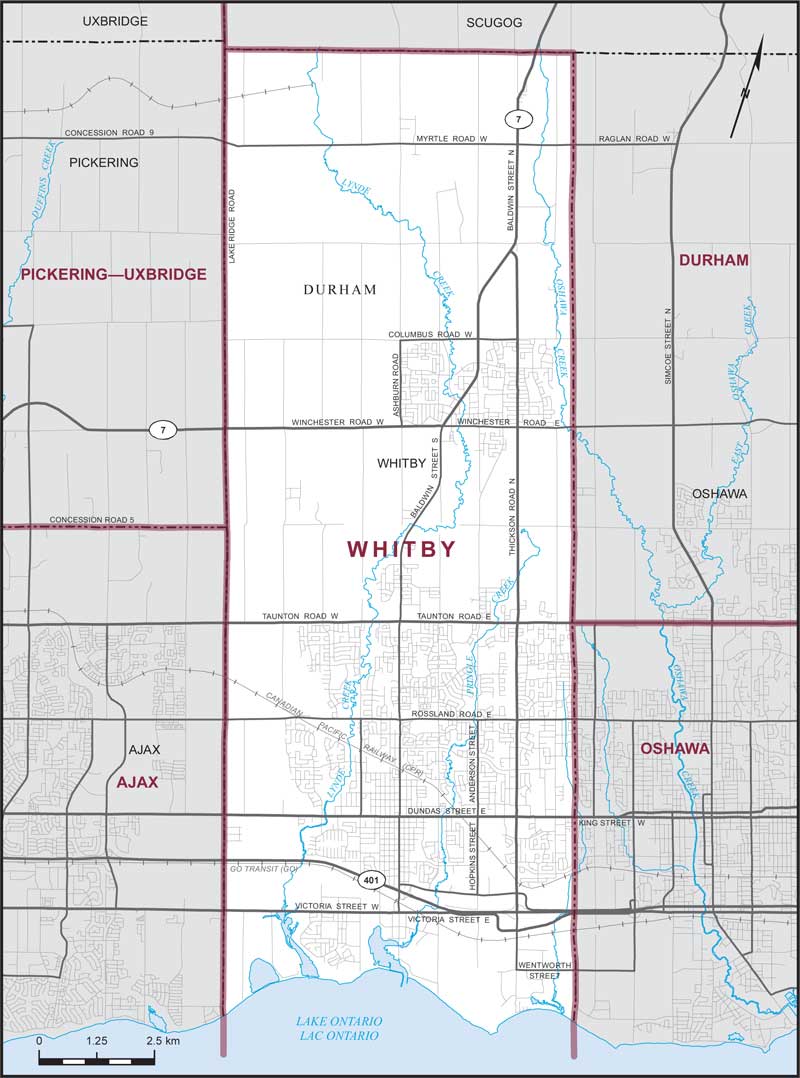
Electoral District:
WhitbyProvince/Territory:
Ontario-
Population:
138,501 -
Area:
147 km² -
Population density:
944.00/km² -
Population change:
+7.9% -
Average age:
40 -
Average income:
$63,000 -
Voter turnout:
62%
Language spoken most often at home:
-
English:
117,430 -
French:
695 -
Indigenous language:
0 -
Most popular other language:
-
Tamil:
1,630
-
-
All others:
11,620
-