Federal Electoral District Fact Sheets
-
Electoral District:
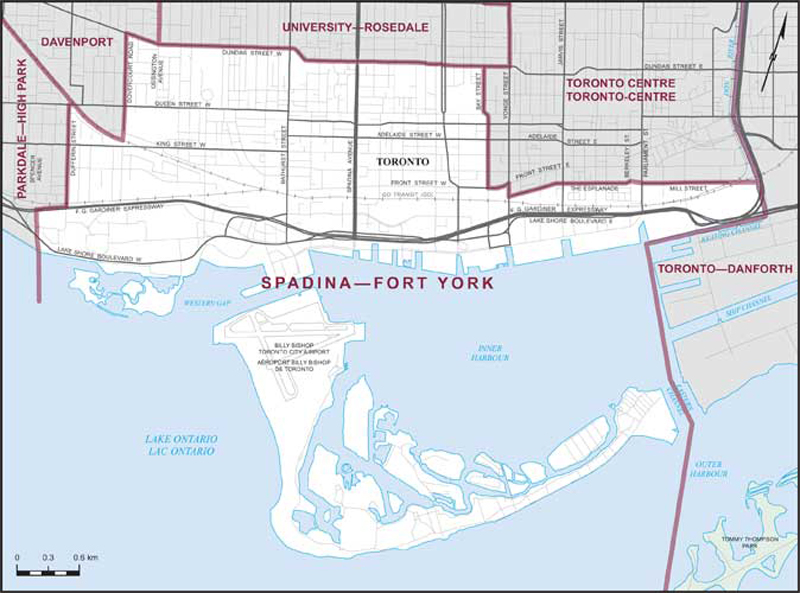
Spadina—Fort YorkProvince/Territory:
Ontario-
Population:
136,213 -
Area:
13 km² -
Population density:
10,675.00/km² -
Population change:
+17.9% -
Average age:
37 -
Average income:
$78,400 -
Voter turnout:
54%
Language spoken most often at home:
-
English:
105,020 -
French:
1,495 -
Indigenous language:
0 -
Most popular other language:
-
Mandarin & Yue (Cantonese):
8,095
-
-
All others:
13,545
-
-
Electoral District:
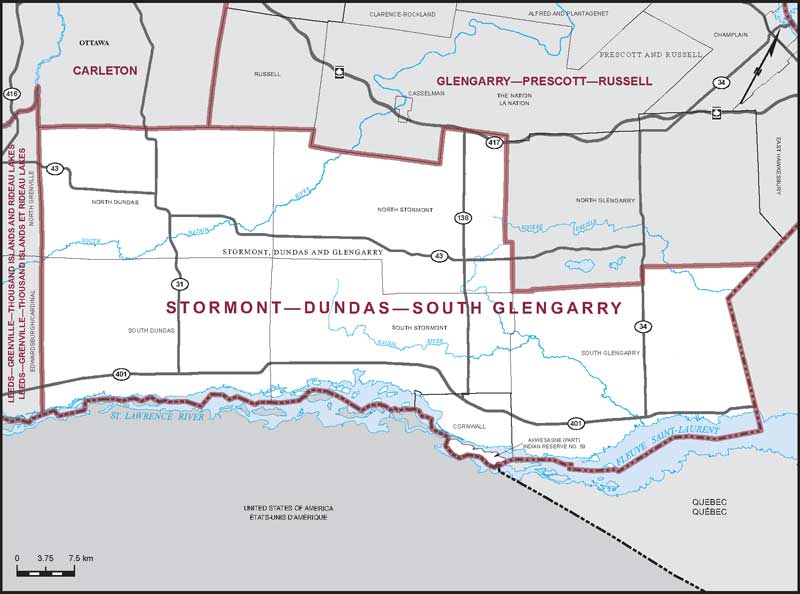
Stormont—Dundas—South GlengarryProvince/Territory:
Ontario-
Population:
104,493 -
Area:
2,665 km² -
Population density:
39.00/km² -
Population change:
+1.1% -
Average age:
45 -
Average income:
$47,160 -
Voter turnout:
62%
Language spoken most often at home:
-
English:
89,990 -
French:
8,000 -
Indigenous language:
10 -
Most popular other language:
-
Urdu:
585
-
-
All others:
1,915
-
-
Electoral District:
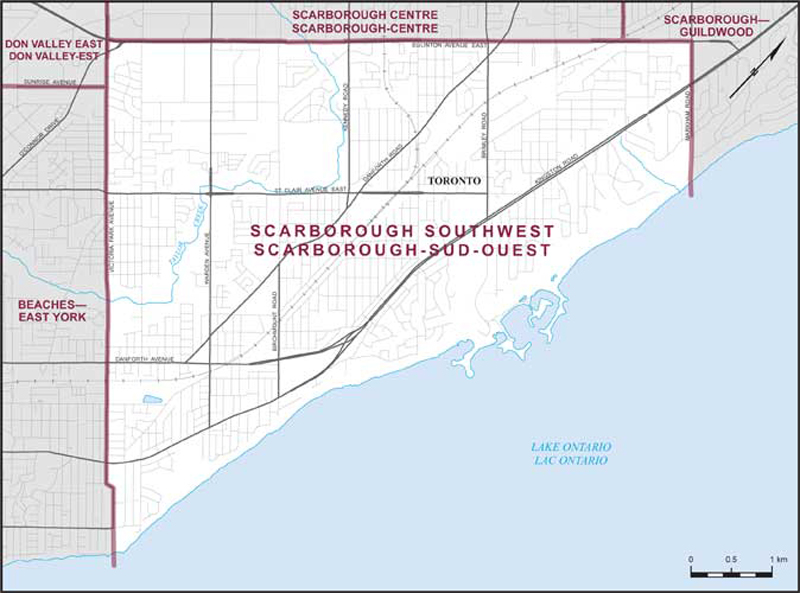
Scarborough SouthwestProvince/Territory:
Ontario-
Population:
111,994 -
Area:
28 km² -
Population density:
3,982.00/km² -
Population change:
+1.6% -
Average age:
41 -
Average income:
$49,160 -
Voter turnout:
57%
Language spoken most often at home:
-
English:
74,700 -
French:
590 -
Indigenous language:
5 -
Most popular other language:
-
Bengali:
6,145
-
-
All others:
19,830
-
-
Electoral District:
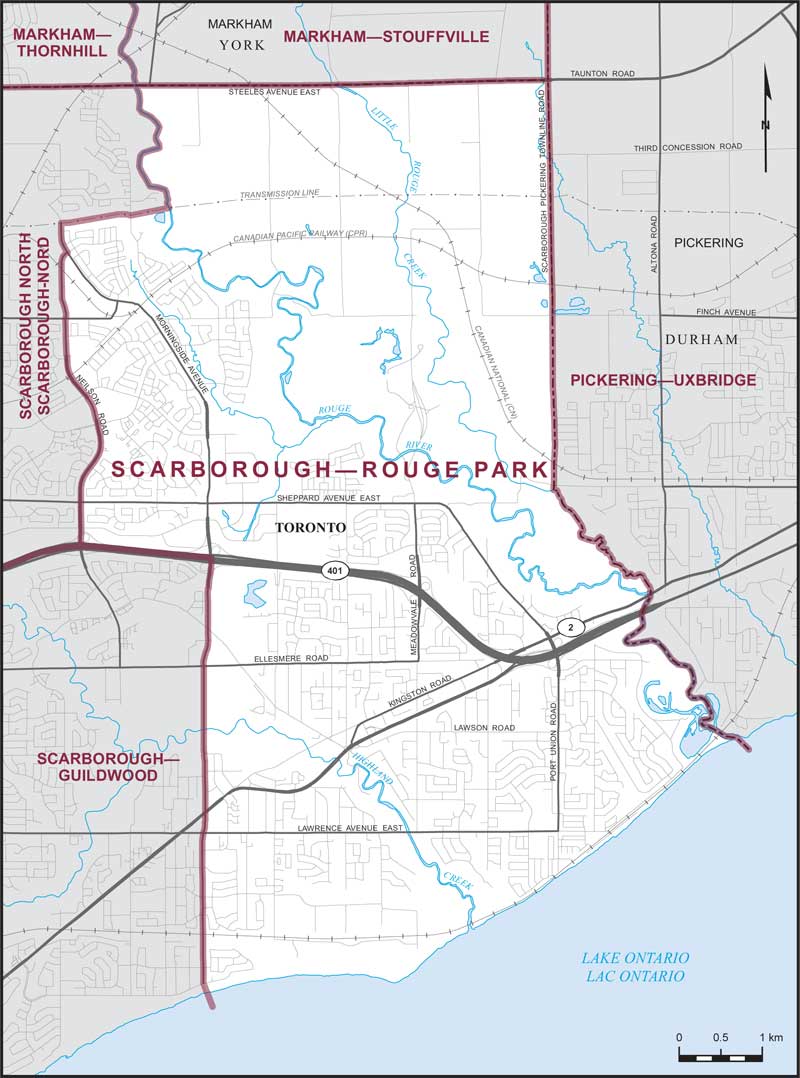
Scarborough—Rouge ParkProvince/Territory:
Ontario-
Population:
102,254 -
Area:
53 km² -
Population density:
1,921.00/km² -
Population change:
0% -
Average age:
42 -
Average income:
$47,840 -
Voter turnout:
61%
Language spoken most often at home:
-
English:
68,655 -
French:
390 -
Indigenous language:
0 -
Most popular other language:
-
Tamil:
8,310
-
-
All others:
15,760
-
-
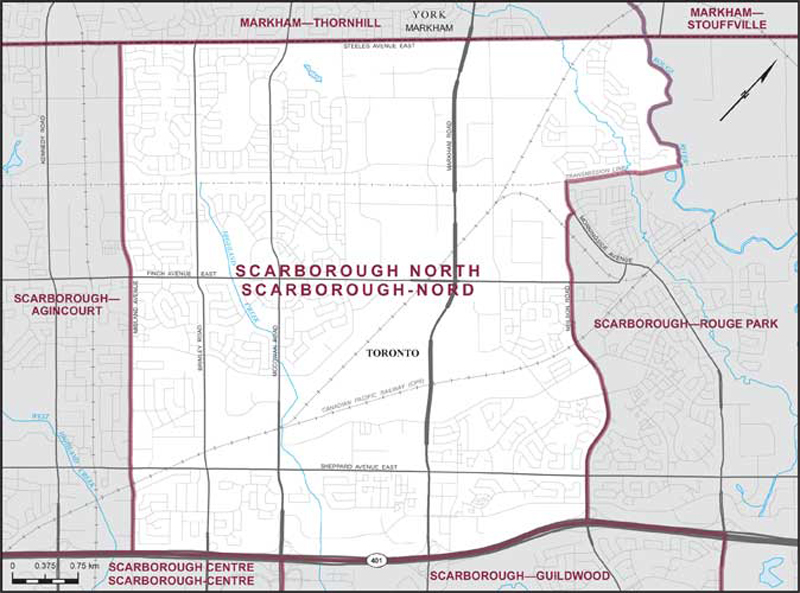
Electoral District:
Scarborough NorthProvince/Territory:
Ontario-
Population:
94,717 -
Area:
30 km² -
Population density:
3,119.00/km² -
Population change:
-4.1% -
Average age:
43 -
Average income:
$38,560 -
Voter turnout:
50%
Language spoken most often at home:
-
English:
38,545 -
French:
210 -
Indigenous language:
0 -
Most popular other language:
-
Yue (Cantonese) & Mandarin:
27,590
-
-
All others:
18,360
-
-
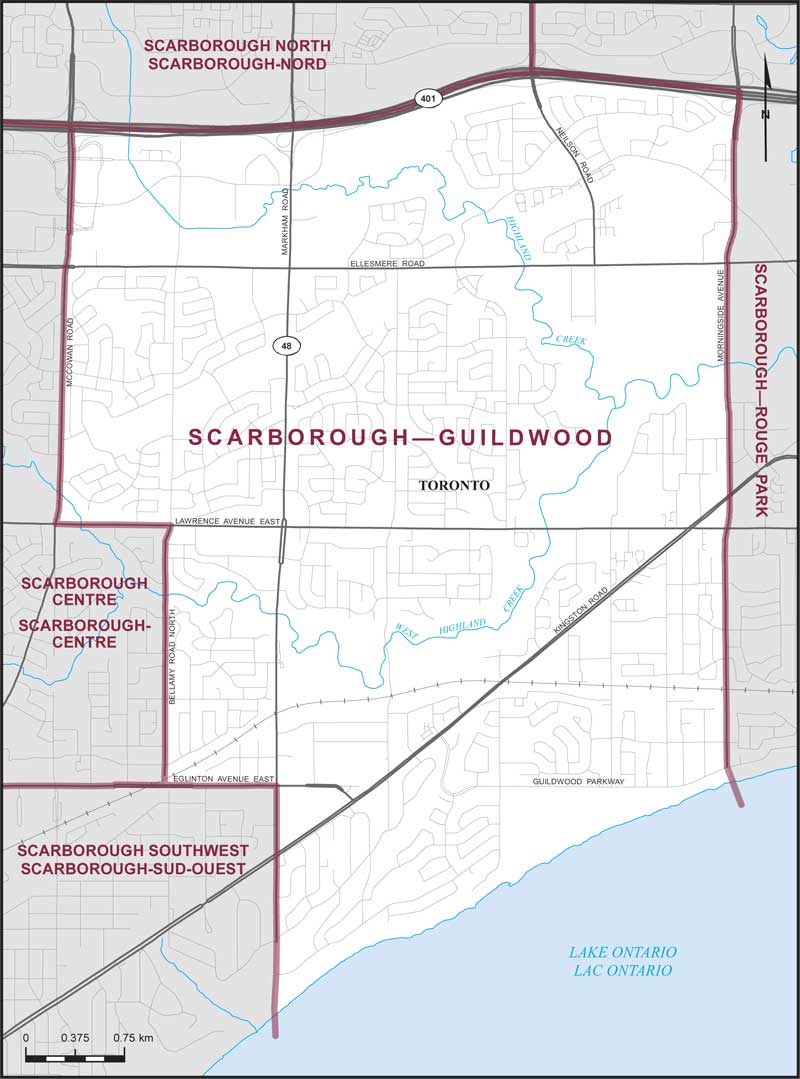
Electoral District:
Scarborough—GuildwoodProvince/Territory:
Ontario-
Population:
103,449 -
Area:
26 km² -
Population density:
3,988.00/km² -
Population change:
+1% -
Average age:
40 -
Average income:
$41,760 -
Voter turnout:
58%
Language spoken most often at home:
-
English:
61,955 -
French:
615 -
Indigenous language:
5 -
Most popular other language:
-
Tamil:
5,690
-
-
All others:
24,180
-
-
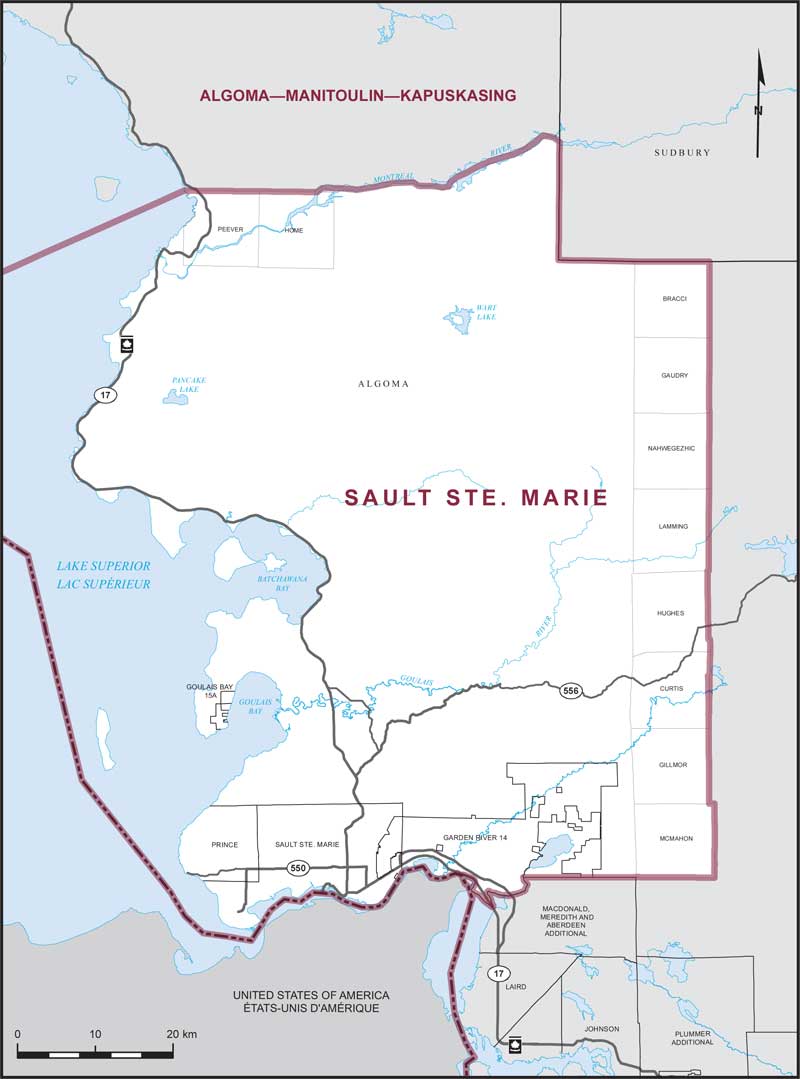
Electoral District:
Sault Ste. MarieProvince/Territory:
Ontario-
Population:
79,331 -
Area:
5,540 km² -
Population density:
14.00/km² -
Population change:
-1.3% -
Average age:
45 -
Average income:
$49,640 -
Voter turnout:
61%
Language spoken most often at home:
-
English:
75,245 -
French:
440 -
Indigenous language:
15 -
Most popular other language:
-
Italian:
640
-
-
All others:
1,325
-
-
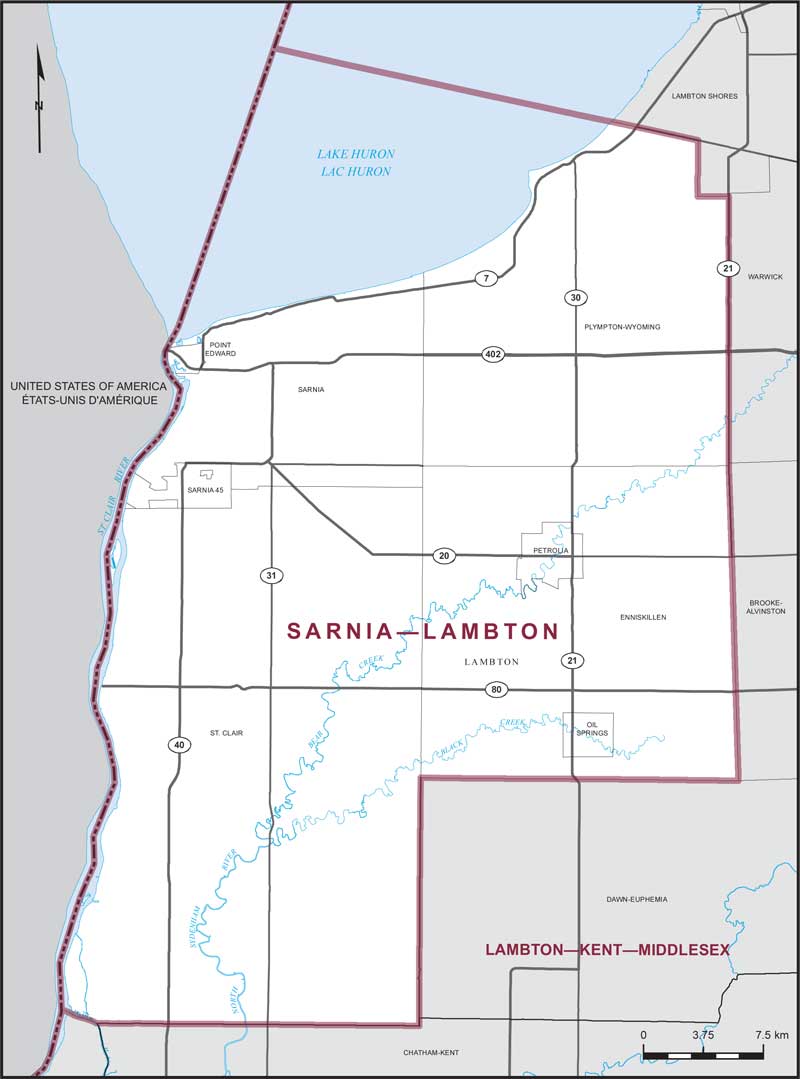
Electoral District:
Sarnia—LambtonProvince/Territory:
Ontario-
Population:
107,077 -
Area:
1,476 km² -
Population density:
73.00/km² -
Population change:
+1.7% -
Average age:
44 -
Average income:
$55,500 -
Voter turnout:
67%
Language spoken most often at home:
-
English:
101,765 -
French:
430 -
Indigenous language:
15 -
Most popular other language:
-
Spanish:
340
-
-
All others:
2,350
-
-
Electoral District:
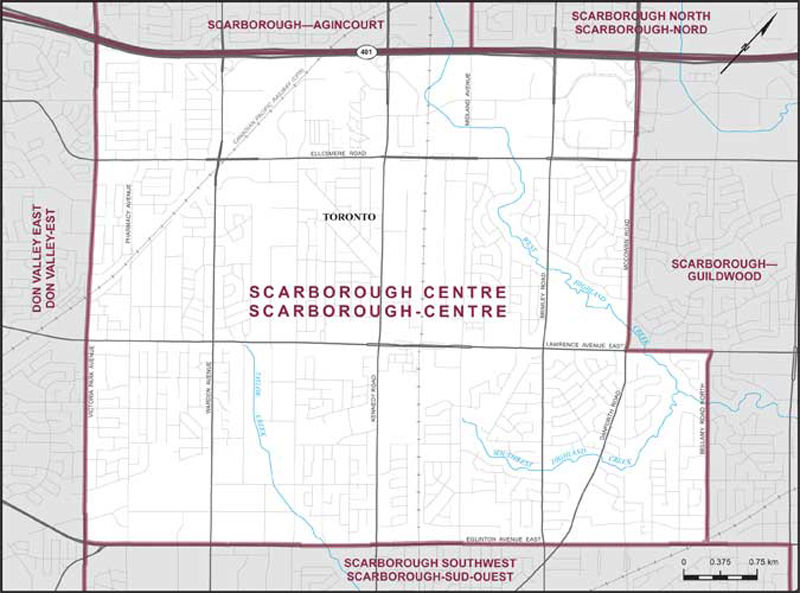
Scarborough CentreProvince/Territory:
Ontario-
Population:
113,104 -
Area:
28 km² -
Population density:
4,022.00/km² -
Population change:
+0.4% -
Average age:
41 -
Average income:
$41,560 -
Voter turnout:
55%
Language spoken most often at home:
-
English:
64,490 -
French:
540 -
Indigenous language:
0 -
Most popular other language:
-
Tamil:
5,835
-
-
All others:
29,220
-
-
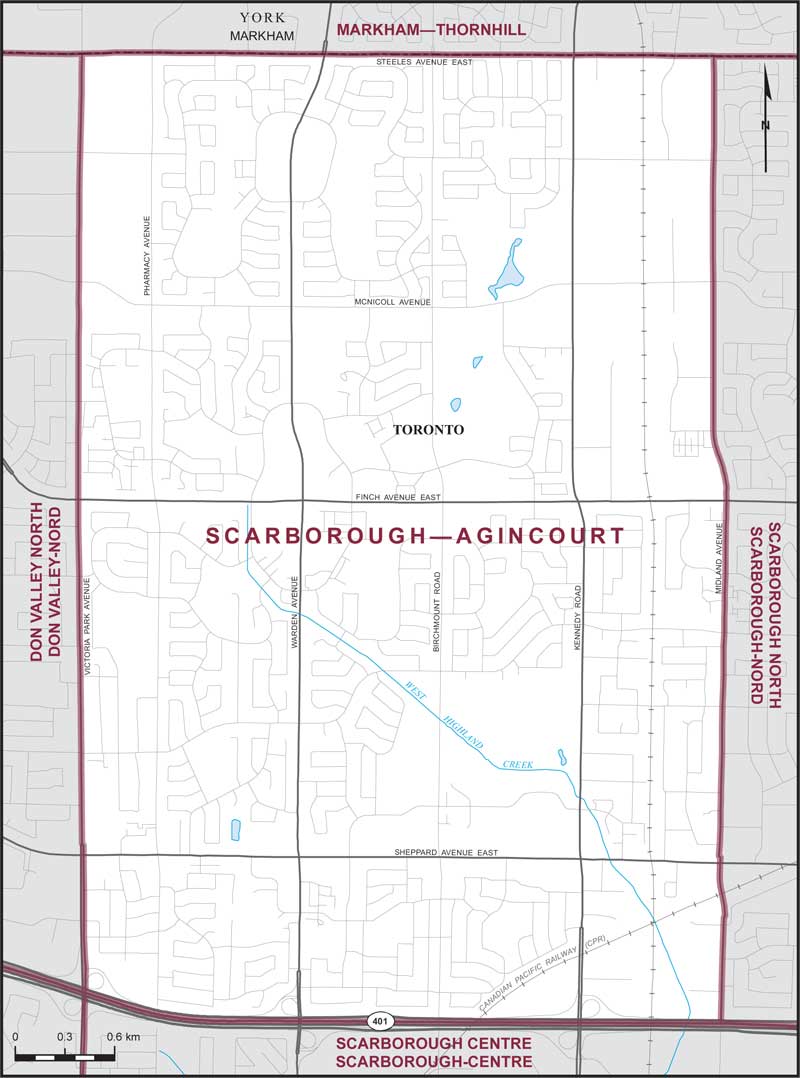
Electoral District:
Scarborough—AgincourtProvince/Territory:
Ontario-
Population:
104,426 -
Area:
21 km² -
Population density:
4,891.00/km² -
Population change:
-1.1% -
Average age:
45 -
Average income:
$41,560 -
Voter turnout:
53%
Language spoken most often at home:
-
English:
45,395 -
French:
355 -
Indigenous language:
0 -
Most popular other language:
-
Mandarin & Yue (Cantonese):
30,620
-
-
All others:
18,295
-
-
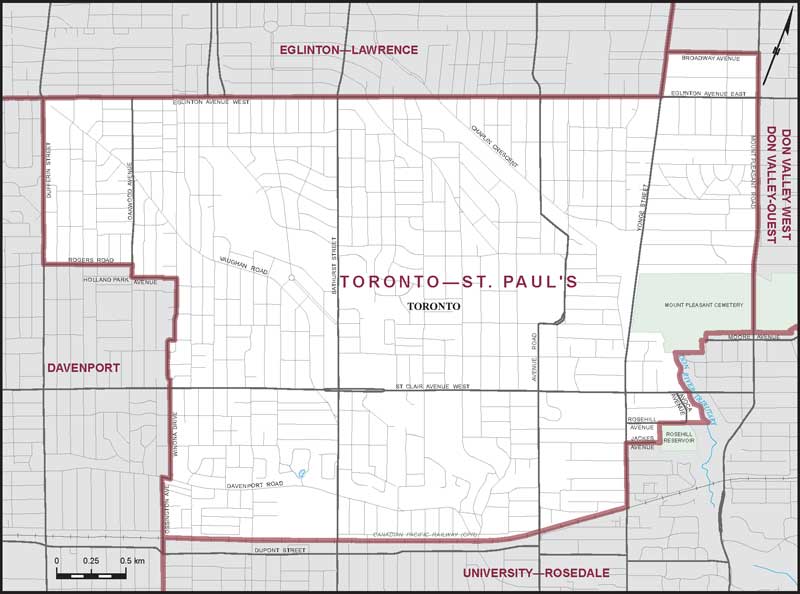
Electoral District:
Toronto—St. Paul'sProvince/Territory:
Ontario-
Population:
116,953 -
Area:
13 km² -
Population density:
8,915.00/km² -
Population change:
+8.4% -
Average age:
44 -
Average income:
$96,000 -
Voter turnout:
66%
Language spoken most often at home:
-
English:
91,200 -
French:
905 -
Indigenous language:
5 -
Most popular other language:
-
Spanish:
2,395
-
-
All others:
15,305
-
-
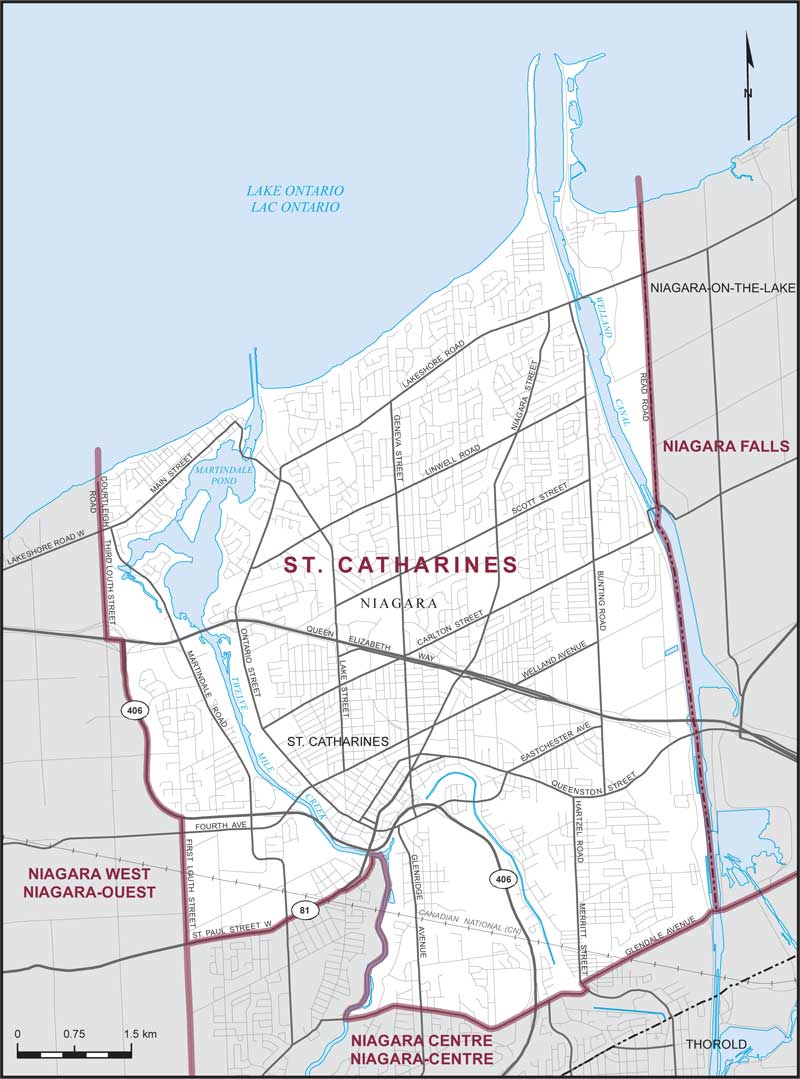
Electoral District:
St. CatharinesProvince/Territory:
Ontario-
Population:
114,782 -
Area:
55 km² -
Population density:
2,082.00/km² -
Population change:
+2.8% -
Average age:
45 -
Average income:
$46,760 -
Voter turnout:
65%
Language spoken most often at home:
-
English:
101,305 -
French:
610 -
Indigenous language:
5 -
Most popular other language:
-
Spanish:
1,570
-
-
All others:
6,755
-
-
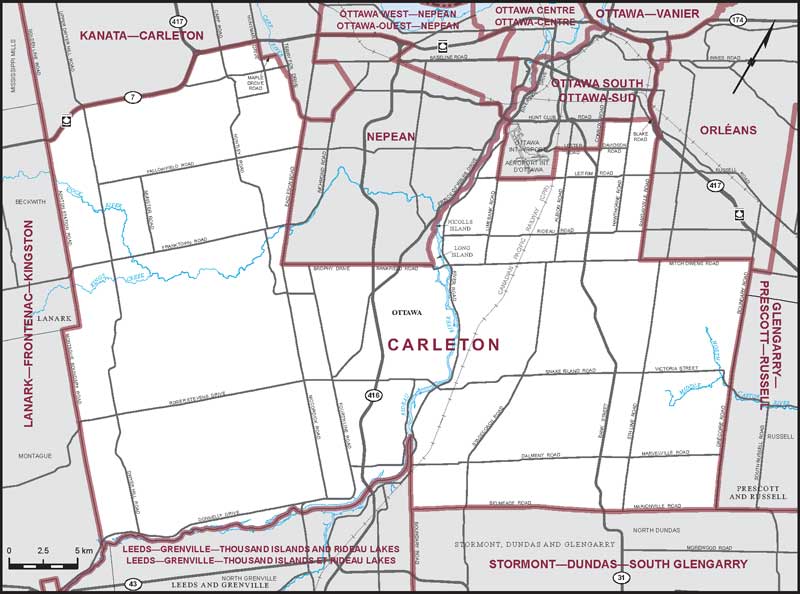
Electoral District:
CarletonProvince/Territory:
Ontario-
Population:
131,375 -
Area:
1,178 km² -
Population density:
112.00/km² -
Population change:
+27.7% -
Average age:
39 -
Average income:
$72,300 -
Voter turnout:
74%
Language spoken most often at home:
-
English:
107,140 -
French:
4,095 -
Indigenous language:
0 -
Most popular other language:
-
Arabic:
2,600
-
-
All others:
10,410
-
-
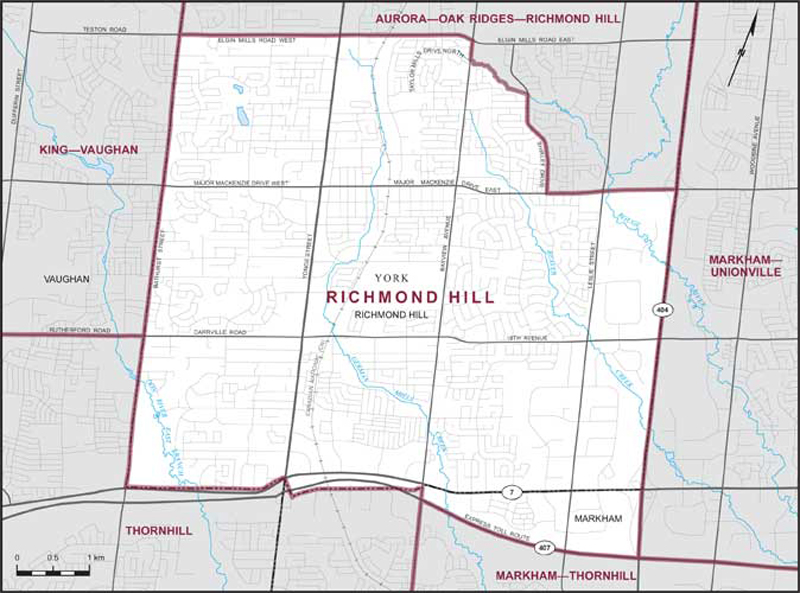
Electoral District:
Richmond HillProvince/Territory:
Ontario-
Population:
114,180 -
Area:
40 km² -
Population density:
2,867.00/km² -
Population change:
+3.6% -
Average age:
44 -
Average income:
$55,000 -
Voter turnout:
56%
Language spoken most often at home:
-
English:
56,295 -
French:
220 -
Indigenous language:
0 -
Most popular other language:
-
Yue (Cantonese) & Mandarin:
22,475
-
-
All others:
25,365
-
-
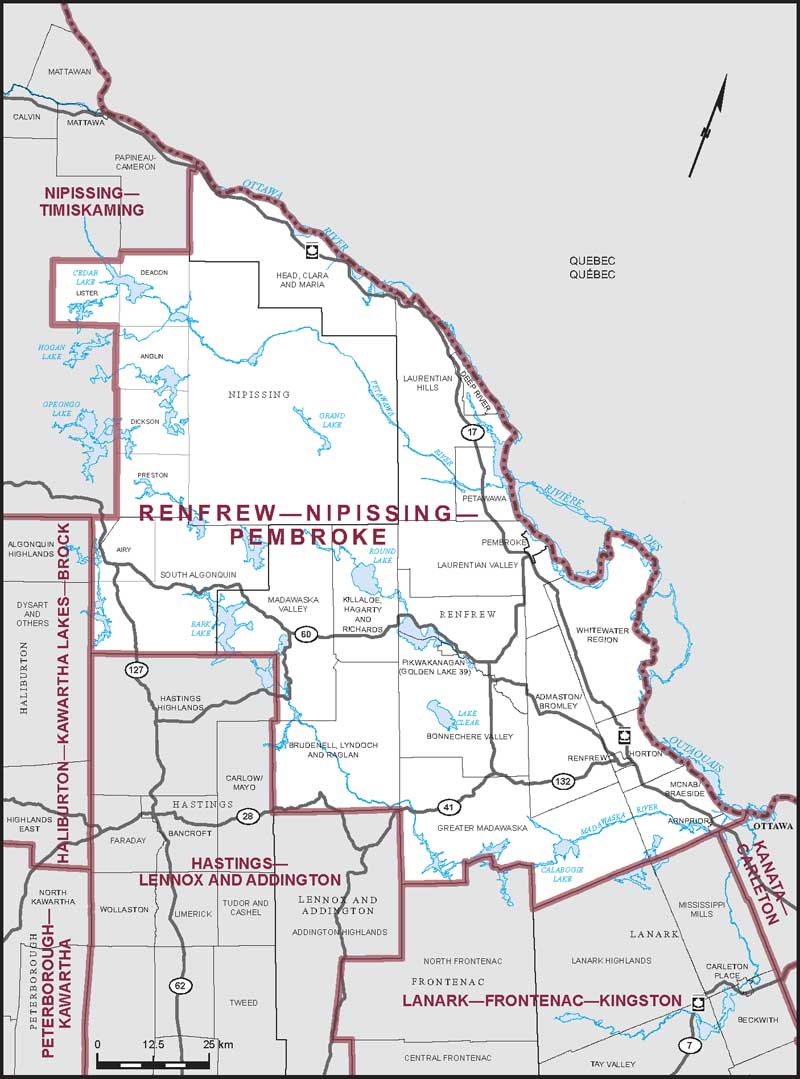
Electoral District:
Renfrew—Nipissing—PembrokeProvince/Territory:
Ontario-
Population:
107,420 -
Area:
11,359 km² -
Population density:
10.00/km² -
Population change:
+3.8% -
Average age:
44 -
Average income:
$50,200 -
Voter turnout:
67%
Language spoken most often at home:
-
English:
101,960 -
French:
2,040 -
Indigenous language:
0 -
Most popular other language:
-
German & Pennsylvania German:
300
-
-
All others:
1,115
-
-
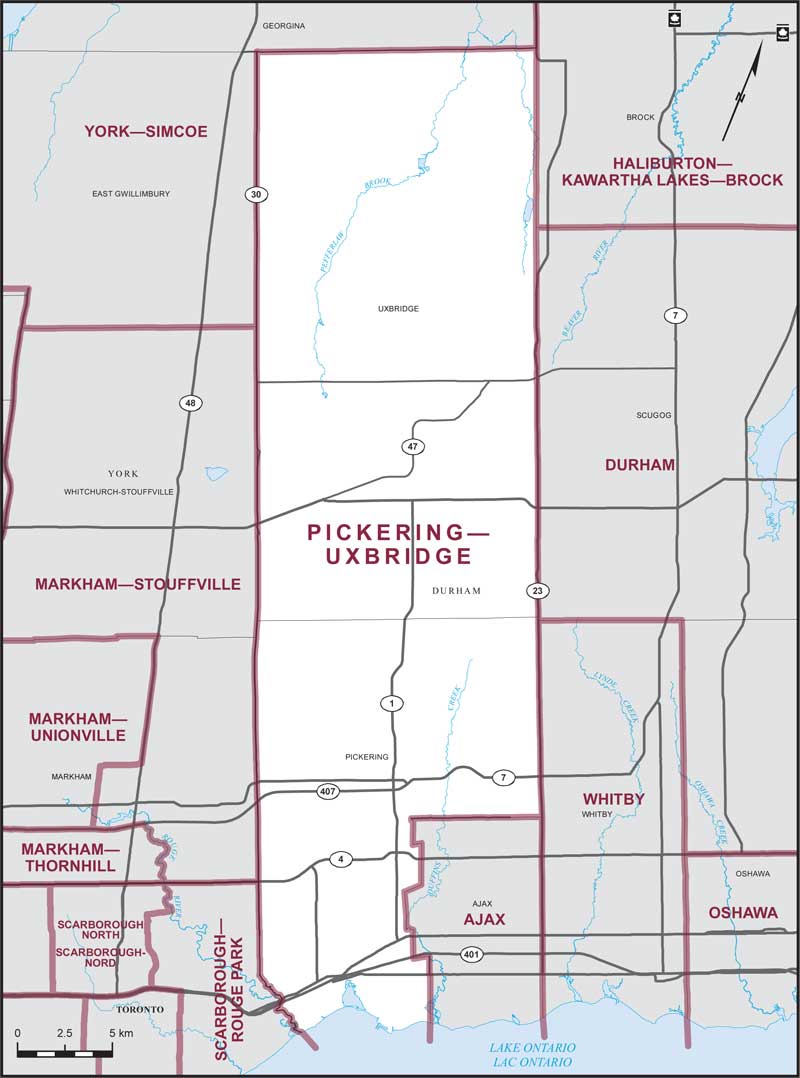
Electoral District:
Pickering—UxbridgeProvince/Territory:
Ontario-
Population:
120,742 -
Area:
652 km² -
Population density:
185.00/km² -
Population change:
+6.9% -
Average age:
42 -
Average income:
$61,350 -
Voter turnout:
62%
Language spoken most often at home:
-
English:
101,605 -
French:
390 -
Indigenous language:
0 -
Most popular other language:
-
Tamil:
2,005
-
-
All others:
10,730
-