Federal Electoral District Fact Sheets
-
Electoral District:
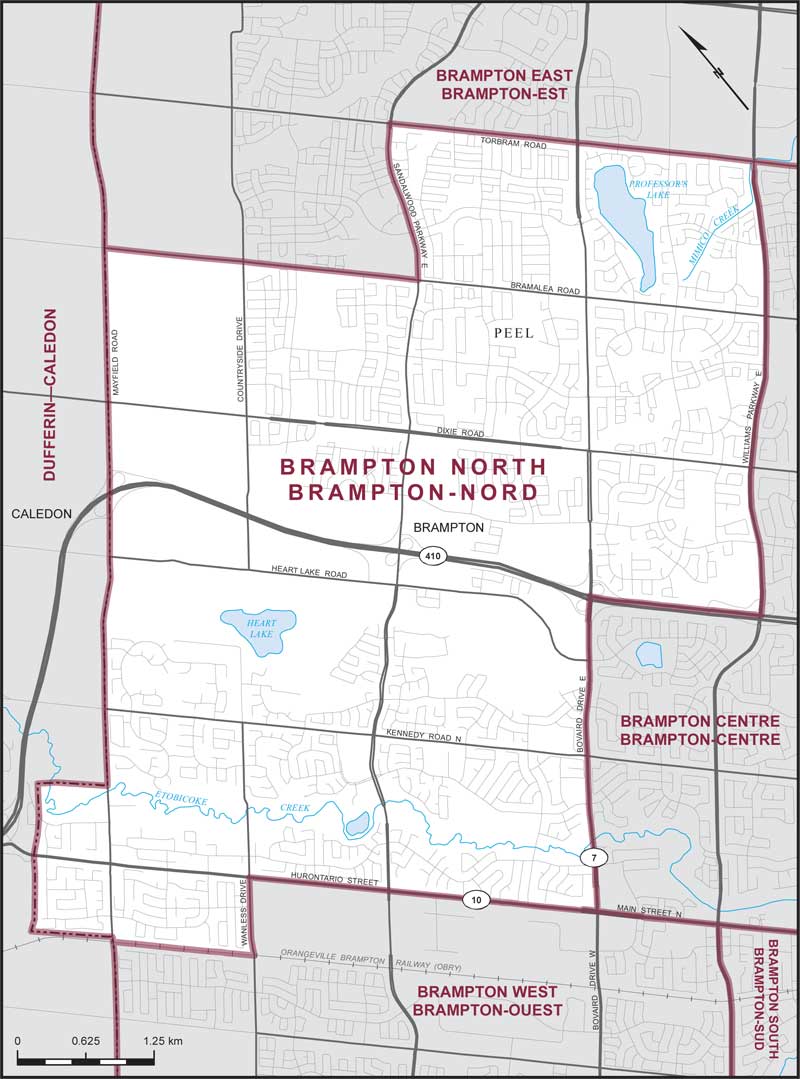
Brampton—Chinguacousy ParkProvince/Territory:
Ontario-
Population:
115,568 -
Area:
37 km² -
Population density:
3,123.00/km² -
Population change:
n/a -
Average age:
39 -
Average income:
$43,840 -
Voter turnout:
56%
Language spoken most often at home:
-
English:
71,270 -
French:
385 -
Indigenous language:
0 -
Most popular other language:
-
Punjabi (Panjabi):
14,825
-
-
All others:
17,680
-
-
Electoral District:
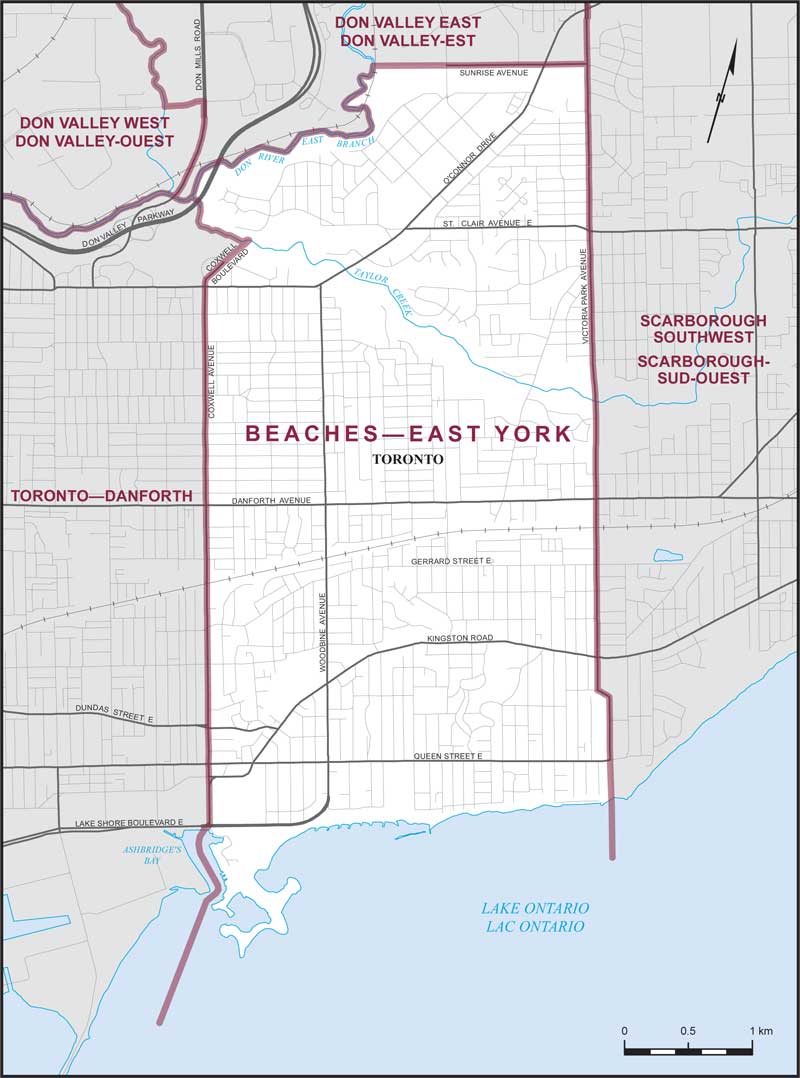
Beaches—East YorkProvince/Territory:
Ontario-
Population:
109,359 -
Area:
17 km² -
Population density:
6,433.00/km² -
Population change:
n/a -
Average age:
41 -
Average income:
$69,500 -
Voter turnout:
65%
Language spoken most often at home:
-
English:
88,500 -
French:
955 -
Indigenous language:
5 -
Most popular other language:
-
Bengali:
2,215
-
-
All others:
11,865
-
-
Electoral District:
Bowmanville—Oshawa NorthProvince/Territory:
Ontario-
Population:
128,534 -
Area:
392 km² -
Population density:
328.00/km² -
Population change:
n/a -
Average age:
38 -
Average income:
$57,150 -
Voter turnout:
60%
Language spoken most often at home:
-
English:
112,725 -
French:
780 -
Indigenous language:
0 -
Most popular other language:
-
Tamil:
1,720
-
-
All others:
8,450
-
-
Electoral District:
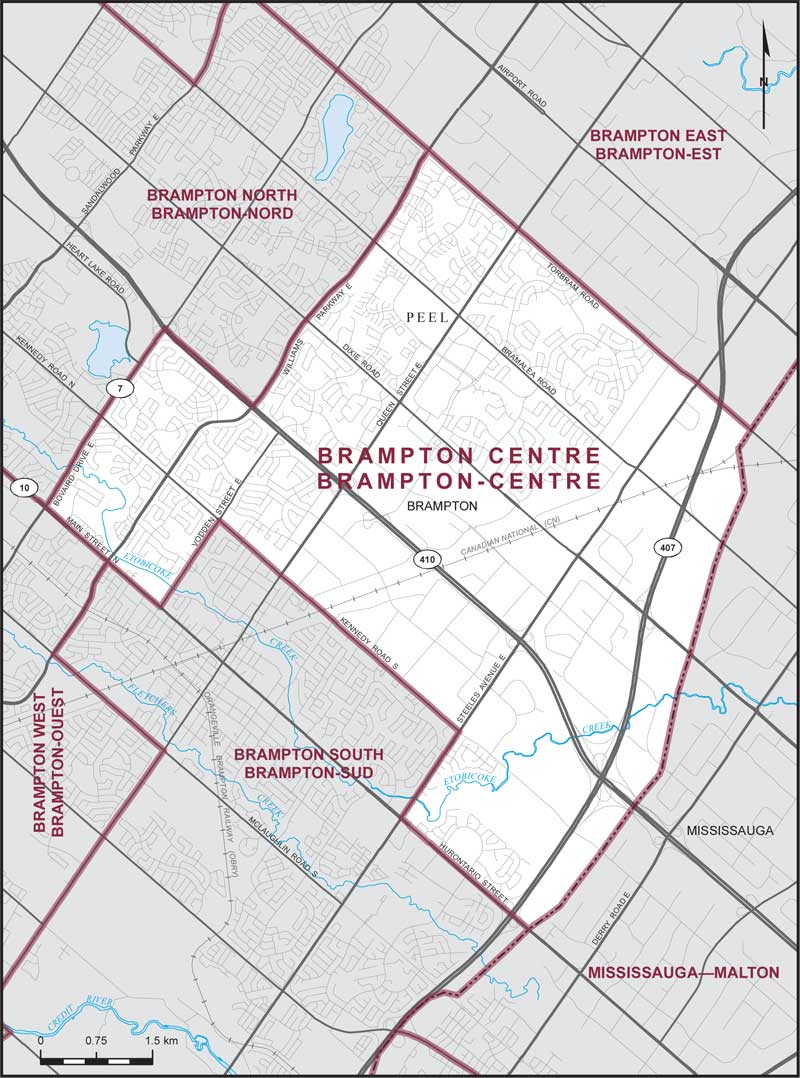
Brampton CentreProvince/Territory:
Ontario-
Population:
109,450 -
Area:
30 km² -
Population density:
3,648.00/km² -
Population change:
n/a -
Average age:
40 -
Average income:
$45,640 -
Voter turnout:
53%
Language spoken most often at home:
-
English:
73,350 -
French:
505 -
Indigenous language:
0 -
Most popular other language:
-
Punjabi (Panjabi):
8,265
-
-
All others:
16,555
-
-
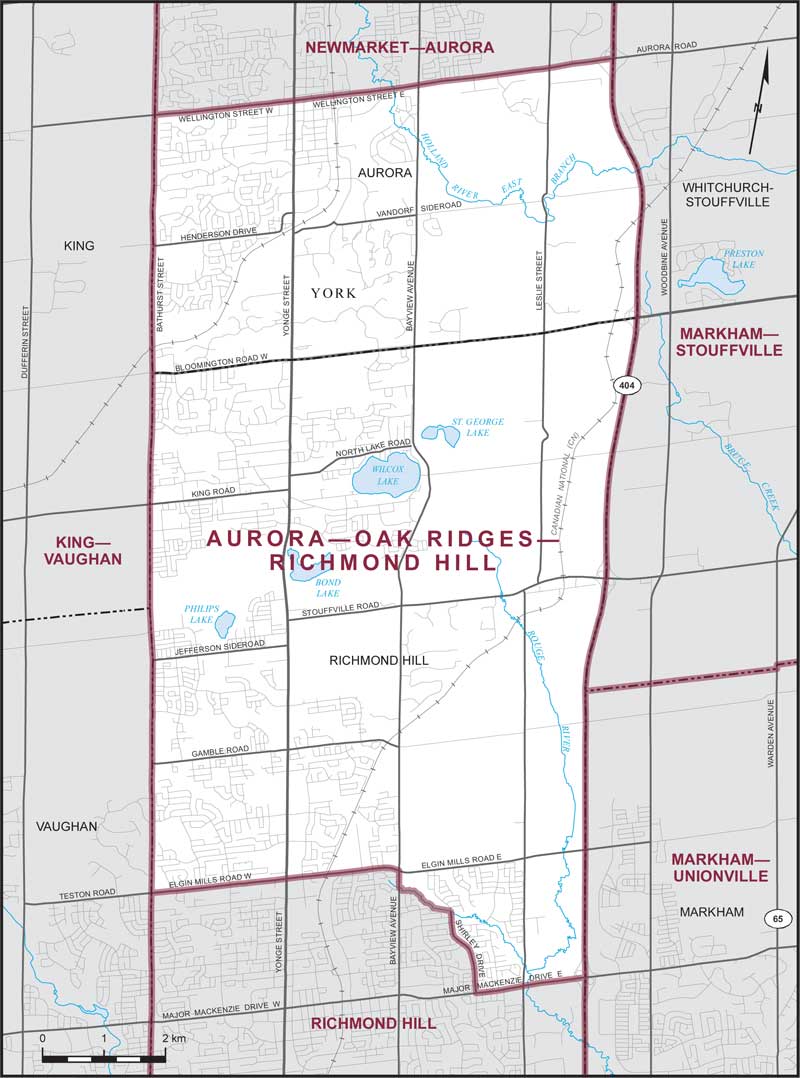
Electoral District:
Aurora—Oak Ridges—Richmond HillProvince/Territory:
Ontario-
Population:
117,750 -
Area:
96 km² -
Population density:
1,227.00/km² -
Population change:
n/a -
Average age:
41 -
Average income:
$65,600 -
Voter turnout:
57%
Language spoken most often at home:
-
English:
71,760 -
French:
330 -
Indigenous language:
0 -
Most popular other language:
-
Mandarin:
10,835
-
-
All others:
25,995
-
-
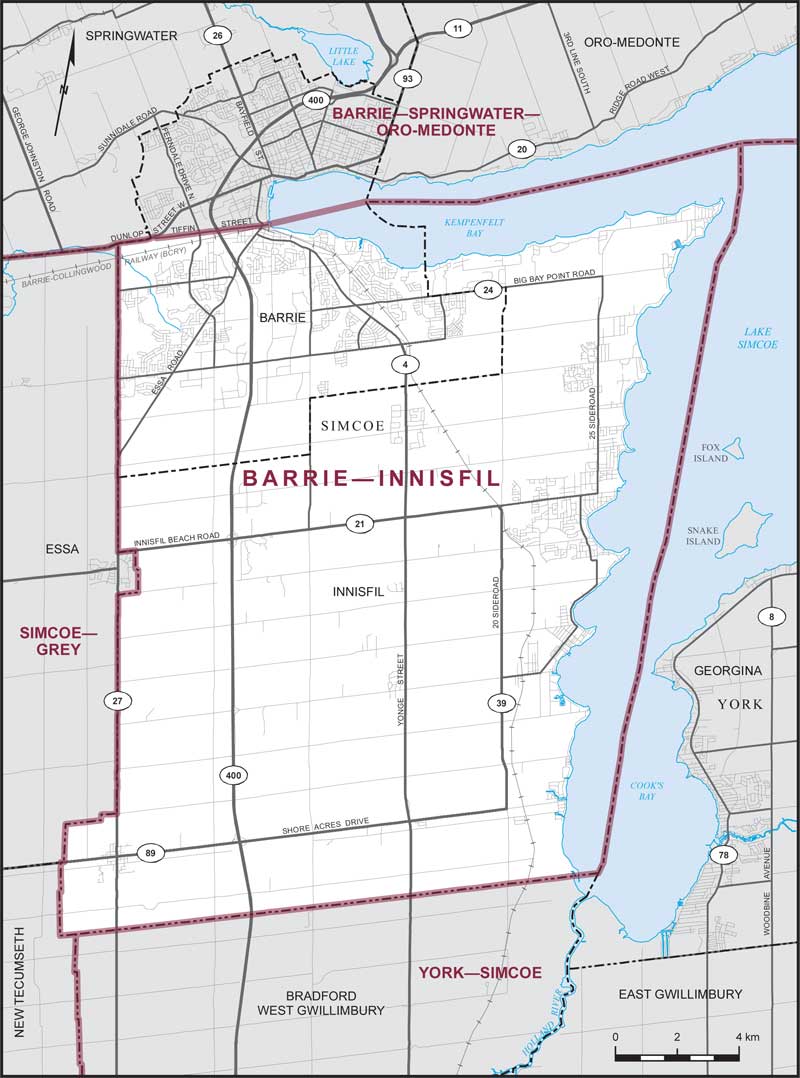
Electoral District:
Barrie South—InnisfilProvince/Territory:
Ontario-
Population:
120,378 -
Area:
331 km² -
Population density:
364.00/km² -
Population change:
n/a -
Average age:
40 -
Average income:
$54,200 -
Voter turnout:
59%
Language spoken most often at home:
-
English:
107,000 -
French:
560 -
Indigenous language:
0 -
Most popular other language:
-
Russian:
1,515
-
-
All others:
7,685
-
-
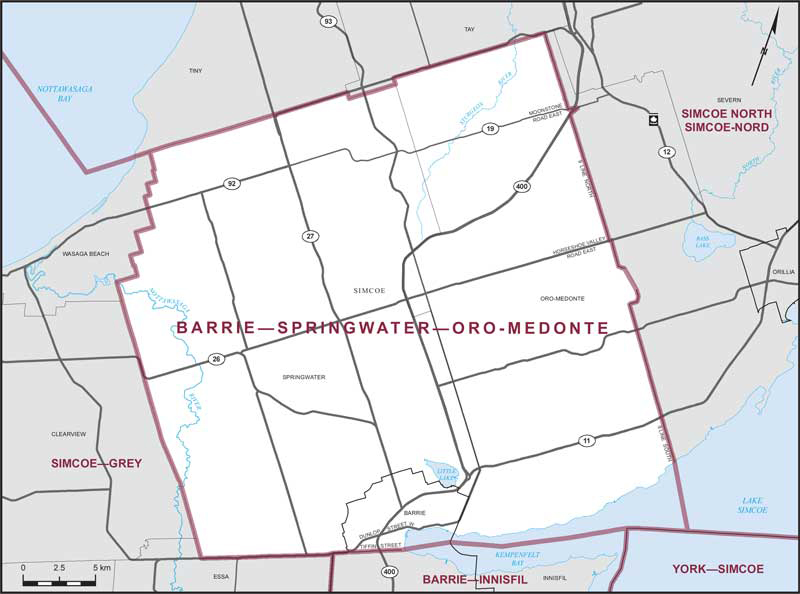
Electoral District:
Barrie—Springwater—Oro-MedonteProvince/Territory:
Ontario-
Population:
115,495 -
Area:
1,152 km² -
Population density:
100.00/km² -
Population change:
n/a -
Average age:
42 -
Average income:
$55,100 -
Voter turnout:
64%
Language spoken most often at home:
-
English:
106,585 -
French:
535 -
Indigenous language:
5 -
Most popular other language:
-
Spanish:
570
-
-
All others:
4,665
-
-
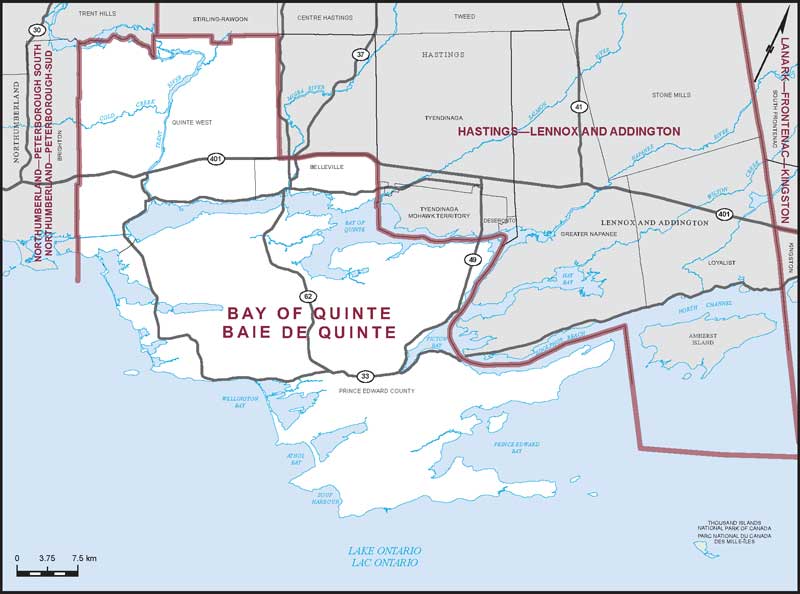
Electoral District:
Bay of QuinteProvince/Territory:
Ontario-
Population:
110,164 -
Area:
1,440 km² -
Population density:
77.00/km² -
Population change:
n/a -
Average age:
46 -
Average income:
$48,920 -
Voter turnout:
65%
Language spoken most often at home:
-
English:
104,240 -
French:
1,160 -
Indigenous language:
0 -
Most popular other language:
-
Gujarati:
230
-
-
All others:
2,155
-
-
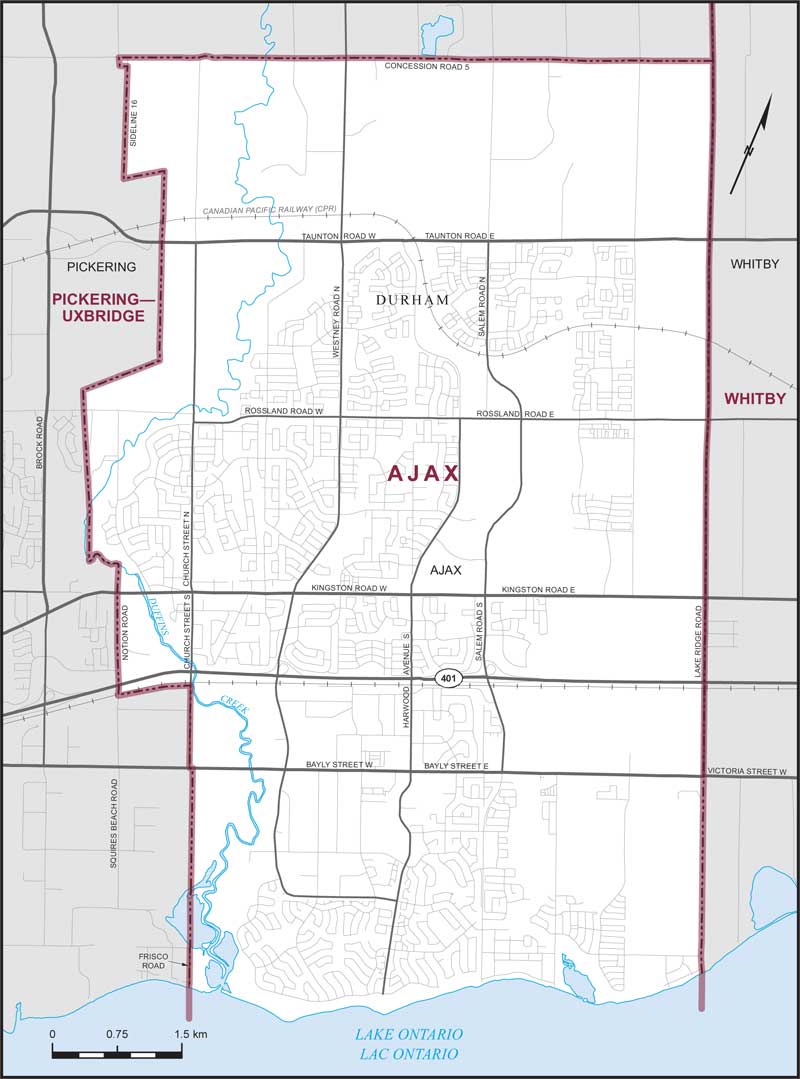
Electoral District:
AjaxProvince/Territory:
Ontario-
Population:
126,666 -
Area:
67 km² -
Population density:
1,891.00/km² -
Population change:
n/a -
Average age:
39 -
Average income:
$54,300 -
Voter turnout:
54%
Language spoken most often at home:
-
English:
96,590 -
French:
715 -
Indigenous language:
0 -
Most popular other language:
-
Tamil:
4,635
-
-
All others:
15,640
-
-
Electoral District:
Algonquin—Renfrew—PembrokeProvince/Territory:
Ontario-
Population:
107,420 -
Area:
11,359 km² -
Population density:
9.00/km² -
Population change:
n/a -
Average age:
44 -
Average income:
$50,200 -
Voter turnout:
67%
Language spoken most often at home:
-
English:
101,960 -
French:
2,040 -
Indigenous language:
0 -
Most popular other language:
-
German:
190
-
-
All others:
1,225
-