Federal Electoral District Fact Sheets
-
Electoral District:
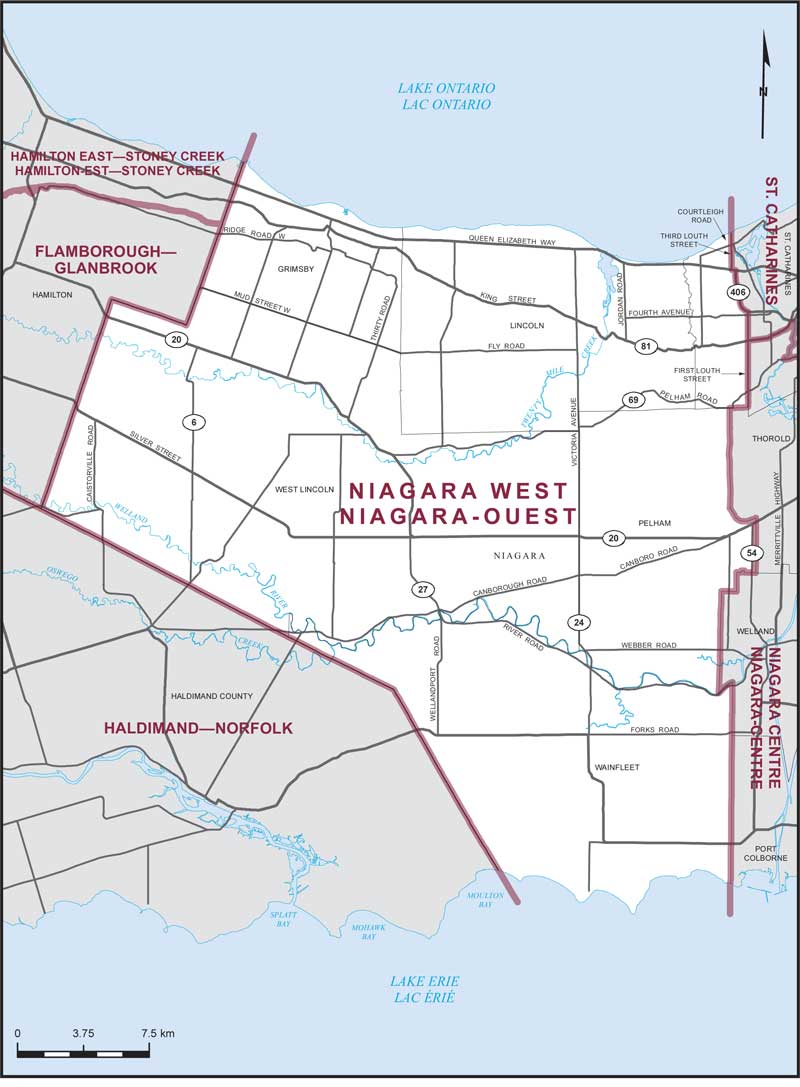
Niagara WestProvince/Territory:
Ontario-
Population:
96,946 -
Area:
988 km² -
Population density:
98.00/km² -
Population change:
+6.7% -
Average age:
44 -
Average income:
$59,250 -
Voter turnout:
72%
Language spoken most often at home:
-
English:
91,800 -
French:
275 -
Indigenous language:
0 -
Most popular other language:
-
Spanish:
450
-
-
All others:
2,510
-
-
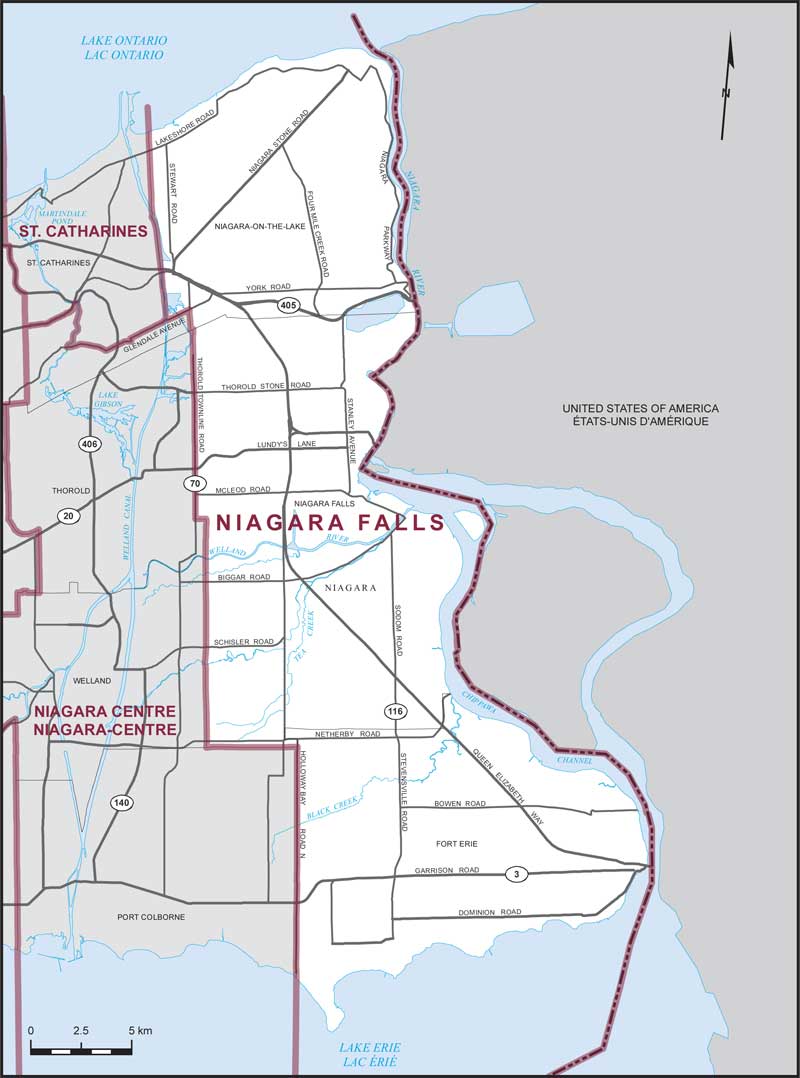
Electoral District:
Niagara FallsProvince/Territory:
Ontario-
Population:
146,404 -
Area:
508 km² -
Population density:
288.00/km² -
Population change:
+7.4% -
Average age:
46 -
Average income:
$47,720 -
Voter turnout:
62%
Language spoken most often at home:
-
English:
128,160 -
French:
575 -
Indigenous language:
0 -
Most popular other language:
-
Spanish:
1,210
-
-
All others:
11,180
-
-
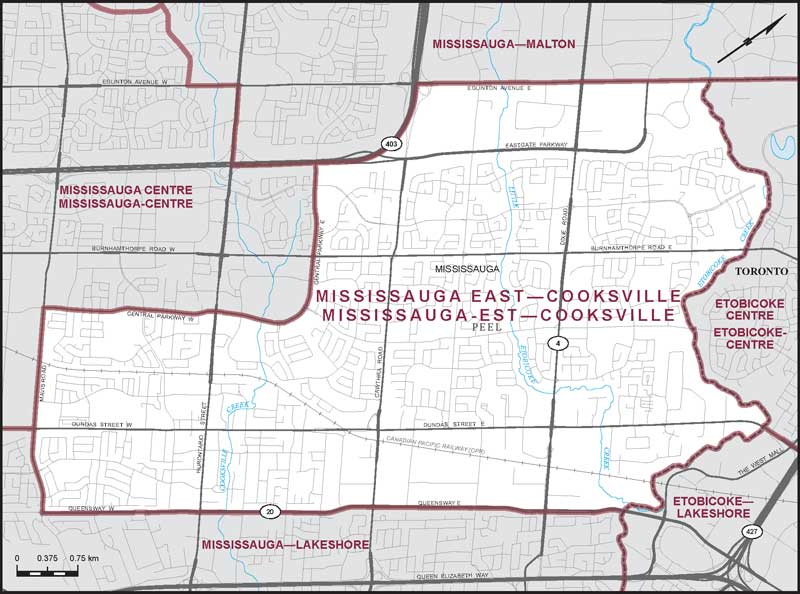
Electoral District:
Mississauga East—CooksvilleProvince/Territory:
Ontario-
Population:
116,346 -
Area:
32 km² -
Population density:
3,633.00/km² -
Population change:
-3.2% -
Average age:
43 -
Average income:
$47,360 -
Voter turnout:
55%
Language spoken most often at home:
-
English:
66,915 -
French:
415 -
Indigenous language:
0 -
Most popular other language:
-
Polish:
4,660
-
-
All others:
32,080
-
-
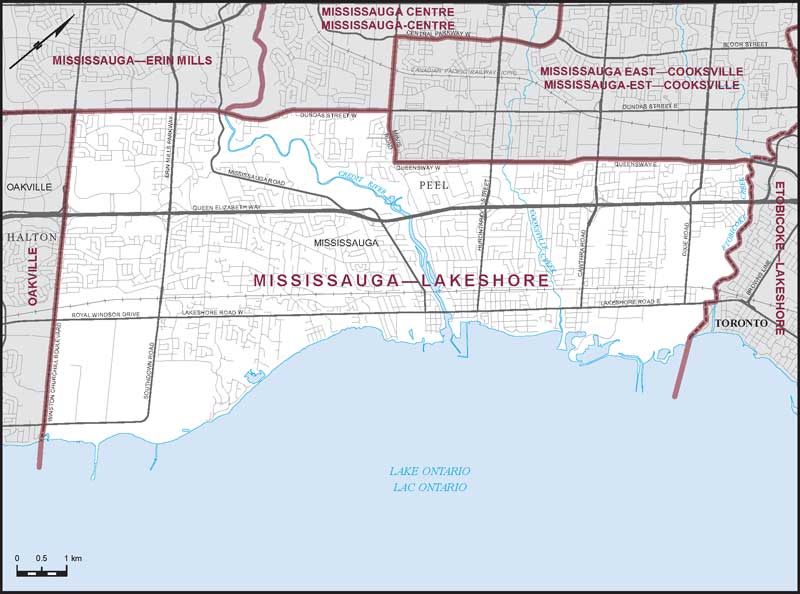
Electoral District:
Mississauga—LakeshoreProvince/Territory:
Ontario-
Population:
117,095 -
Area:
60 km² -
Population density:
1,948.00/km² -
Population change:
-0.3% -
Average age:
43 -
Average income:
$73,900 -
Voter turnout:
64%
Language spoken most often at home:
-
English:
90,130 -
French:
580 -
Indigenous language:
0 -
Most popular other language:
-
Polish:
2,410
-
-
All others:
16,730
-
-
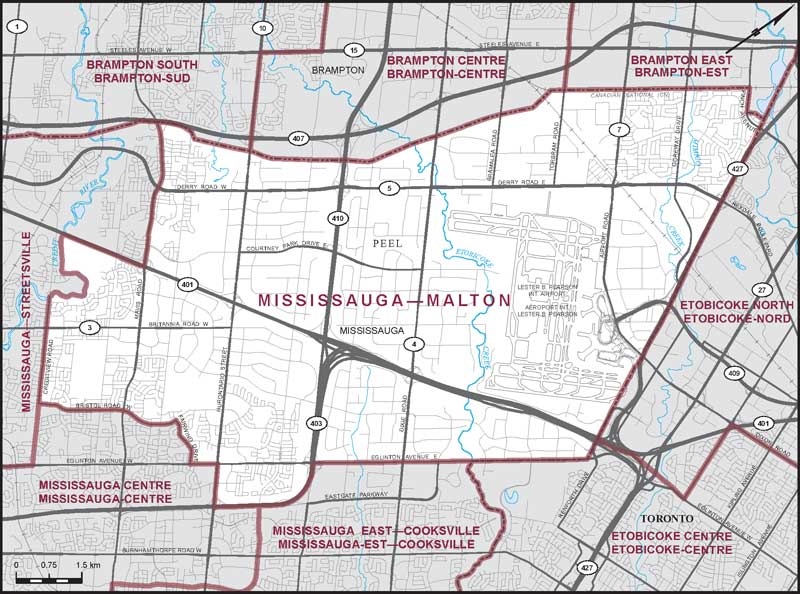
Electoral District:
Mississauga—MaltonProvince/Territory:
Ontario-
Population:
116,908 -
Area:
97 km² -
Population density:
1,204.00/km² -
Population change:
-1.1% -
Average age:
39 -
Average income:
$44,920 -
Voter turnout:
54%
Language spoken most often at home:
-
English:
63,225 -
French:
355 -
Indigenous language:
0 -
Most popular other language:
-
Punjabi (Panjabi):
9,485
-
-
All others:
29,635
-
-
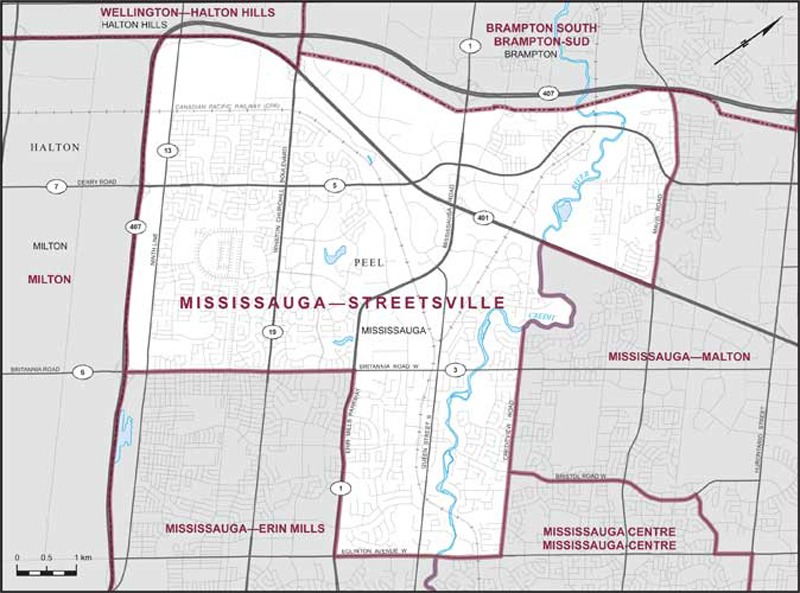
Electoral District:
Mississauga—StreetsvilleProvince/Territory:
Ontario-
Population:
116,864 -
Area:
47 km² -
Population density:
2,512.00/km² -
Population change:
-1.2% -
Average age:
40 -
Average income:
$57,000 -
Voter turnout:
59%
Language spoken most often at home:
-
English:
79,530 -
French:
665 -
Indigenous language:
0 -
Most popular other language:
-
Urdu:
4,060
-
-
All others:
21,275
-
-
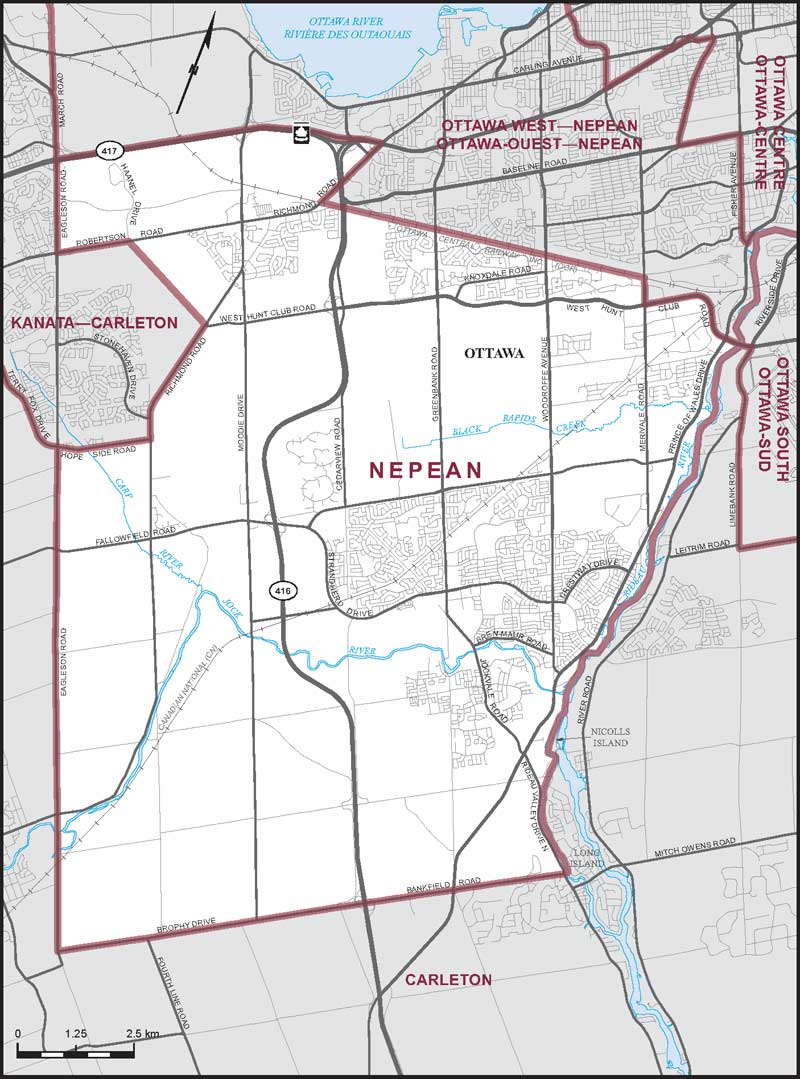
Electoral District:
NepeanProvince/Territory:
Ontario-
Population:
132,769 -
Area:
172 km² -
Population density:
774.00/km² -
Population change:
+11.5% -
Average age:
39 -
Average income:
$62,200 -
Voter turnout:
71%
Language spoken most often at home:
-
English:
96,930 -
French:
3,665 -
Indigenous language:
15 -
Most popular other language:
-
Arabic:
4,055
-
-
All others:
17,675
-
-
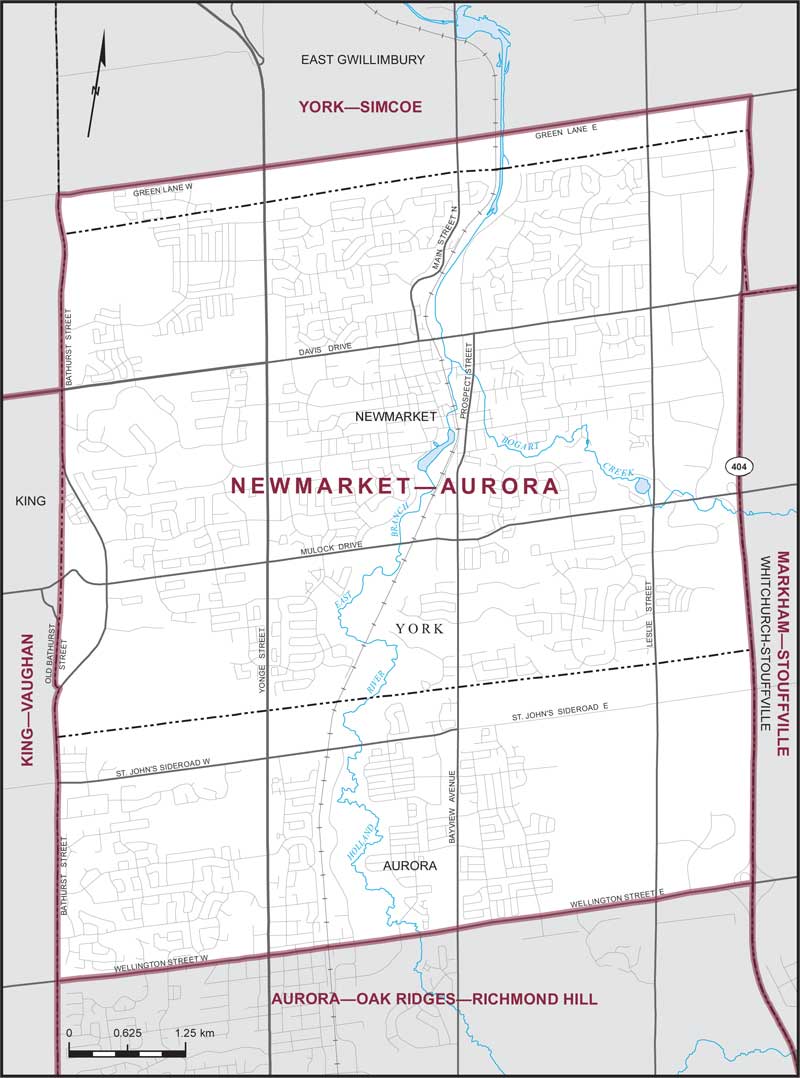
Electoral District:
Newmarket—AuroraProvince/Territory:
Ontario-
Population:
127,134 -
Area:
59 km² -
Population density:
2,138.00/km² -
Population change:
+8.3% -
Average age:
40 -
Average income:
$59,350 -
Voter turnout:
61%
Language spoken most often at home:
-
English:
93,680 -
French:
425 -
Indigenous language:
0 -
Most popular other language:
-
Mandarin & Yue (Cantonese):
9,725
-
-
All others:
16,110
-
-
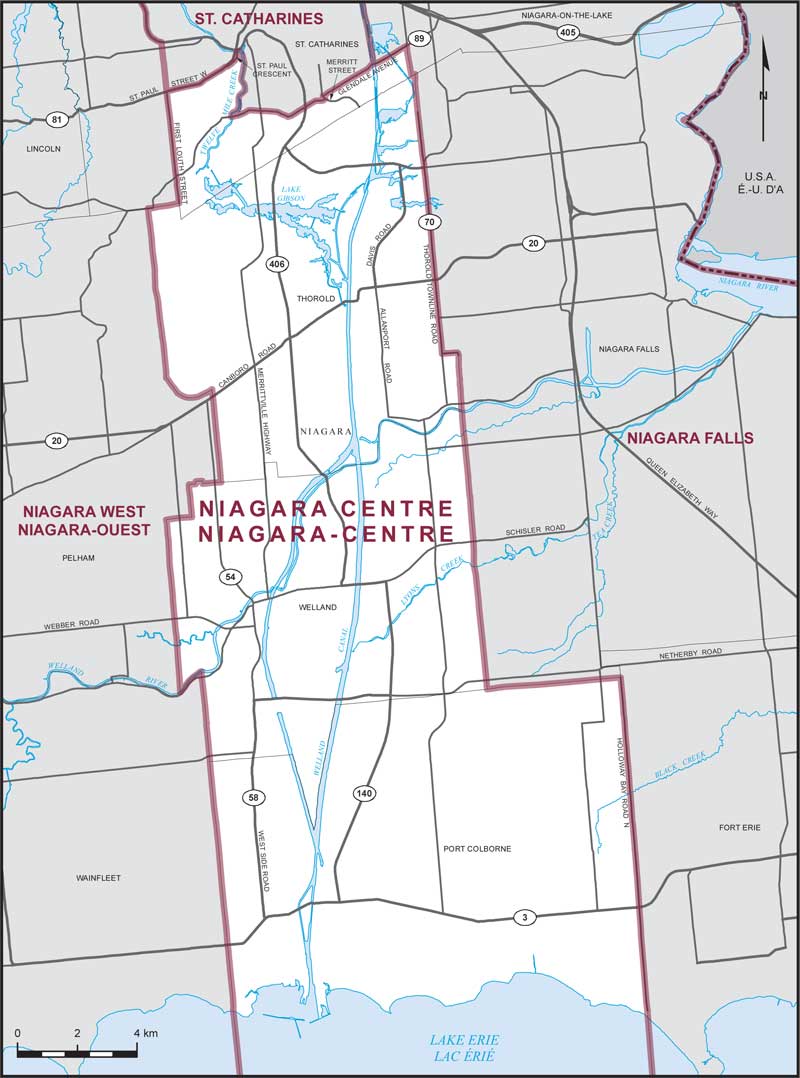
Electoral District:
Niagara CentreProvince/Territory:
Ontario-
Population:
119,809 -
Area:
302 km² -
Population density:
397.00/km² -
Population change:
+9.8% -
Average age:
43 -
Average income:
$46,040 -
Voter turnout:
63%
Language spoken most often at home:
-
English:
108,905 -
French:
1,415 -
Indigenous language:
0 -
Most popular other language:
-
Mandarin:
780
-
-
All others:
5,160
-
-
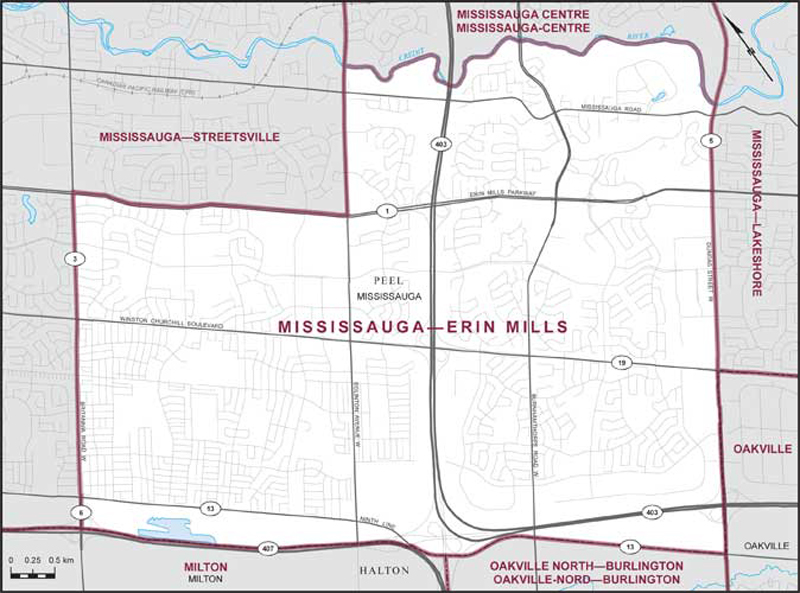
Electoral District:
Mississauga—Erin MillsProvince/Territory:
Ontario-
Population:
123,371 -
Area:
34 km² -
Population density:
3,644.00/km² -
Population change:
+0.7% -
Average age:
40 -
Average income:
$54,550 -
Voter turnout:
58%
Language spoken most often at home:
-
English:
74,145 -
French:
410 -
Indigenous language:
0 -
Most popular other language:
-
Urdu:
6,190
-
-
All others:
27,735
-
-
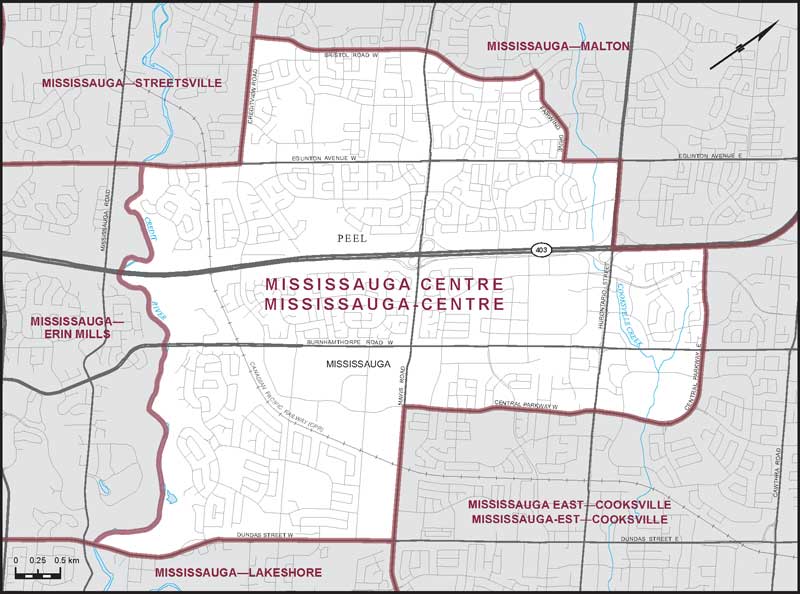
Electoral District:
Mississauga CentreProvince/Territory:
Ontario-
Population:
127,377 -
Area:
23 km² -
Population density:
5,513.00/km² -
Population change:
+2% -
Average age:
41 -
Average income:
$47,680 -
Voter turnout:
56%
Language spoken most often at home:
-
English:
68,315 -
French:
410 -
Indigenous language:
0 -
Most popular other language:
-
Mandarin & Yue (Cantonese):
8,650
-
-
All others:
34,380
-
-
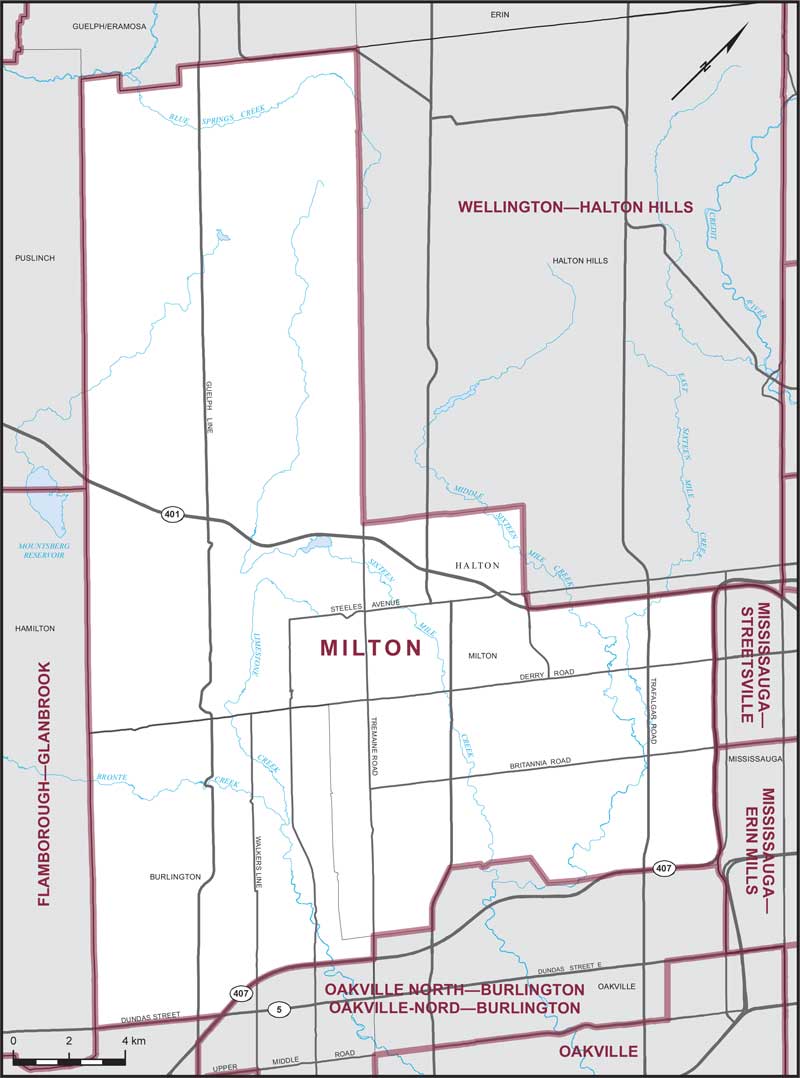
Electoral District:
MiltonProvince/Territory:
Ontario-
Population:
136,993 -
Area:
447 km² -
Population density:
306.00/km² -
Population change:
+20.1% -
Average age:
36 -
Average income:
$62,450 -
Voter turnout:
63%
Language spoken most often at home:
-
English:
95,995 -
French:
685 -
Indigenous language:
0 -
Most popular other language:
-
Urdu:
8,365
-
-
All others:
17,705
-
-
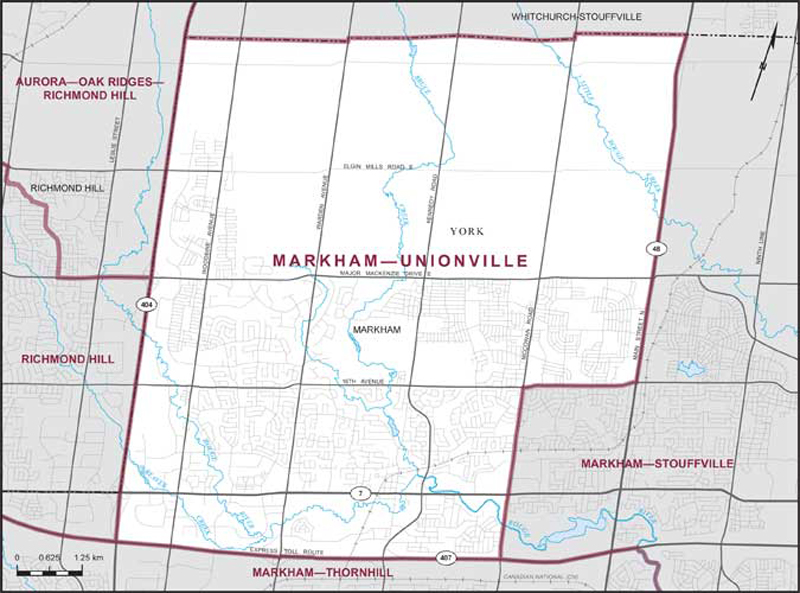
Electoral District:
Markham—UnionvilleProvince/Territory:
Ontario-
Population:
128,308 -
Area:
84 km² -
Population density:
1,532.00/km² -
Population change:
+4% -
Average age:
41 -
Average income:
$55,900 -
Voter turnout:
52%
Language spoken most often at home:
-
English:
56,215 -
French:
240 -
Indigenous language:
0 -
Most popular other language:
-
Yue (Cantonese) & Mandarin:
51,290
-
-
All others:
9,050
-
-
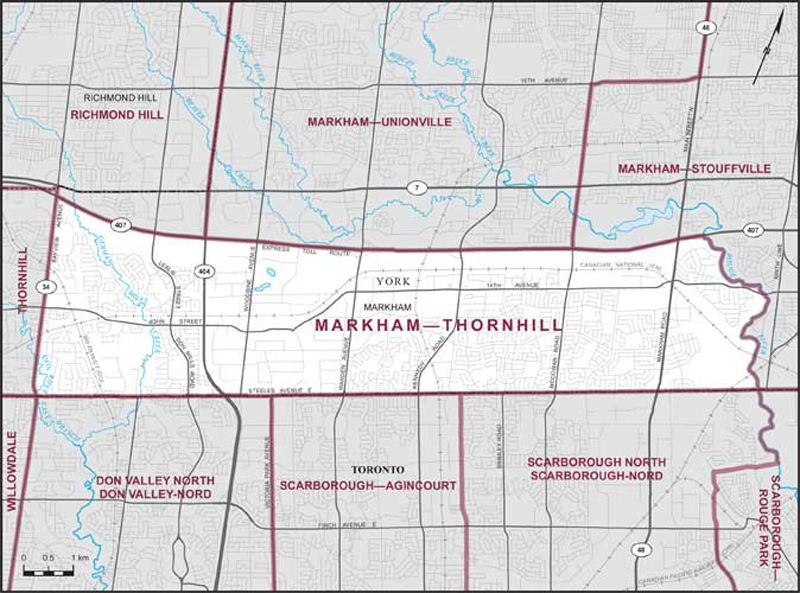
Electoral District:
Markham—ThornhillProvince/Territory:
Ontario-
Population:
97,510 -
Area:
42 km² -
Population density:
2,336.00/km² -
Population change:
-1.6% -
Average age:
43 -
Average income:
$47,640 -
Voter turnout:
56%
Language spoken most often at home:
-
English:
41,560 -
French:
110 -
Indigenous language:
0 -
Most popular other language:
-
Yue (Cantonese) & Mandarin:
27,025
-
-
All others:
18,845
-
-
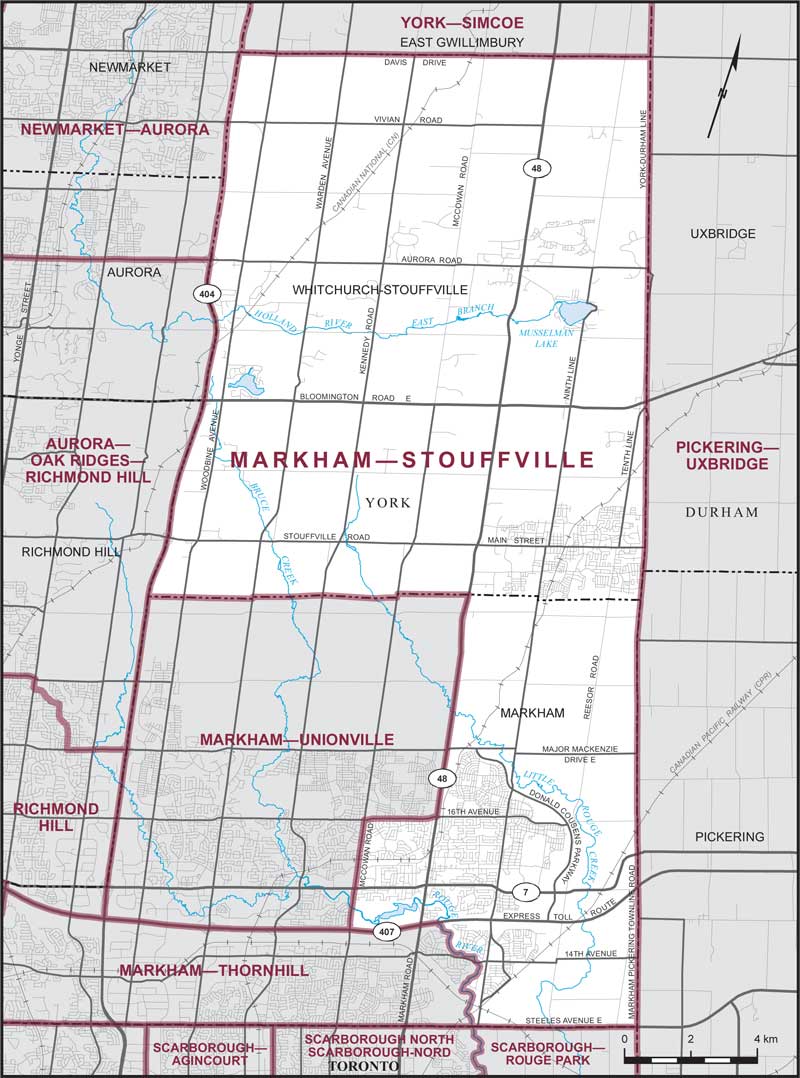
Electoral District:
Markham—StouffvilleProvince/Territory:
Ontario-
Population:
135,944 -
Area:
282 km² -
Population density:
482.00/km² -
Population change:
+7.8% -
Average age:
41 -
Average income:
$59,800 -
Voter turnout:
61%
Language spoken most often at home:
-
English:
89,315 -
French:
330 -
Indigenous language:
0 -
Most popular other language:
-
Yue (Cantonese) & Mandarin:
20,615
-
-
All others:
14,895
-
-
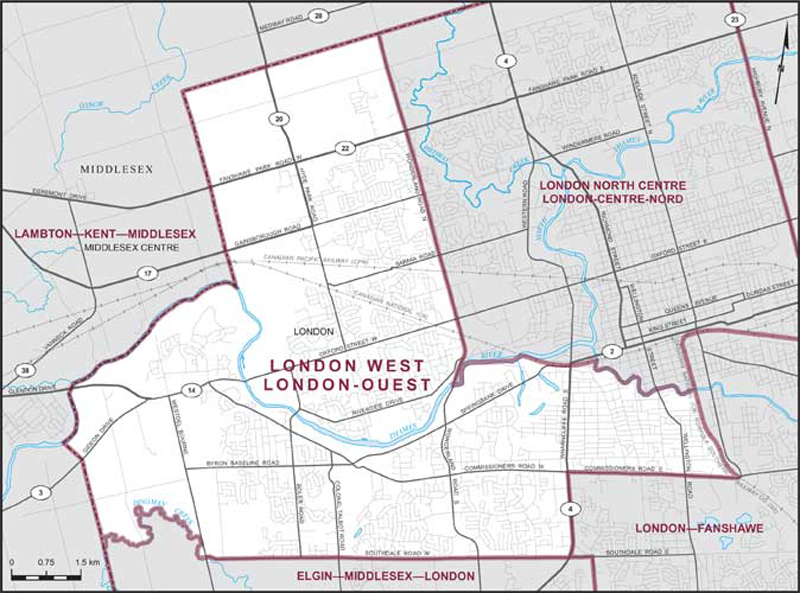
Electoral District:
London WestProvince/Territory:
Ontario-
Population:
139,305 -
Area:
77 km² -
Population density:
1,802.00/km² -
Population change:
+10.5% -
Average age:
41 -
Average income:
$55,300 -
Voter turnout:
68%
Language spoken most often at home:
-
English:
114,540 -
French:
575 -
Indigenous language:
0 -
Most popular other language:
-
Arabic:
3,570
-
-
All others:
13,970
-