Federal Electoral District Fact Sheets
-
Electoral District:
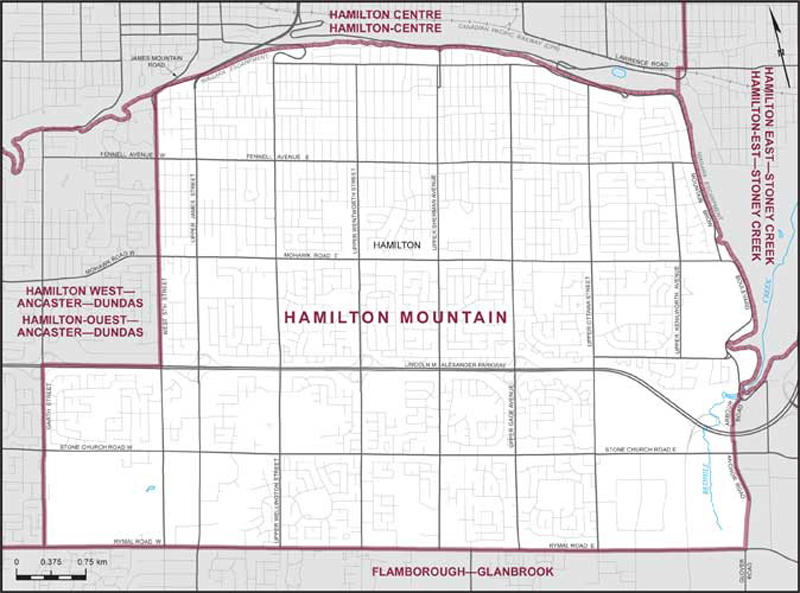
Hamilton MountainProvince/Territory:
Ontario-
Population:
107,629 -
Area:
33 km² -
Population density:
3,248.00/km² -
Population change:
+2.6% -
Average age:
42 -
Average income:
$46,360 -
Voter turnout:
60%
Language spoken most often at home:
-
English:
86,405 -
French:
375 -
Indigenous language:
0 -
Most popular other language:
-
Arabic:
2,110
-
-
All others:
12,805
-
-
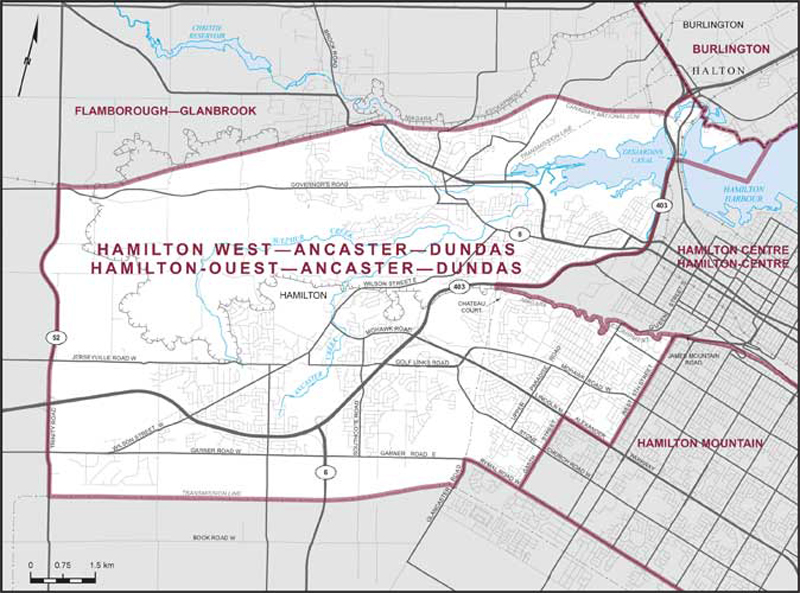
Electoral District:
Hamilton West—Ancaster—DundasProvince/Territory:
Ontario-
Population:
117,565 -
Area:
101 km² -
Population density:
1,164.00/km² -
Population change:
+4% -
Average age:
43 -
Average income:
$69,000 -
Voter turnout:
69%
Language spoken most often at home:
-
English:
97,395 -
French:
365 -
Indigenous language:
0 -
Most popular other language:
-
Mandarin:
2,130
-
-
All others:
11,815
-
-
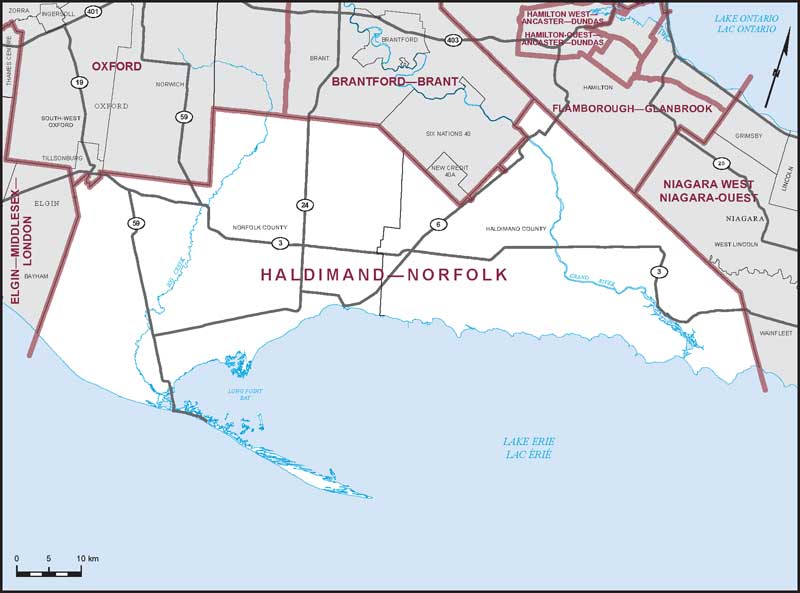
Electoral District:
Haldimand—NorfolkProvince/Territory:
Ontario-
Population:
116,706 -
Area:
2,848 km² -
Population density:
41.00/km² -
Population change:
+6.4% -
Average age:
44 -
Average income:
$49,480 -
Voter turnout:
67%
Language spoken most often at home:
-
English:
111,075 -
French:
180 -
Indigenous language:
0 -
Most popular other language:
-
German:
915
-
-
All others:
2,650
-
-
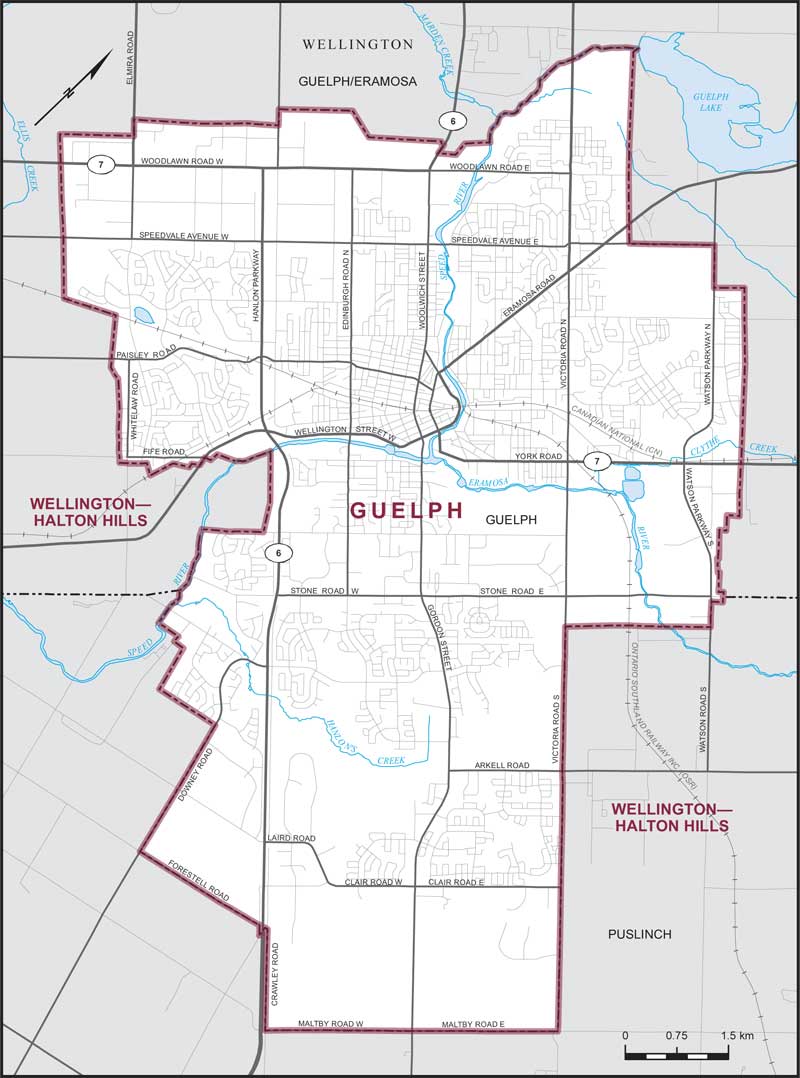
Electoral District:
GuelphProvince/Territory:
Ontario-
Population:
143,740 -
Area:
87 km² -
Population density:
1,644.00/km² -
Population change:
+9.1% -
Average age:
40 -
Average income:
$55,200 -
Voter turnout:
65%
Language spoken most often at home:
-
English:
120,600 -
French:
475 -
Indigenous language:
5 -
Most popular other language:
-
Punjabi (Panjabi):
1,595
-
-
All others:
14,950
-
-
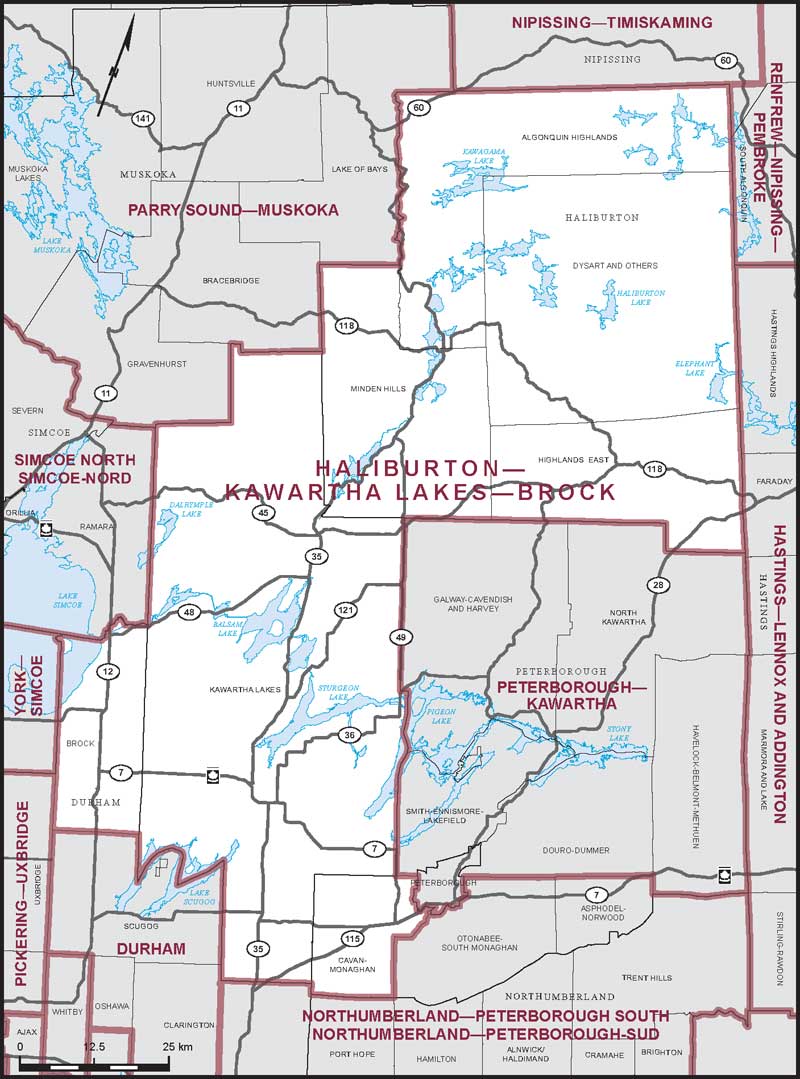
Electoral District:
Haliburton—Kawartha Lakes—BrockProvince/Territory:
Ontario-
Population:
122,401 -
Area:
7,772 km² -
Population density:
16.00/km² -
Population change:
+7.4% -
Average age:
48 -
Average income:
$51,300 -
Voter turnout:
66%
Language spoken most often at home:
-
English:
117,890 -
French:
235 -
Indigenous language:
0 -
Most popular other language:
-
German & Pennsylvania German:
245
-
-
All others:
1,450
-
-
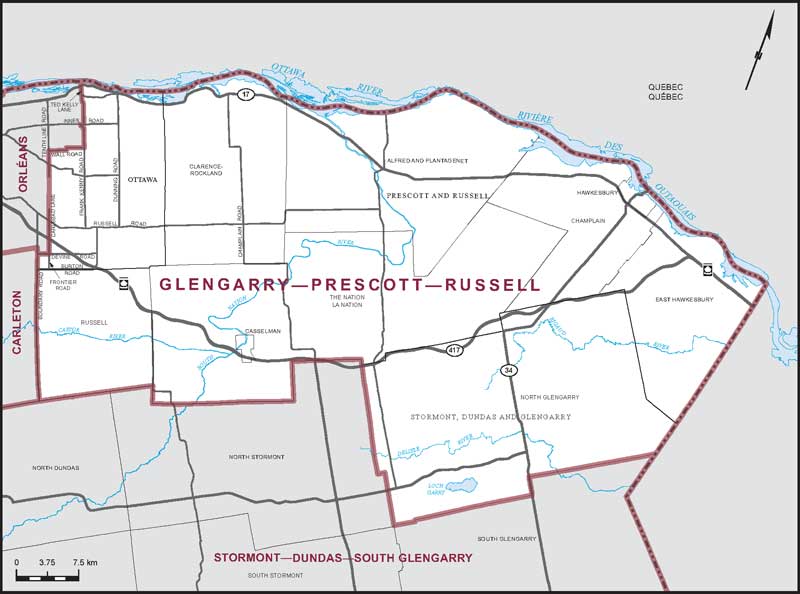
Electoral District:
Glengarry—Prescott—RussellProvince/Territory:
Ontario-
Population:
116,463 -
Area:
2,909 km² -
Population density:
40.00/km² -
Population change:
+5.9% -
Average age:
43 -
Average income:
$54,850 -
Voter turnout:
70%
Language spoken most often at home:
-
English:
53,590 -
French:
54,805 -
Indigenous language:
0 -
Most popular other language:
-
German & Swiss German:
215
-
-
All others:
1,370
-
-
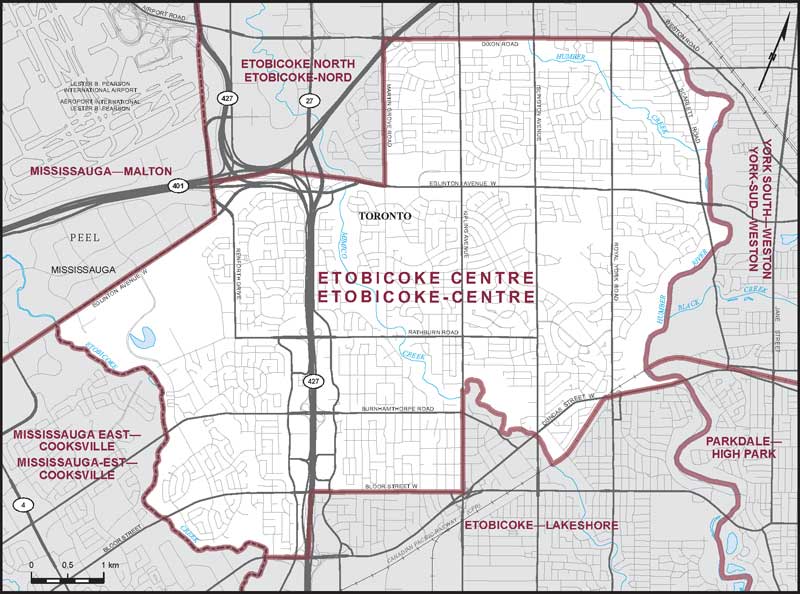
Electoral District:
Etobicoke CentreProvince/Territory:
Ontario-
Population:
118,483 -
Area:
37 km² -
Population density:
3,198.00/km² -
Population change:
+0.4% -
Average age:
45 -
Average income:
$69,200 -
Voter turnout:
64%
Language spoken most often at home:
-
English:
85,050 -
French:
445 -
Indigenous language:
0 -
Most popular other language:
-
Ukrainian:
2,405
-
-
All others:
22,175
-
-
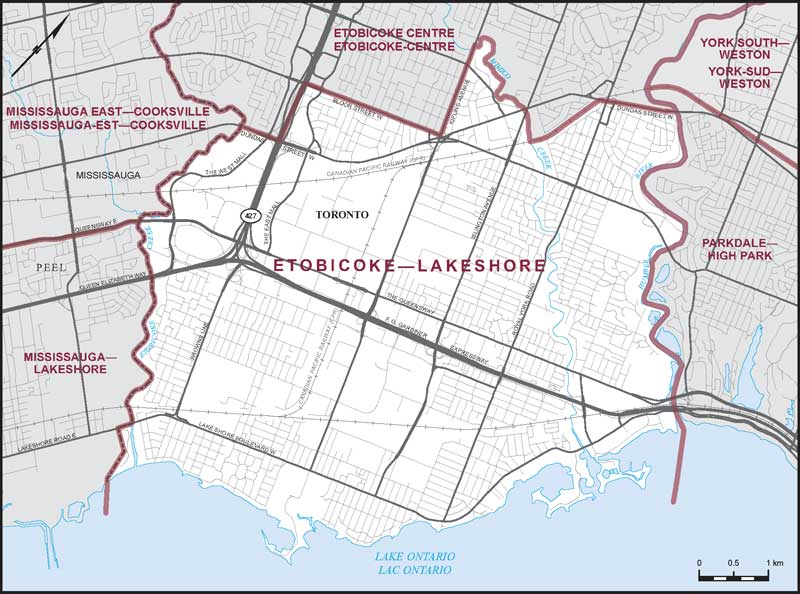
Electoral District:
Etobicoke—LakeshoreProvince/Territory:
Ontario-
Population:
141,751 -
Area:
40 km² -
Population density:
3,575.00/km² -
Population change:
+9.8% -
Average age:
42 -
Average income:
$71,100 -
Voter turnout:
63%
Language spoken most often at home:
-
English:
105,980 -
French:
820 -
Indigenous language:
0 -
Most popular other language:
-
Polish:
2,535
-
-
All others:
23,500
-
-
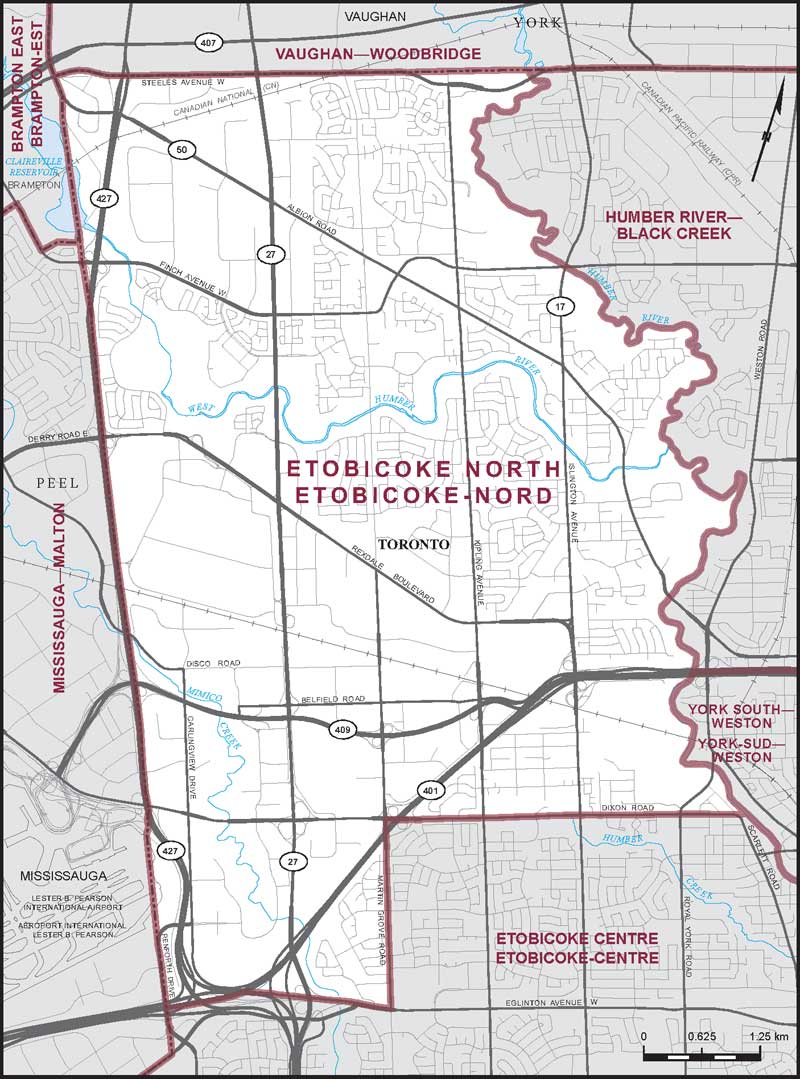
Electoral District:
Etobicoke NorthProvince/Territory:
Ontario-
Population:
116,003 -
Area:
48 km² -
Population density:
2,428.00/km² -
Population change:
-1.7% -
Average age:
40 -
Average income:
$39,760 -
Voter turnout:
50%
Language spoken most often at home:
-
English:
67,035 -
French:
510 -
Indigenous language:
0 -
Most popular other language:
-
Punjabi (Panjabi):
6,570
-
-
All others:
29,955
-
-
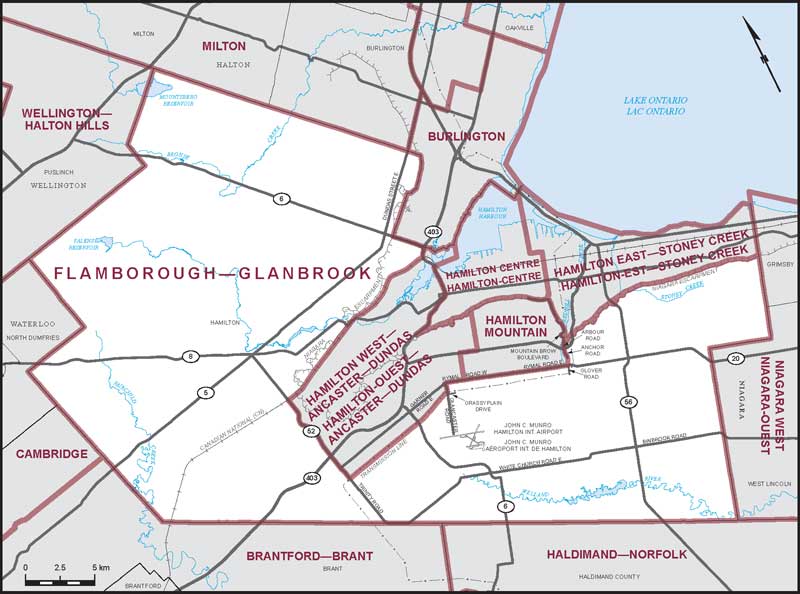
Electoral District:
Flamborough—GlanbrookProvince/Territory:
Ontario-
Population:
125,692 -
Area:
887 km² -
Population density:
142.00/km² -
Population change:
+13.2% -
Average age:
40 -
Average income:
$59,750 -
Voter turnout:
66%
Language spoken most often at home:
-
English:
108,060 -
French:
475 -
Indigenous language:
0 -
Most popular other language:
-
Arabic:
1,545
-
-
All others:
10,770
-
-
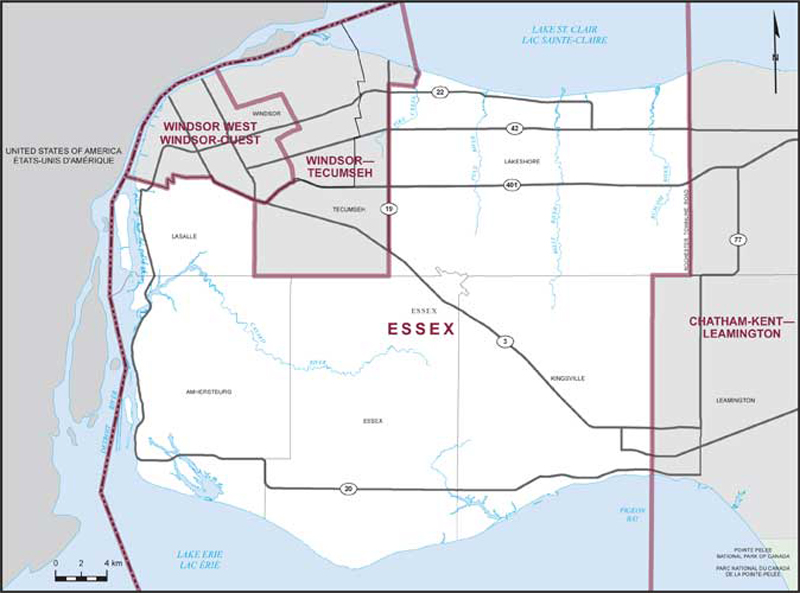
Electoral District:
EssexProvince/Territory:
Ontario-
Population:
134,656 -
Area:
1,097 km² -
Population density:
123.00/km² -
Population change:
+7.3% -
Average age:
42 -
Average income:
$59,700 -
Voter turnout:
67%
Language spoken most often at home:
-
English:
123,760 -
French:
665 -
Indigenous language:
0 -
Most popular other language:
-
Punjabi (Panjabi):
1,005
-
-
All others:
6,020
-
-
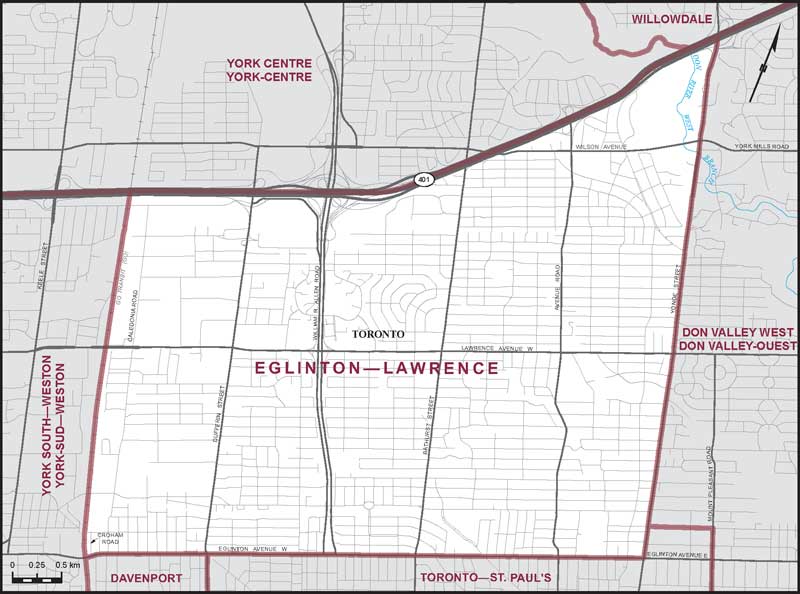
Electoral District:
Eglinton—LawrenceProvince/Territory:
Ontario-
Population:
115,832 -
Area:
23 km² -
Population density:
5,114.00/km² -
Population change:
+1.3% -
Average age:
41 -
Average income:
$88,500 -
Voter turnout:
62%
Language spoken most often at home:
-
English:
86,745 -
French:
470 -
Indigenous language:
0 -
Most popular other language:
-
Tagalog (Pilipino, Filipino):
3,965
-
-
All others:
17,145
-
-
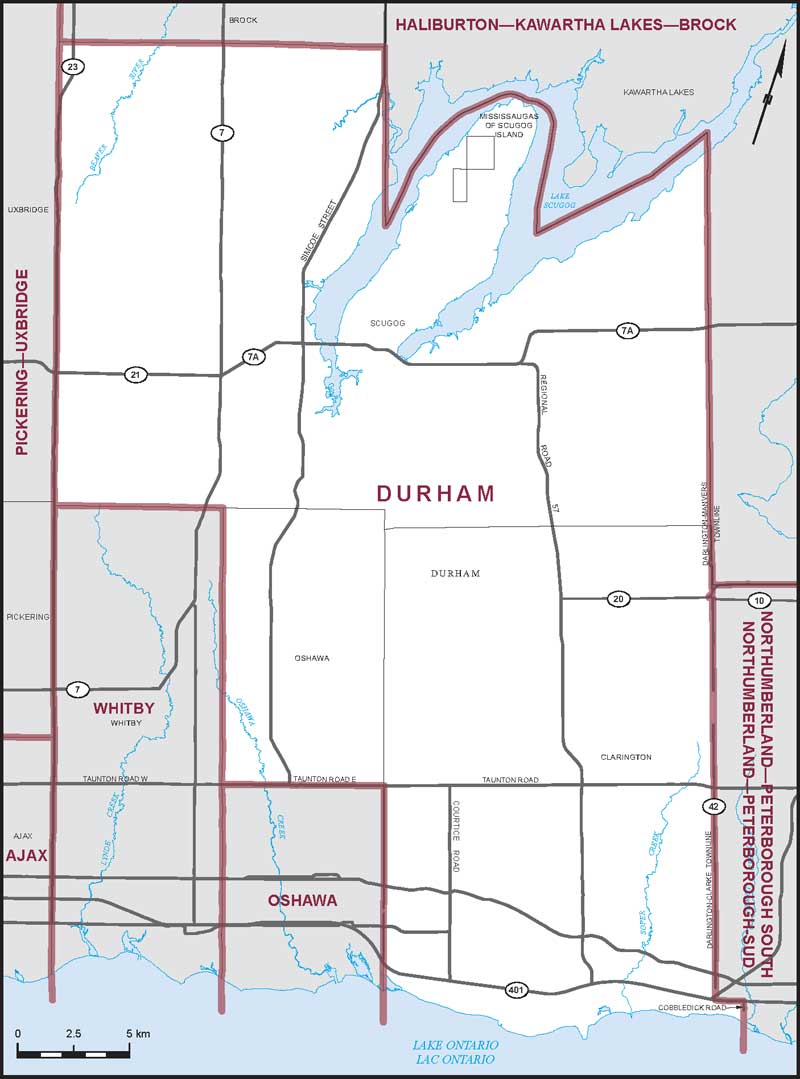
Electoral District:
DurhamProvince/Territory:
Ontario-
Population:
150,235 -
Area:
869 km² -
Population density:
173.00/km² -
Population change:
+14.8% -
Average age:
39 -
Average income:
$57,600 -
Voter turnout:
61%
Language spoken most often at home:
-
English:
133,790 -
French:
820 -
Indigenous language:
0 -
Most popular other language:
-
Tamil:
1,750
-
-
All others:
8,715
-
-
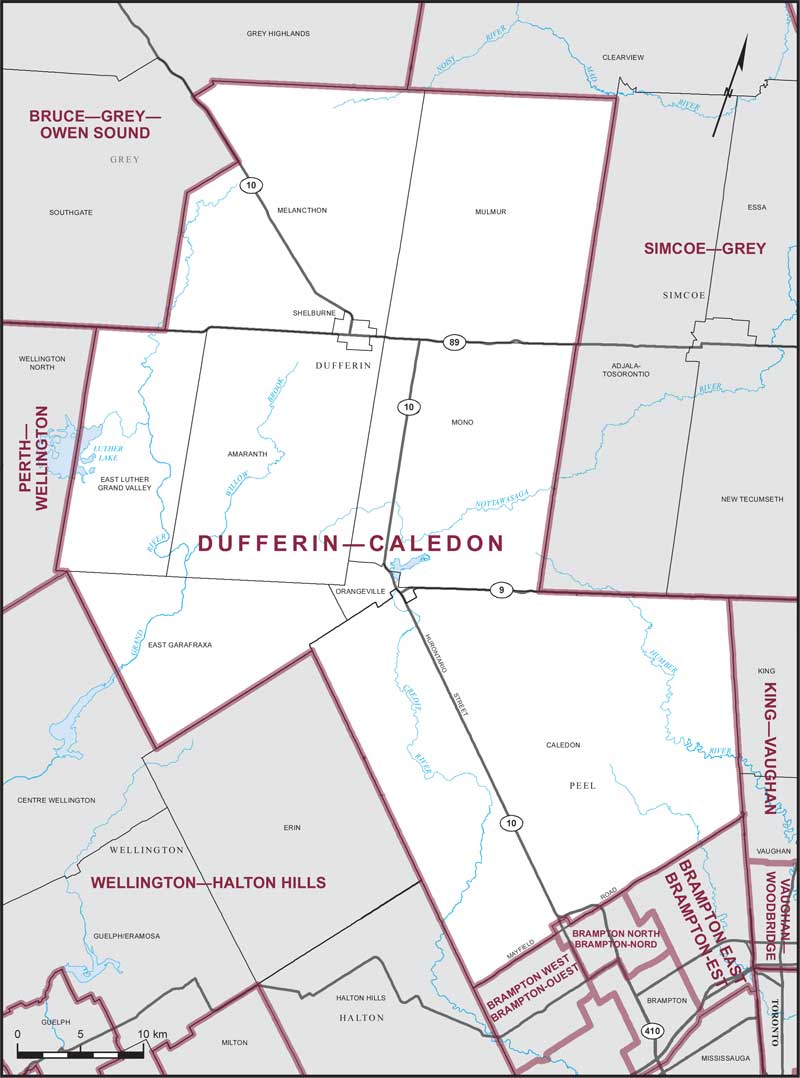
Electoral District:
Dufferin—CaledonProvince/Territory:
Ontario-
Population:
142,838 -
Area:
2,176 km² -
Population density:
66.00/km² -
Population change:
+11.4% -
Average age:
40 -
Average income:
$59,650 -
Voter turnout:
61%
Language spoken most often at home:
-
English:
122,195 -
French:
330 -
Indigenous language:
0 -
Most popular other language:
-
Punjabi (Panjabi):
7,140
-
-
All others:
7,300
-
-
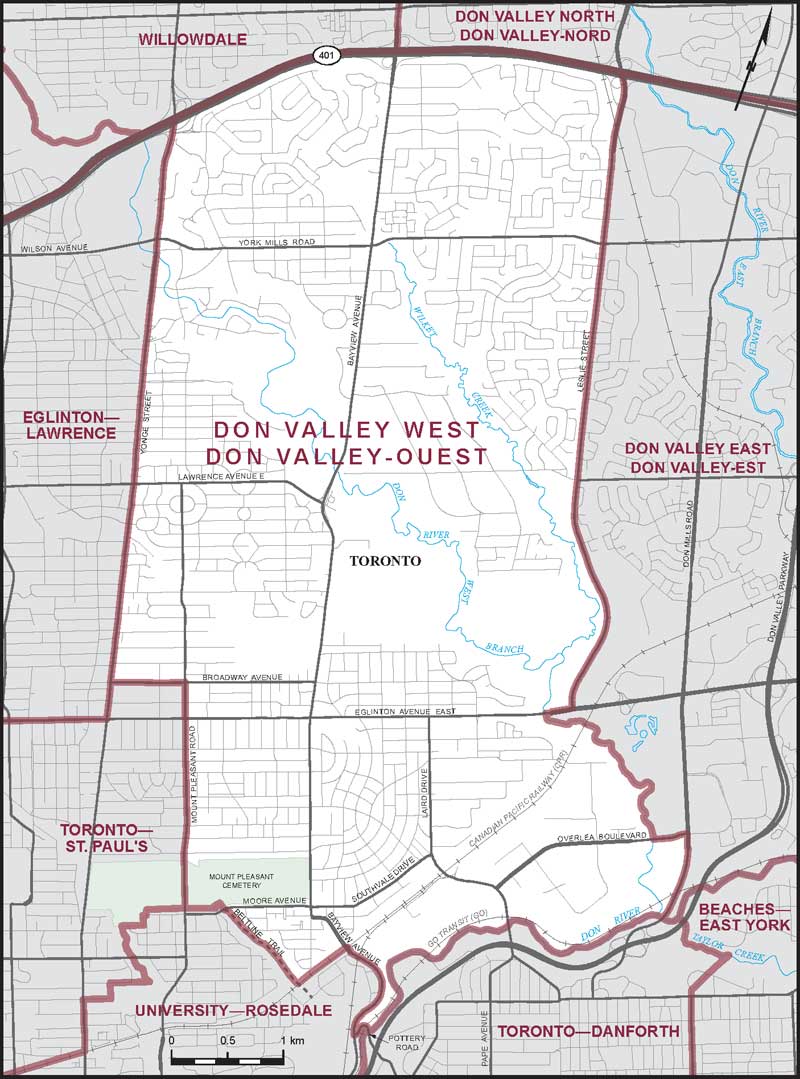
Electoral District:
Don Valley WestProvince/Territory:
Ontario-
Population:
101,959 -
Area:
30 km² -
Population density:
3,386.00/km² -
Population change:
-0.5% -
Average age:
41 -
Average income:
$113,600 -
Voter turnout:
66%
Language spoken most often at home:
-
English:
70,920 -
French:
610 -
Indigenous language:
0 -
Most popular other language:
-
Mandarin:
3,465
-
-
All others:
18,900
-
-
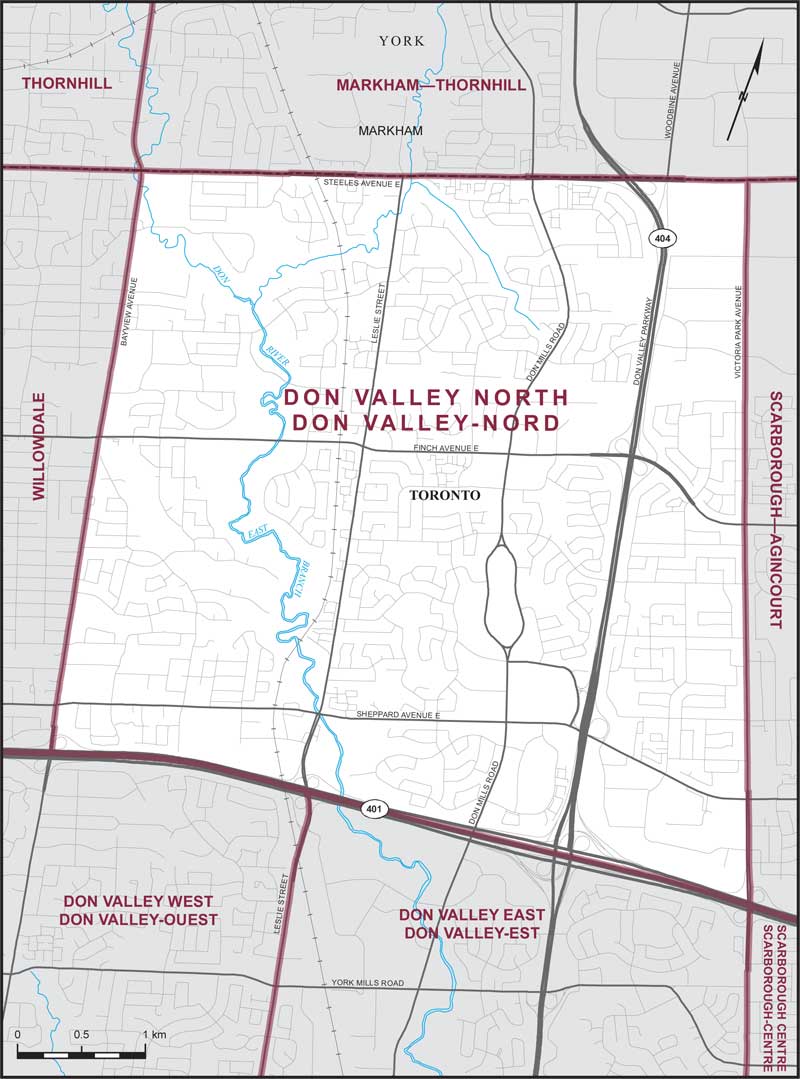
Electoral District:
Don Valley NorthProvince/Territory:
Ontario-
Population:
113,663 -
Area:
24 km² -
Population density:
4,670.00/km² -
Population change:
+3.3% -
Average age:
43 -
Average income:
$50,880 -
Voter turnout:
55%
Language spoken most often at home:
-
English:
55,135 -
French:
380 -
Indigenous language:
0 -
Most popular other language:
-
Mandarin & Yue (Cantonese):
19,990
-
-
All others:
26,345
-