Federal Electoral District Fact Sheets
-
Electoral District:
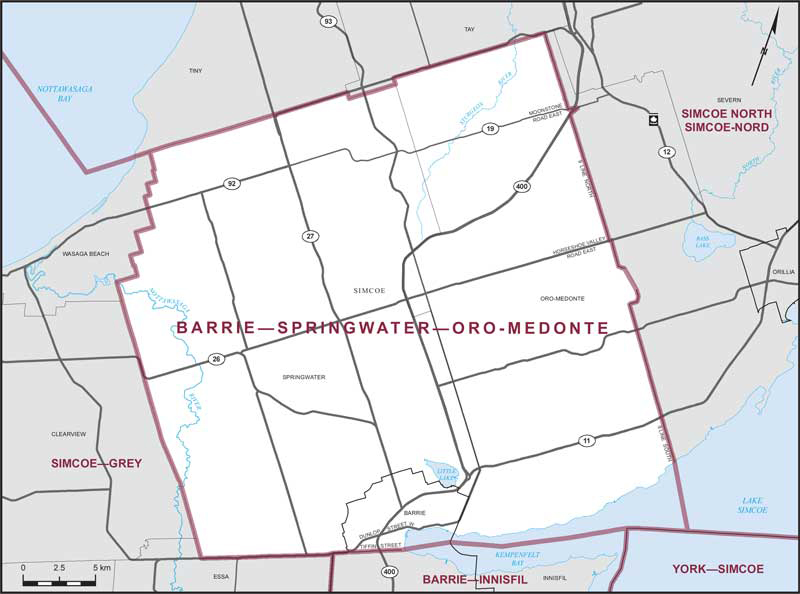
Barrie—Springwater—Oro-MedonteProvince/Territory:
Ontario-
Population:
106,871 -
Area:
964 km² -
Population density:
111.00/km² -
Population change:
+6% -
Average age:
42 -
Average income:
$54,950 -
Voter turnout:
64%
Language spoken most often at home:
-
English:
98,125 -
French:
525 -
Indigenous language:
5 -
Most popular other language:
-
Spanish:
565
-
-
All others:
4,560
-
-
Electoral District:
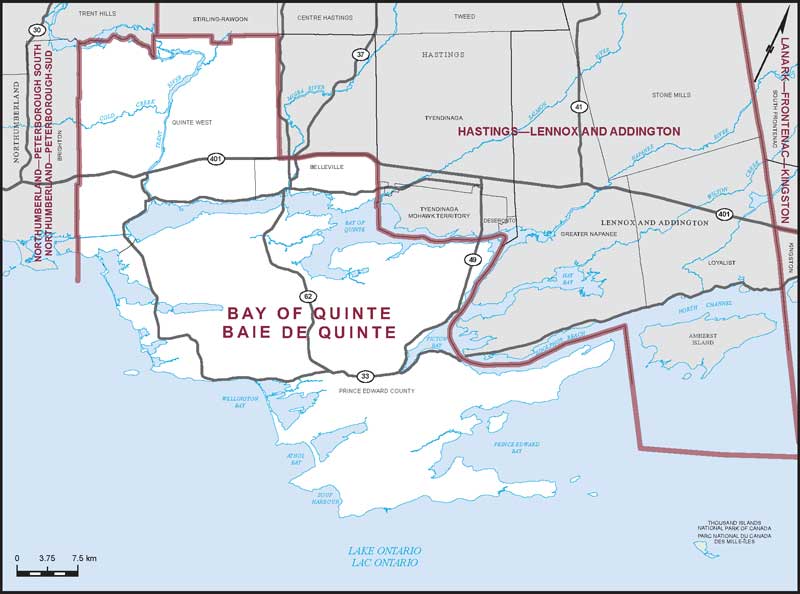
Bay of QuinteProvince/Territory:
Ontario-
Population:
116,016 -
Area:
1,625 km² -
Population density:
71.00/km² -
Population change:
+5.7% -
Average age:
46 -
Average income:
$49,160 -
Voter turnout:
65%
Language spoken most often at home:
-
English:
109,965 -
French:
1,205 -
Indigenous language:
0 -
Most popular other language:
-
Gujarati:
230
-
-
All others:
2,205
-
-
Electoral District:
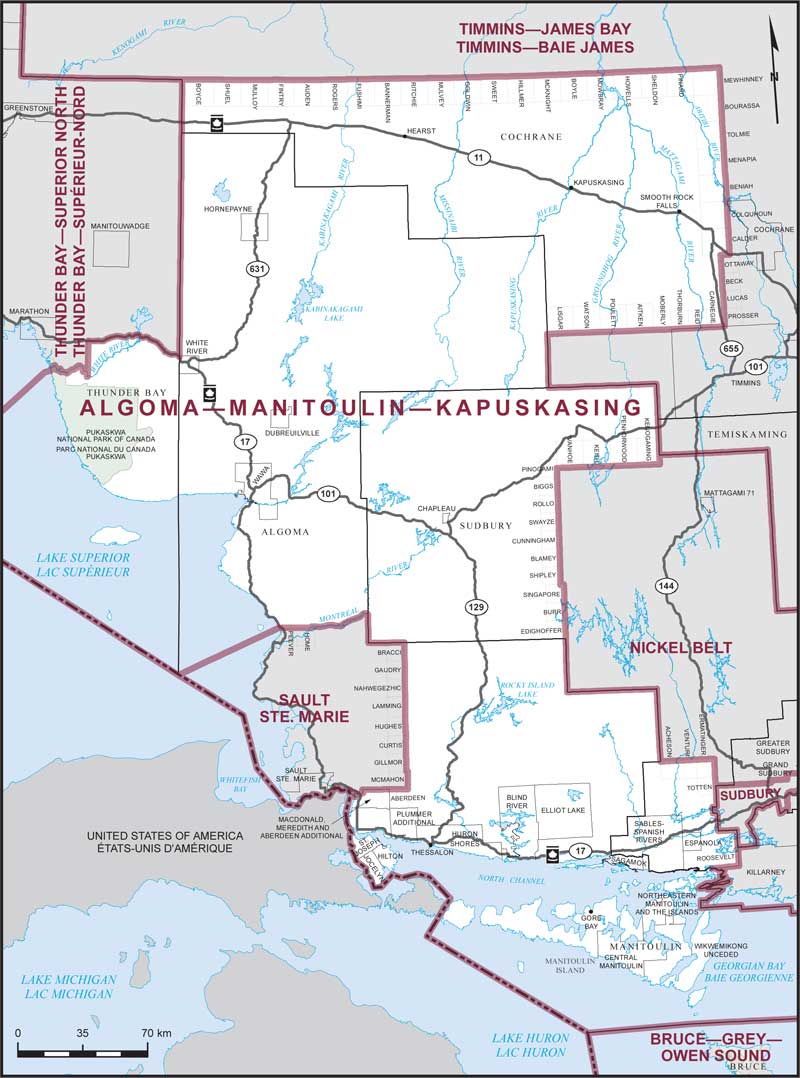
Algoma—Manitoulin—KapuskasingProvince/Territory:
Ontario-
Population:
80,310 -
Area:
92,667 km² -
Population density:
0.90/km² -
Population change:
+1% -
Average age:
47 -
Average income:
$46,520 -
Voter turnout:
60%
Language spoken most often at home:
-
English:
62,605 -
French:
14,100 -
Indigenous language:
585 -
Most popular other language:
-
German:
385
-
-
All others:
510
-
-
Electoral District:
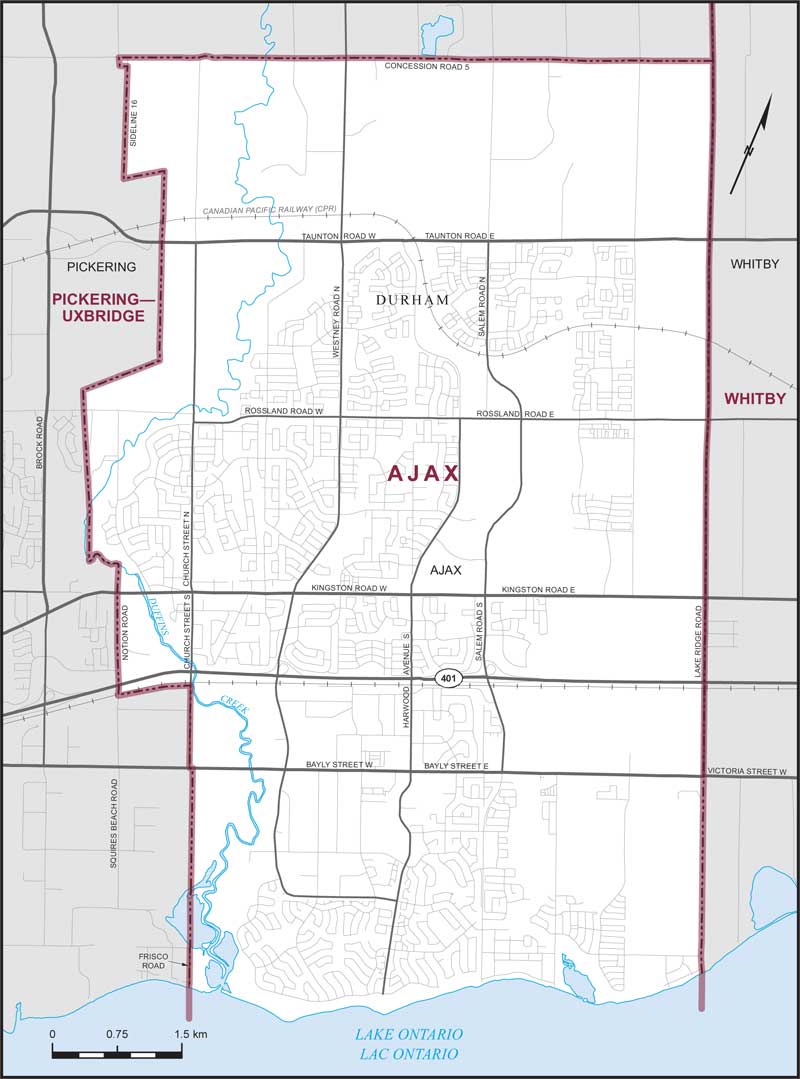
AjaxProvince/Territory:
Ontario-
Population:
126,666 -
Area:
67 km² -
Population density:
1,901.00/km² -
Population change:
+5.8% -
Average age:
39 -
Average income:
$54,300 -
Voter turnout:
54%
Language spoken most often at home:
-
English:
96,590 -
French:
720 -
Indigenous language:
0 -
Most popular other language:
-
Tamil:
4,635
-
-
All others:
15,635
-
-
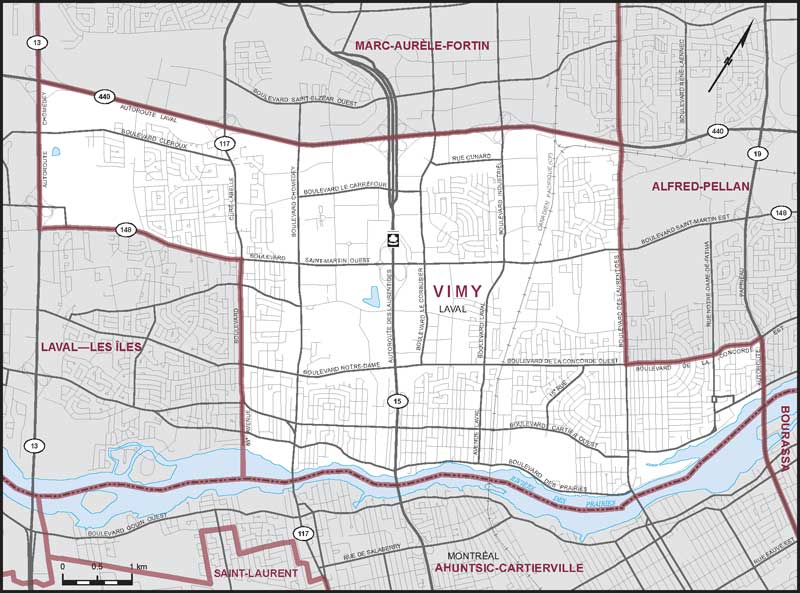
Electoral District:
VimyProvince/Territory:
Québec-
Population:
119,926 -
Area:
34 km² -
Population density:
3,519.00/km² -
Population change:
+7.2% -
Average age:
43 -
Average income:
$45,080 -
Voter turnout:
59%
Language spoken most often at home:
-
English:
13,180 -
French:
67,250 -
Indigenous language:
10 -
Most popular other language:
-
Arabic:
8,335
-
-
All others:
17,965
-
-
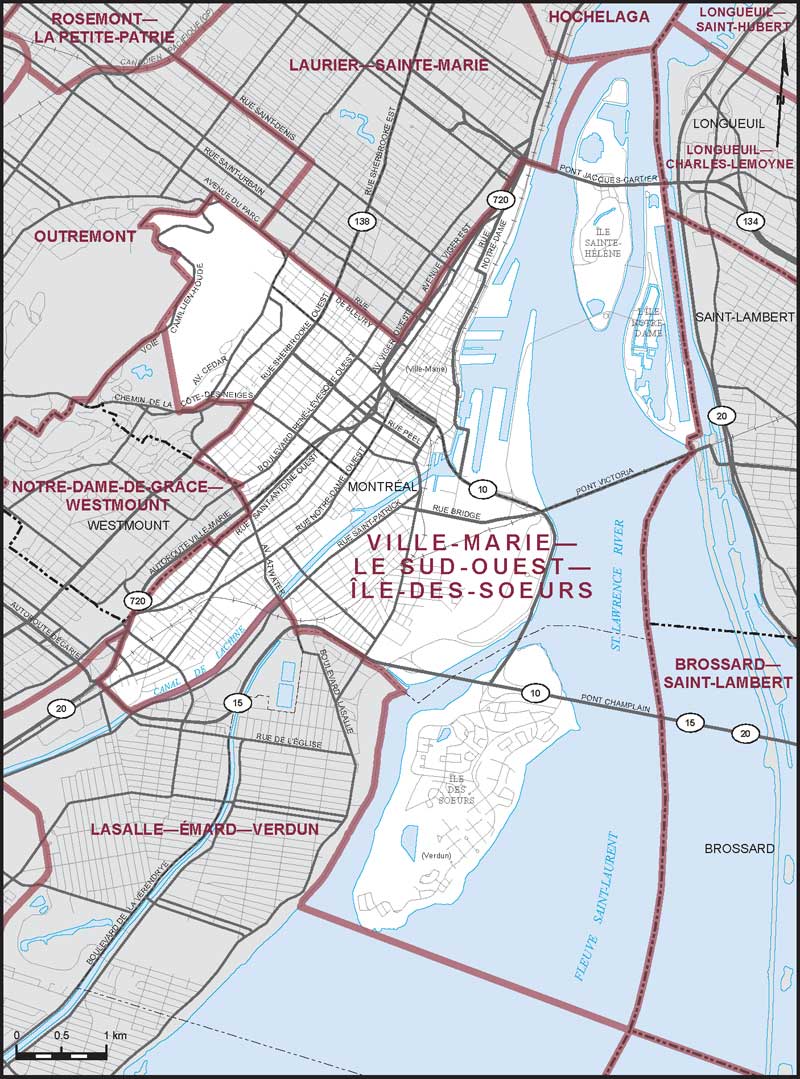
Electoral District:
Ville-Marie—Le Sud-Ouest—Île-des-SoeursProvince/Territory:
Québec-
Population:
134,555 -
Area:
22 km² -
Population density:
6,063.00/km² -
Population change:
+17.4% -
Average age:
39 -
Average income:
$65,900 -
Voter turnout:
56%
Language spoken most often at home:
-
English:
43,130 -
French:
52,070 -
Indigenous language:
5 -
Most popular other language:
-
Mandarin & Yue (Cantonese):
6,625
-
-
All others:
18,930
-
-
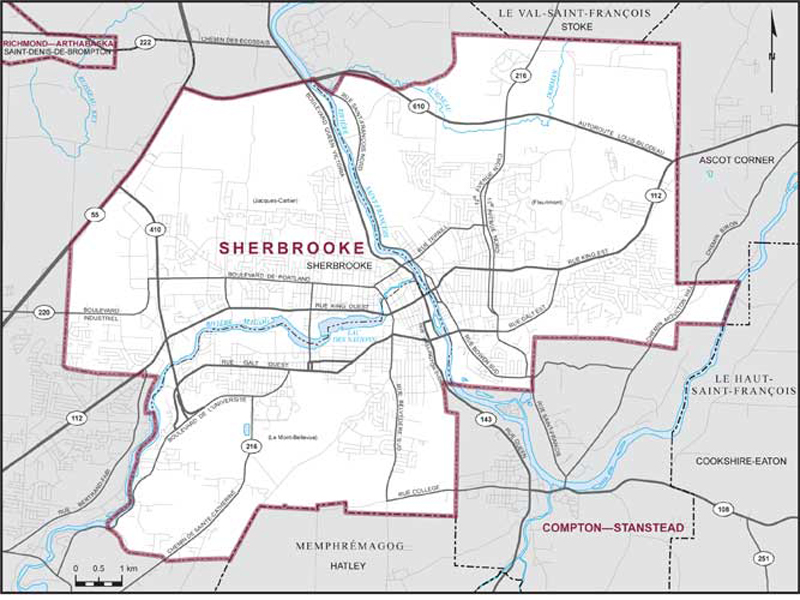
Electoral District:
SherbrookeProvince/Territory:
Québec-
Population:
119,038 -
Area:
99 km² -
Population density:
1,199.00/km² -
Population change:
+7.1% -
Average age:
43 -
Average income:
$44,360 -
Voter turnout:
65%
Language spoken most often at home:
-
English:
3,510 -
French:
103,330 -
Indigenous language:
5 -
Most popular other language:
-
Spanish:
1,855
-
-
All others:
4,640
-
-
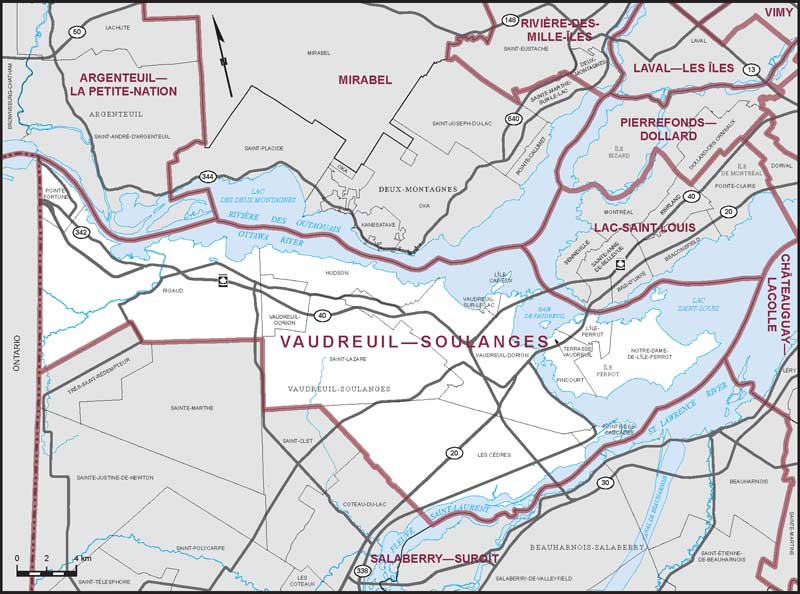
Electoral District:
Vaudreuil—SoulangesProvince/Territory:
Québec-
Population:
129,612 -
Area:
393 km² -
Population density:
330.00/km² -
Population change:
+8.7% -
Average age:
41 -
Average income:
$56,000 -
Voter turnout:
67%
Language spoken most often at home:
-
English:
45,335 -
French:
64,475 -
Indigenous language:
5 -
Most popular other language:
-
Punjabi (Panjabi):
1,640
-
-
All others:
8,730
-
-
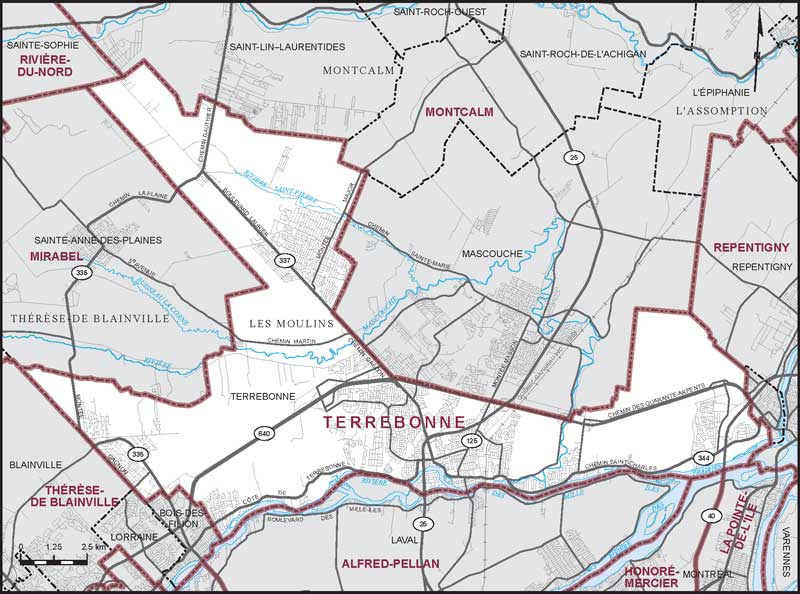
Electoral District:
TerrebonneProvince/Territory:
Québec-
Population:
119,944 -
Area:
154 km² -
Population density:
780.00/km² -
Population change:
+7.5% -
Average age:
40 -
Average income:
$53,800 -
Voter turnout:
66%
Language spoken most often at home:
-
English:
4,055 -
French:
105,115 -
Indigenous language:
0 -
Most popular other language:
-
Spanish:
1,575
-
-
All others:
3,250
-
-
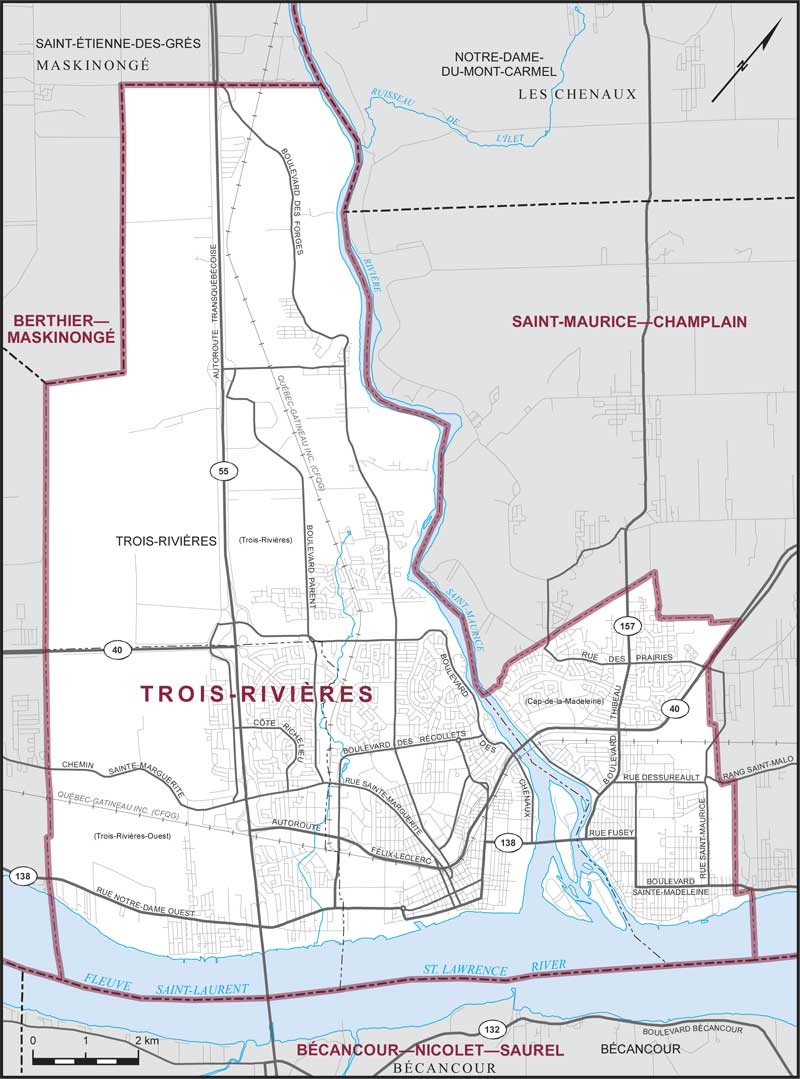
Electoral District:
Trois-RivièresProvince/Territory:
Québec-
Population:
114,064 -
Area:
125 km² -
Population density:
910.00/km² -
Population change:
+3.2% -
Average age:
46 -
Average income:
$45,440 -
Voter turnout:
64%
Language spoken most often at home:
-
English:
1,040 -
French:
106,500 -
Indigenous language:
135 -
Most popular other language:
-
Spanish:
1,025
-
-
All others:
1,335
-
-
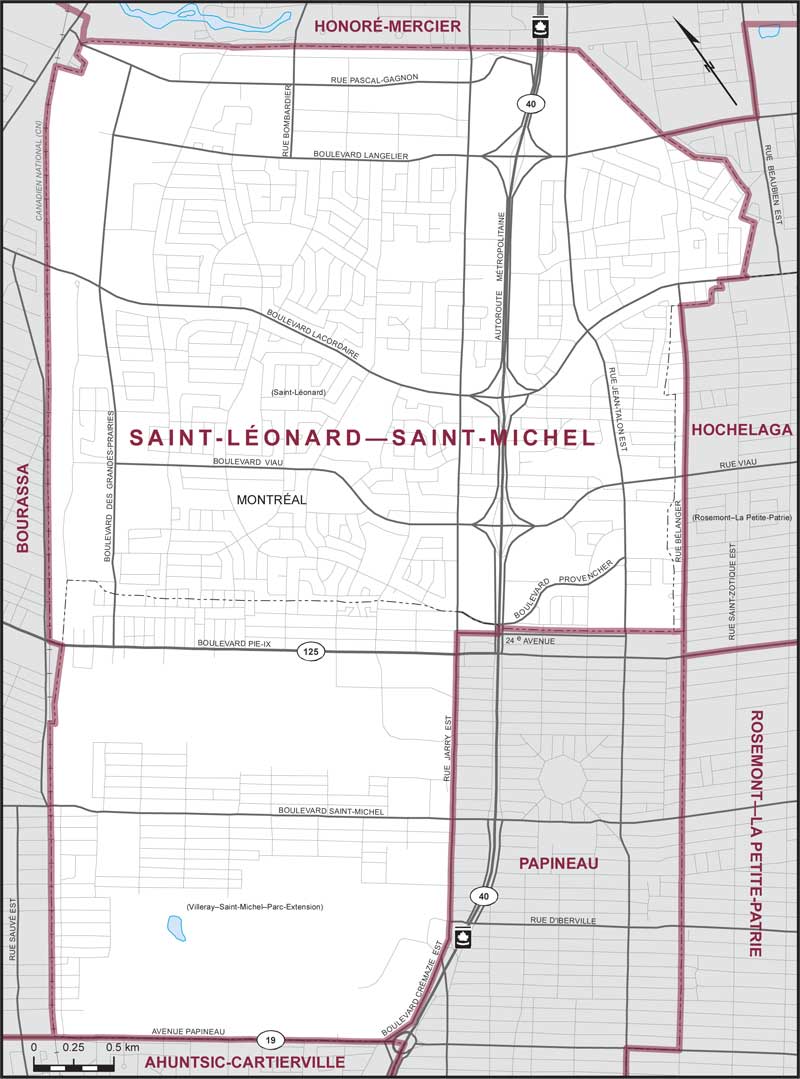
Electoral District:
Saint-Léonard—Saint-MichelProvince/Territory:
Québec-
Population:
115,553 -
Area:
20 km² -
Population density:
5,719.00/km² -
Population change:
+2.1% -
Average age:
41 -
Average income:
$39,680 -
Voter turnout:
57%
Language spoken most often at home:
-
English:
17,475 -
French:
48,365 -
Indigenous language:
5 -
Most popular other language:
-
Italian:
6,810
-
-
All others:
27,865
-
-
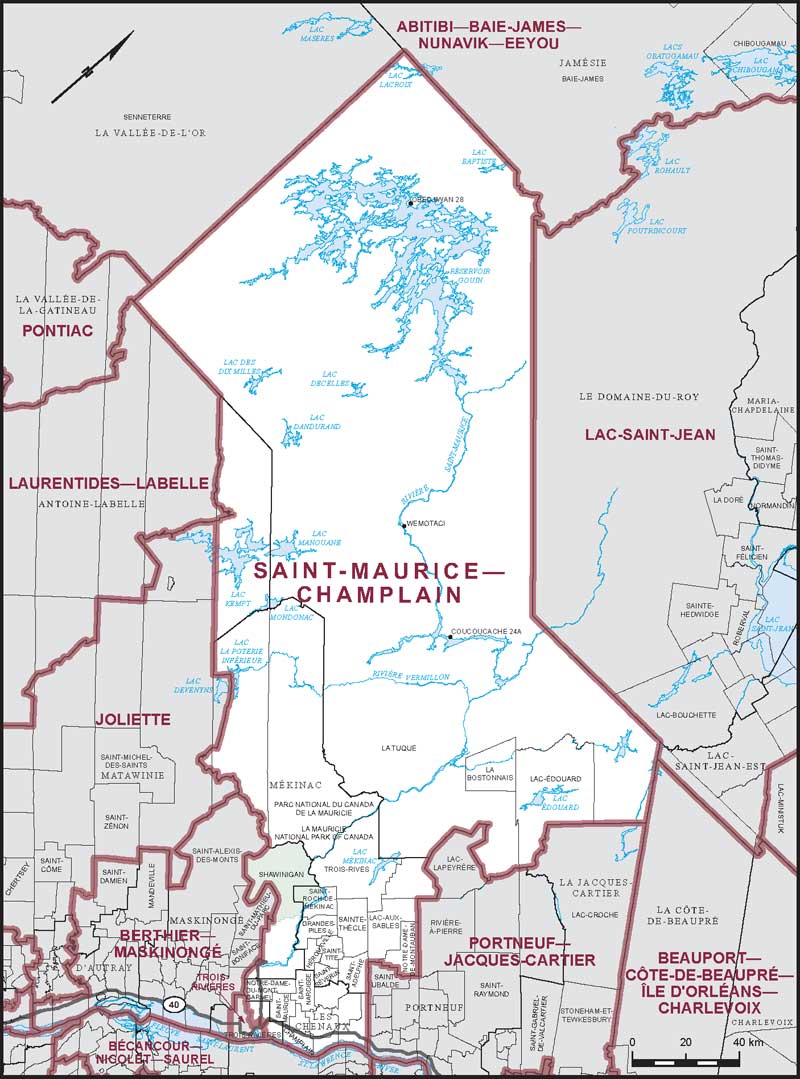
Electoral District:
Saint-Maurice—ChamplainProvince/Territory:
Québec-
Population:
111,997 -
Area:
34,187 km² -
Population density:
3.00/km² -
Population change:
+1.6% -
Average age:
47 -
Average income:
$43,040 -
Voter turnout:
62%
Language spoken most often at home:
-
English:
865 -
French:
105,355 -
Indigenous language:
2,320 -
Most popular other language:
-
Spanish:
230
-
-
All others:
325
-
-
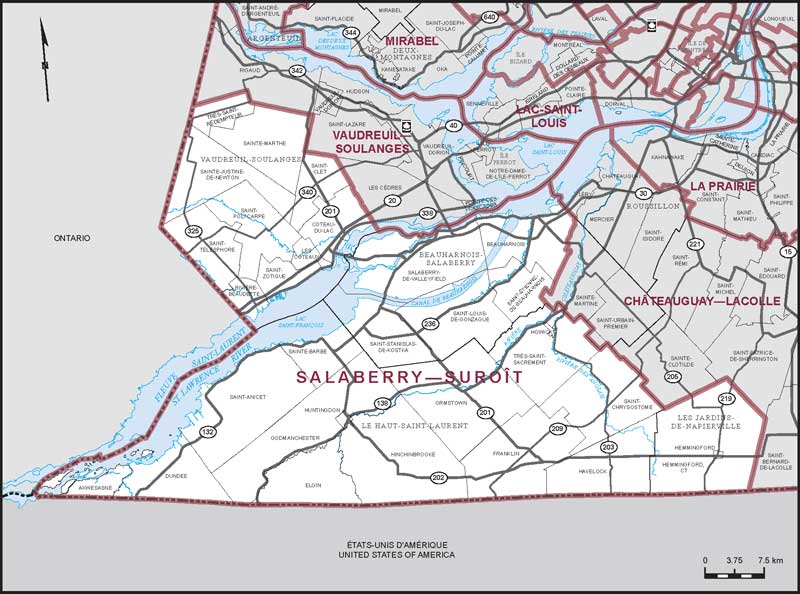
Electoral District:
Salaberry—SuroîtProvince/Territory:
Québec-
Population:
119,351 -
Area:
2,140 km² -
Population density:
56.00/km² -
Population change:
+5.8% -
Average age:
44 -
Average income:
$46,040 -
Voter turnout:
63%
Language spoken most often at home:
-
English:
12,440 -
French:
102,005 -
Indigenous language:
10 -
Most popular other language:
-
Spanish:
390
-
-
All others:
795
-
-
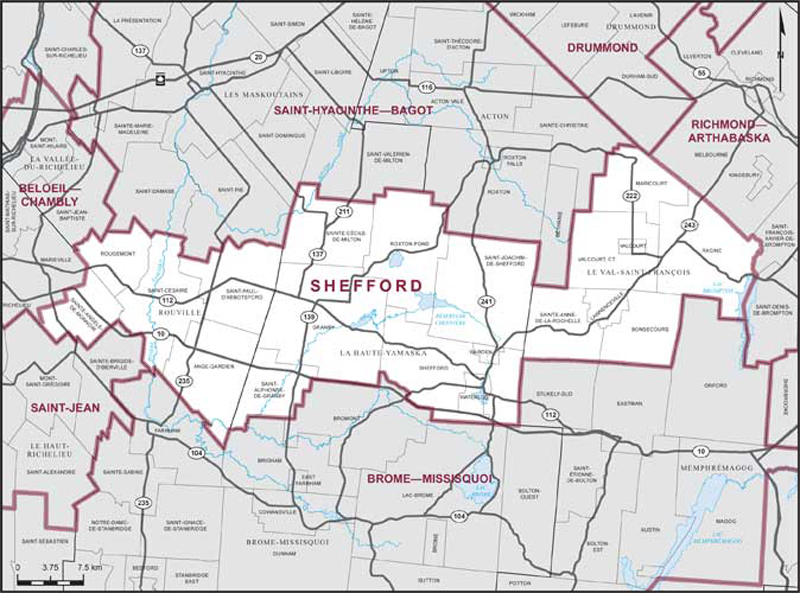
Electoral District:
SheffordProvince/Territory:
Québec-
Population:
115,924 -
Area:
1,369 km² -
Population density:
85.00/km² -
Population change:
+4.3% -
Average age:
44 -
Average income:
$46,360 -
Voter turnout:
65%
Language spoken most often at home:
-
English:
2,890 -
French:
107,530 -
Indigenous language:
0 -
Most popular other language:
-
Spanish:
925
-
-
All others:
1,200
-
-
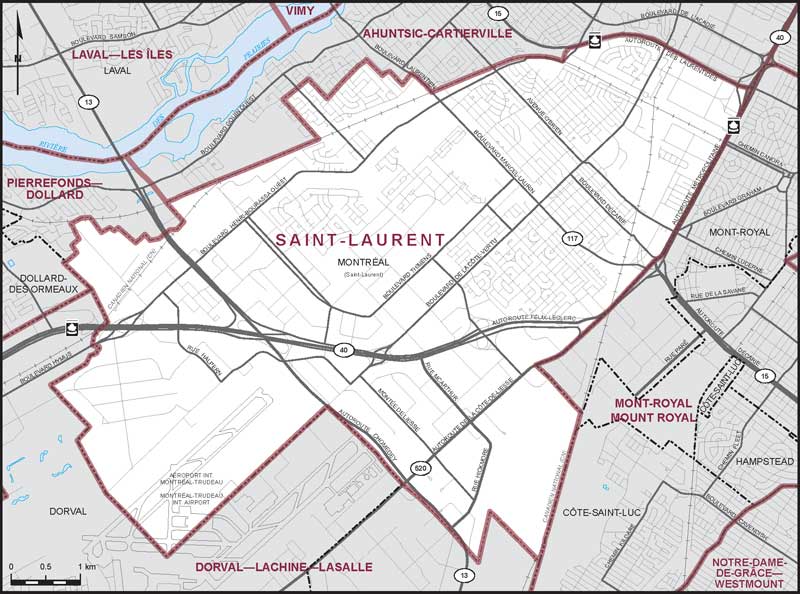
Electoral District:
Saint-LaurentProvince/Territory:
Québec-
Population:
102,104 -
Area:
43 km² -
Population density:
2,384.00/km² -
Population change:
+3.3% -
Average age:
40 -
Average income:
$50,320 -
Voter turnout:
57%
Language spoken most often at home:
-
English:
24,490 -
French:
30,990 -
Indigenous language:
5 -
Most popular other language:
-
Arabic:
10,085
-
-
All others:
22,790
-
-
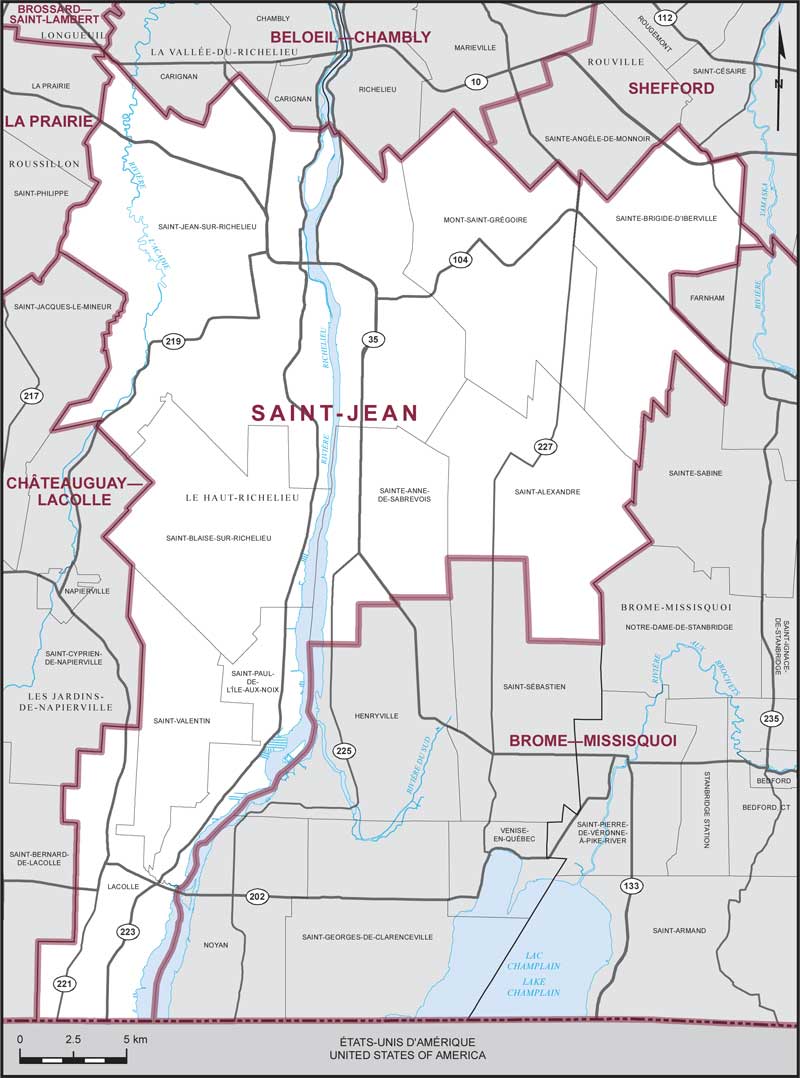
Electoral District:
Saint-JeanProvince/Territory:
Québec-
Population:
114,617 -
Area:
686 km² -
Population density:
167.00/km² -
Population change:
+3.1% -
Average age:
43 -
Average income:
$49,680 -
Voter turnout:
66%
Language spoken most often at home:
-
English:
2,970 -
French:
107,220 -
Indigenous language:
0 -
Most popular other language:
-
Spanish:
405
-
-
All others:
975
-