Federal Electoral District Fact Sheets
-
Electoral District:
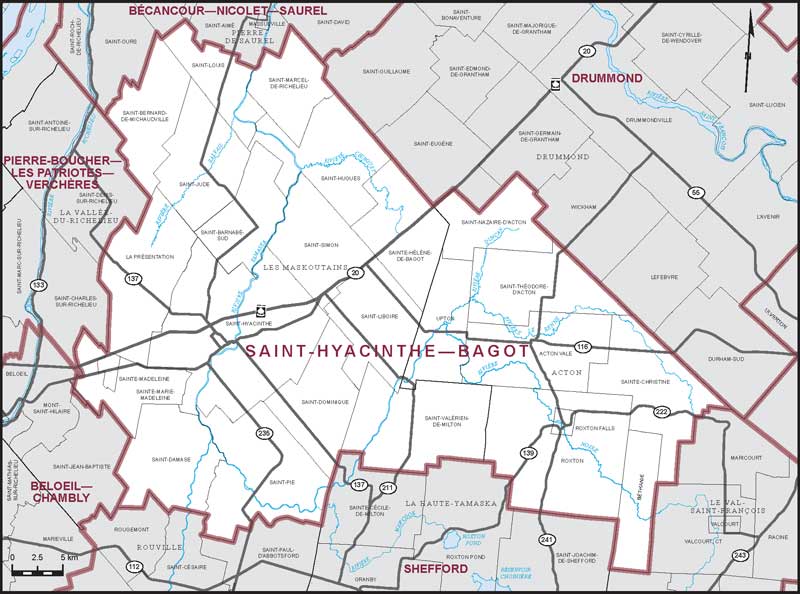
Saint-Hyacinthe—BagotProvince/Territory:
Québec-
Population:
105,086 -
Area:
1,882 km² -
Population density:
56.00/km² -
Population change:
+2.3% -
Average age:
44 -
Average income:
$45,760 -
Voter turnout:
65%
Language spoken most often at home:
-
English:
675 -
French:
99,210 -
Indigenous language:
0 -
Most popular other language:
-
Spanish:
1,570
-
-
All others:
985
-
-
Electoral District:
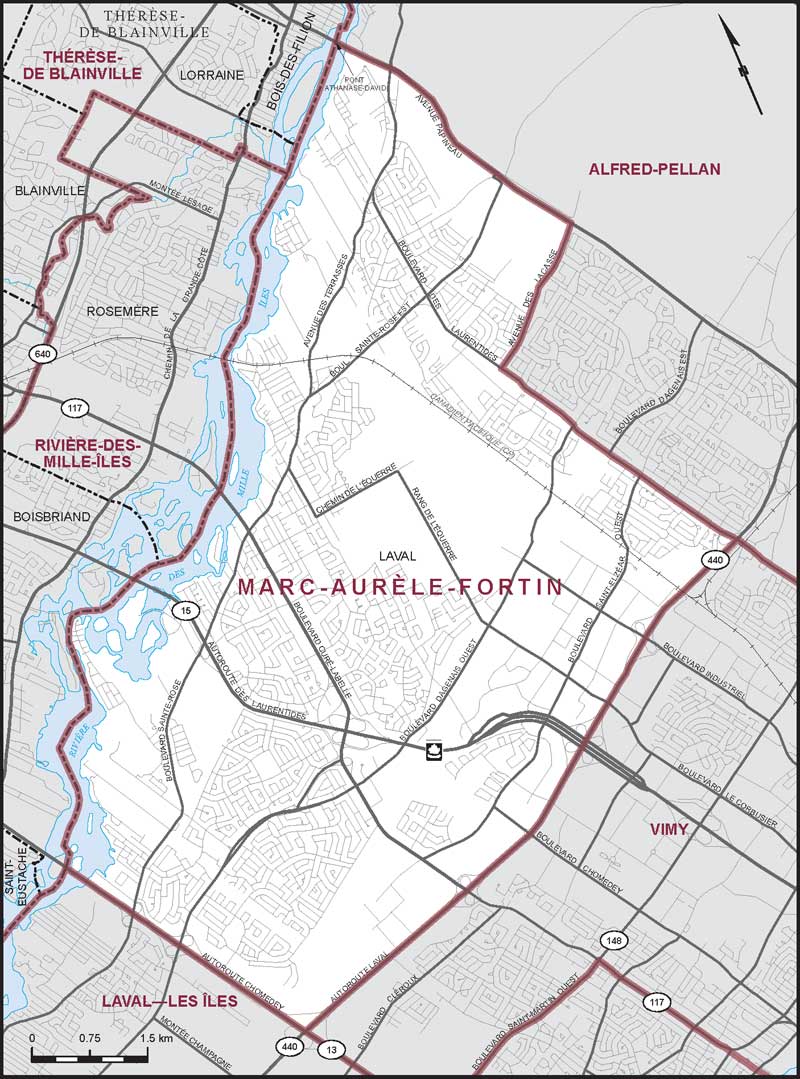
Marc-Aurèle-FortinProvince/Territory:
Québec-
Population:
104,636 -
Area:
53 km² -
Population density:
1,991.00/km² -
Population change:
+2.8% -
Average age:
40 -
Average income:
$55,050 -
Voter turnout:
67%
Language spoken most often at home:
-
English:
11,180 -
French:
71,275 -
Indigenous language:
5 -
Most popular other language:
-
Spanish:
1,845
-
-
All others:
11,455
-
-
Electoral District:
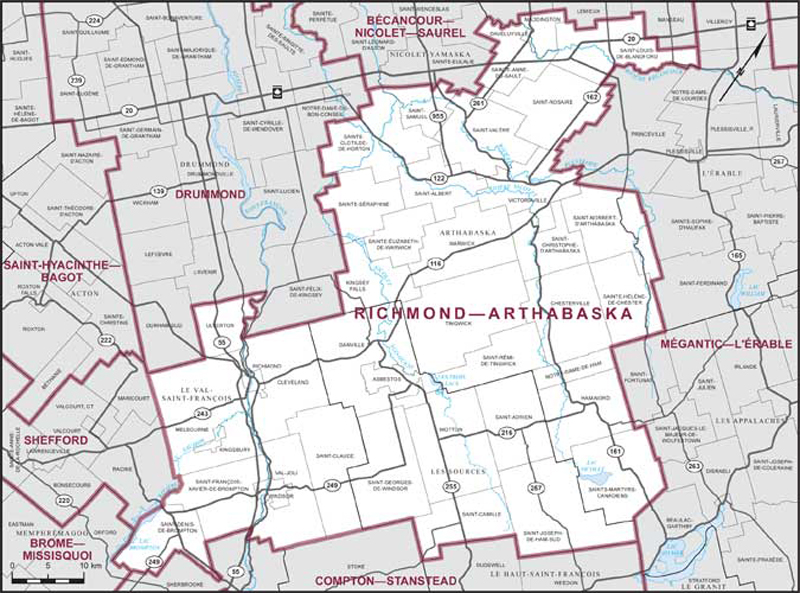
Richmond—ArthabaskaProvince/Territory:
Québec-
Population:
110,651 -
Area:
3,427 km² -
Population density:
32.00/km² -
Population change:
+3.2% -
Average age:
45 -
Average income:
$44,920 -
Voter turnout:
66%
Language spoken most often at home:
-
English:
2,625 -
French:
104,035 -
Indigenous language:
0 -
Most popular other language:
-
Spanish:
625
-
-
All others:
585
-
-
Electoral District:
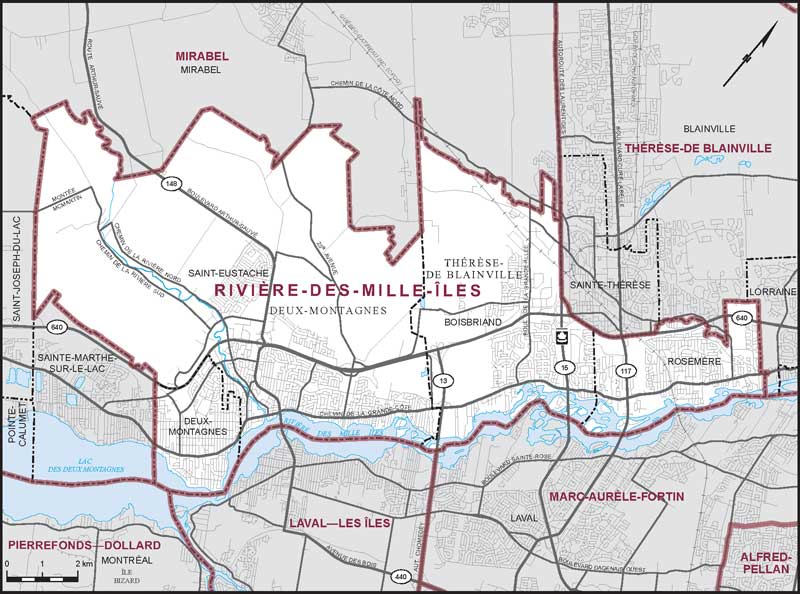
Rivière-des-Mille-ÎlesProvince/Territory:
Québec-
Population:
105,589 -
Area:
115 km² -
Population density:
919.00/km² -
Population change:
+3.2% -
Average age:
42 -
Average income:
$53,650 -
Voter turnout:
65%
Language spoken most often at home:
-
English:
9,165 -
French:
84,665 -
Indigenous language:
0 -
Most popular other language:
-
Yiddish:
1,965
-
-
All others:
5,170
-
-
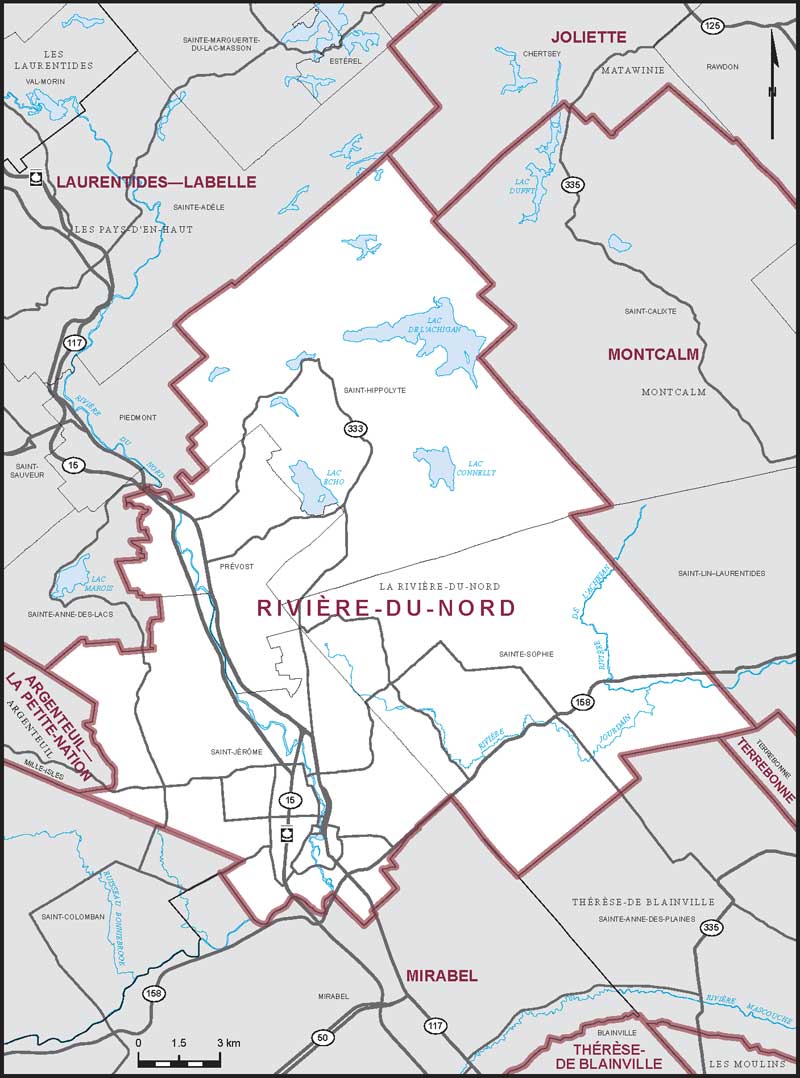
Electoral District:
Rivière-du-NordProvince/Territory:
Québec-
Population:
122,654 -
Area:
355 km² -
Population density:
345.00/km² -
Population change:
+9.4% -
Average age:
43 -
Average income:
$47,200 -
Voter turnout:
59%
Language spoken most often at home:
-
English:
2,155 -
French:
115,230 -
Indigenous language:
0 -
Most popular other language:
-
Spanish:
785
-
-
All others:
1,160
-
-
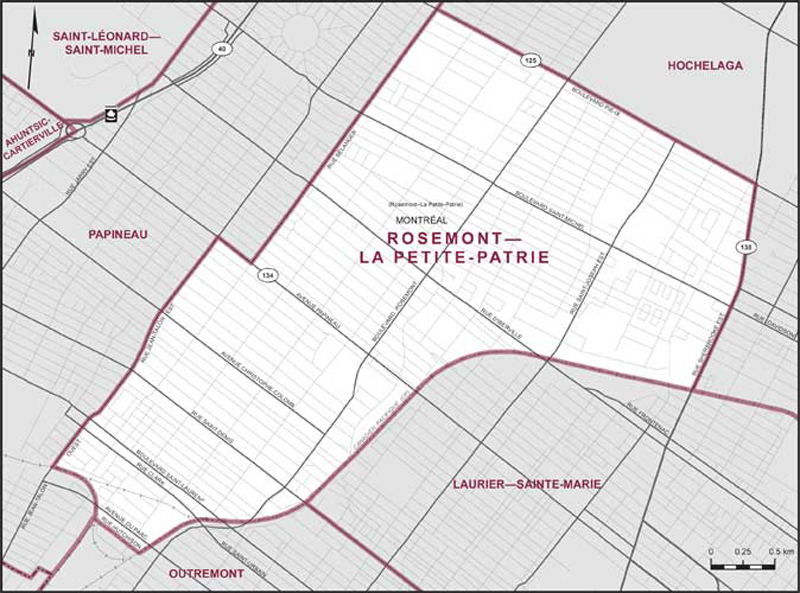
Electoral District:
Rosemont—La Petite-PatrieProvince/Territory:
Québec-
Population:
112,909 -
Area:
11 km² -
Population density:
10,546.00/km² -
Population change:
+2% -
Average age:
40 -
Average income:
$52,800 -
Voter turnout:
68%
Language spoken most often at home:
-
English:
8,380 -
French:
88,480 -
Indigenous language:
10 -
Most popular other language:
-
Spanish:
2,890
-
-
All others:
5,925
-
-
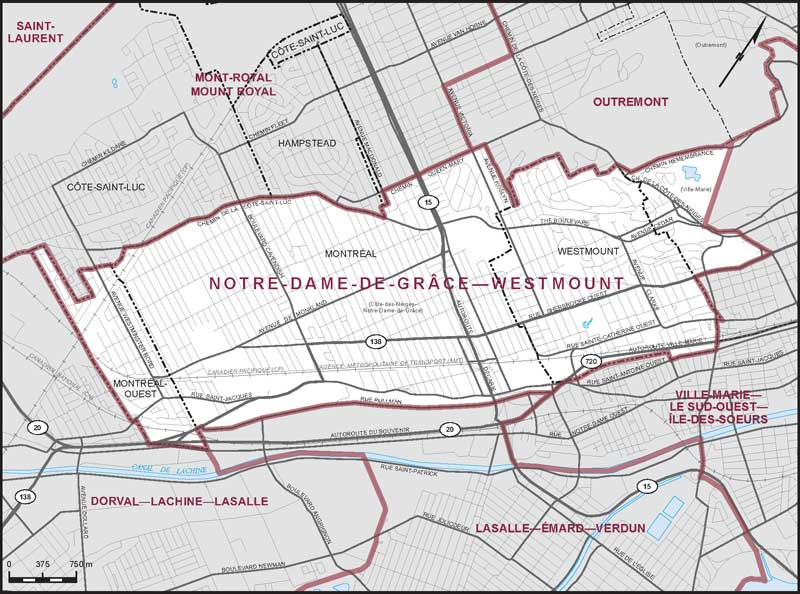
Electoral District:
Notre-Dame-de-Grâce—WestmountProvince/Territory:
Québec-
Population:
105,601 -
Area:
16 km² -
Population density:
6,583.00/km² -
Population change:
+0.6% -
Average age:
42 -
Average income:
$85,200 -
Voter turnout:
63%
Language spoken most often at home:
-
English:
53,350 -
French:
24,315 -
Indigenous language:
10 -
Most popular other language:
-
Mandarin:
2,505
-
-
All others:
15,535
-
-
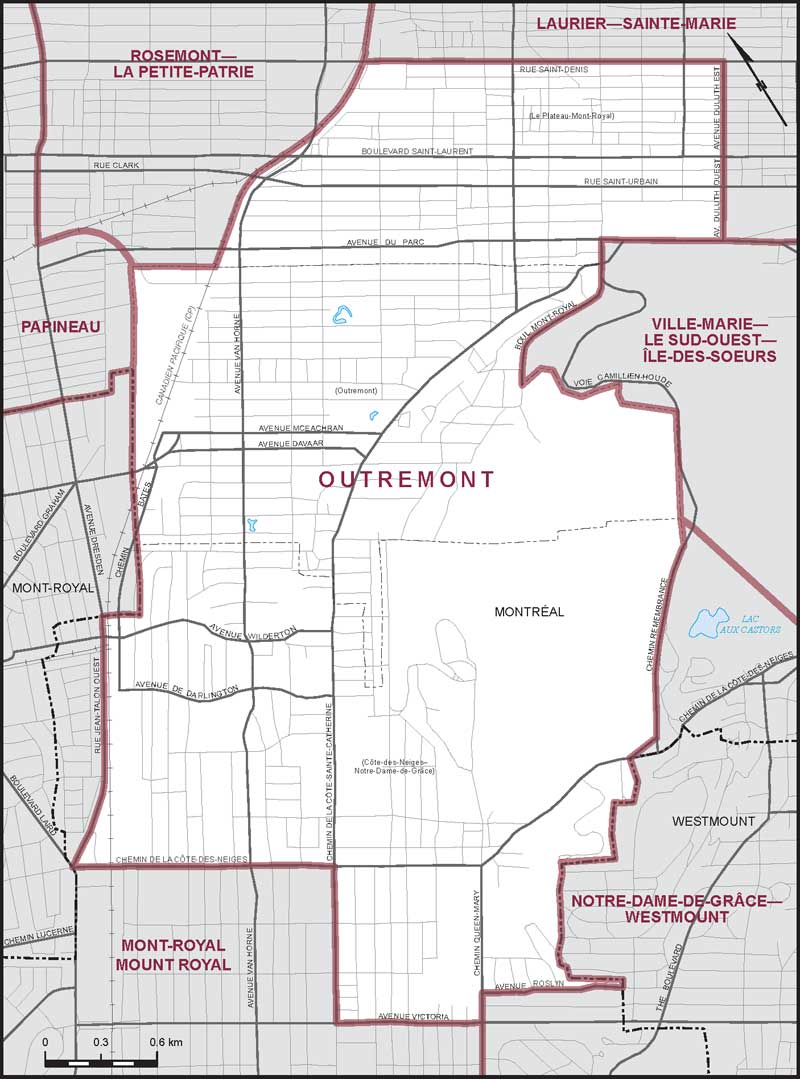
Electoral District:
OutremontProvince/Territory:
Québec-
Population:
103,620 -
Area:
12 km² -
Population density:
8,678.00/km² -
Population change:
+1.5% -
Average age:
38 -
Average income:
$59,750 -
Voter turnout:
57%
Language spoken most often at home:
-
English:
24,030 -
French:
48,650 -
Indigenous language:
15 -
Most popular other language:
-
Yiddish:
5,465
-
-
All others:
15,180
-
-
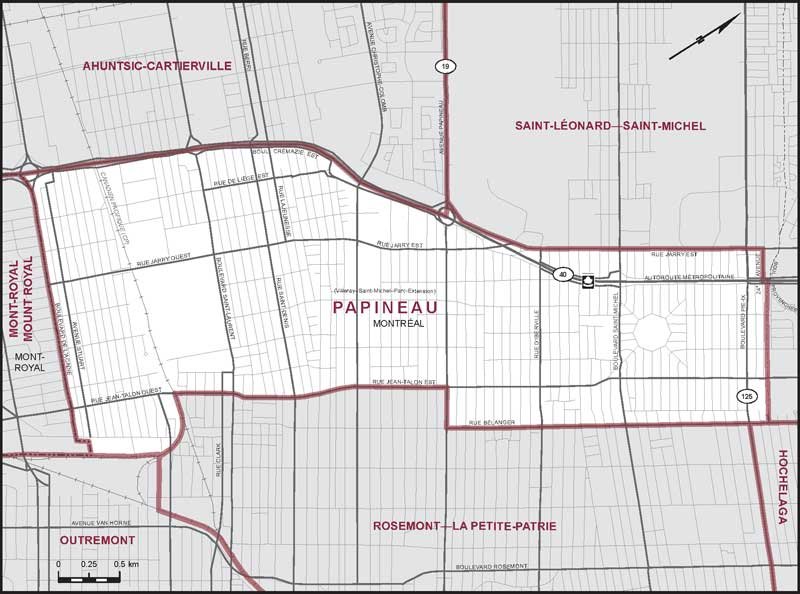
Electoral District:
PapineauProvince/Territory:
Québec-
Population:
110,813 -
Area:
10 km² -
Population density:
11,197.00/km² -
Population change:
+0.1% -
Average age:
39 -
Average income:
$43,160 -
Voter turnout:
64%
Language spoken most often at home:
-
English:
12,370 -
French:
58,770 -
Indigenous language:
5 -
Most popular other language:
-
Punjabi (Panjabi):
4,880
-
-
All others:
23,865
-
-
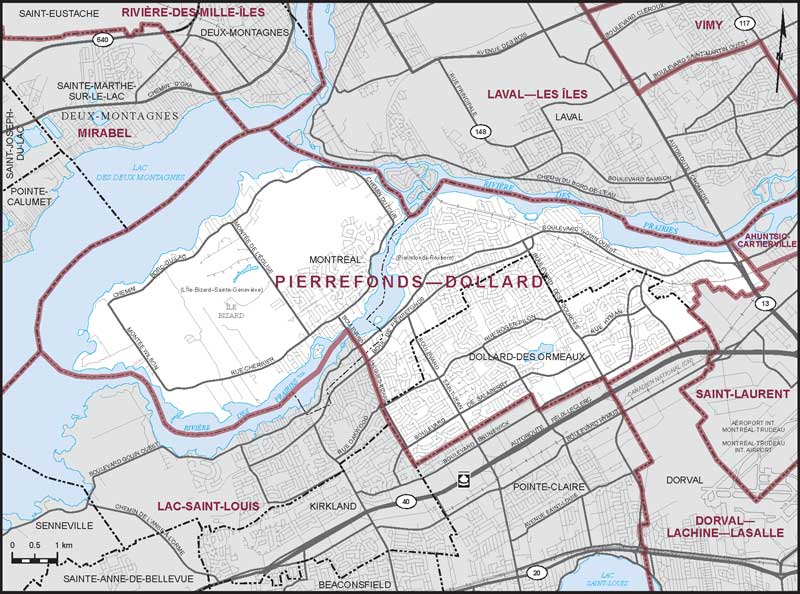
Electoral District:
Pierrefonds—DollardProvince/Territory:
Québec-
Population:
109,497 -
Area:
51 km² -
Population density:
2,158.00/km² -
Population change:
+0.8% -
Average age:
42 -
Average income:
$53,200 -
Voter turnout:
65%
Language spoken most often at home:
-
English:
48,465 -
French:
24,990 -
Indigenous language:
0 -
Most popular other language:
-
Arabic:
4,235
-
-
All others:
19,150
-
-
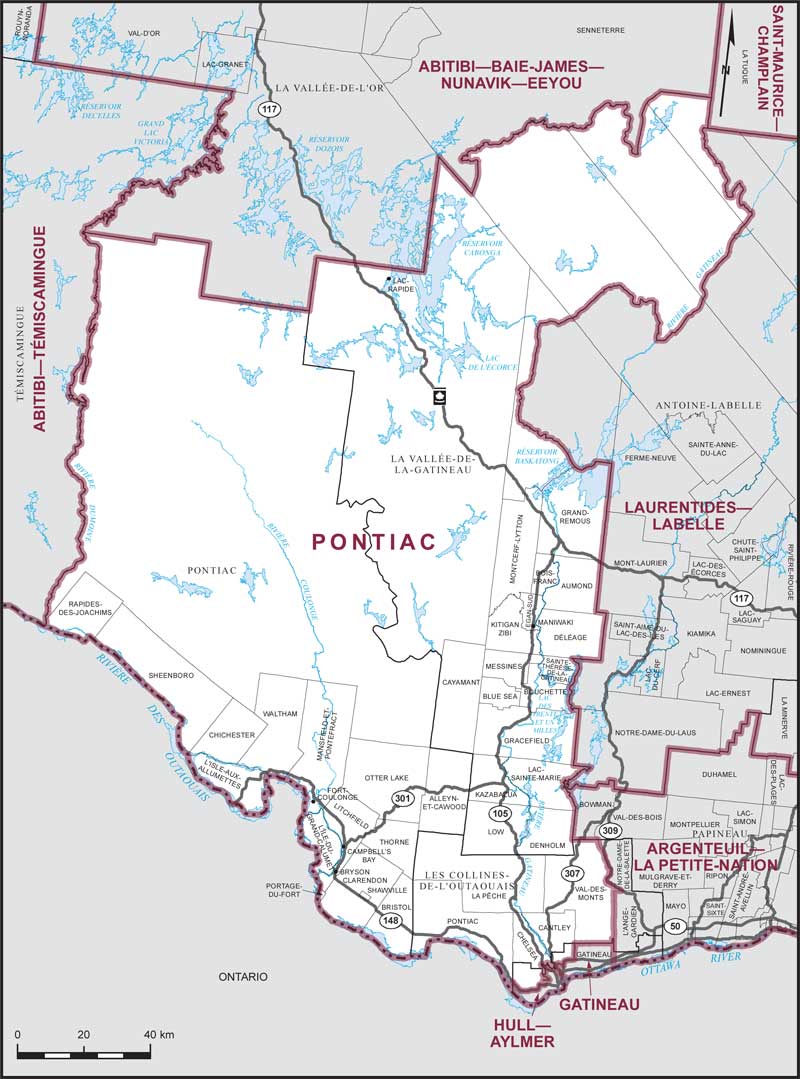
Electoral District:
PontiacProvince/Territory:
Québec-
Population:
129,781 -
Area:
26,974 km² -
Population density:
5.00/km² -
Population change:
+12.3% -
Average age:
41 -
Average income:
$56,950 -
Voter turnout:
65%
Language spoken most often at home:
-
English:
35,840 -
French:
82,780 -
Indigenous language:
60 -
Most popular other language:
-
Arabic:
1,085
-
-
All others:
3,610
-
-
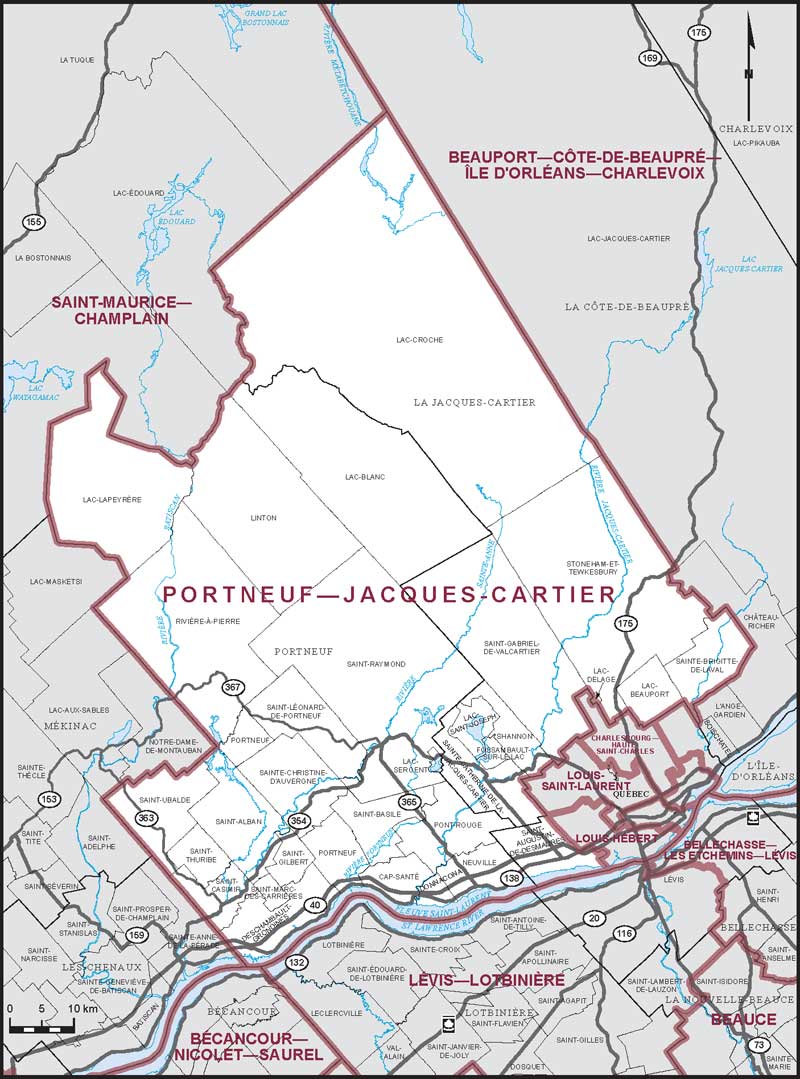
Electoral District:
Portneuf—Jacques-CartierProvince/Territory:
Québec-
Population:
123,243 -
Area:
7,157 km² -
Population density:
17.00/km² -
Population change:
+6.9% -
Average age:
42 -
Average income:
$57,150 -
Voter turnout:
69%
Language spoken most often at home:
-
English:
1,760 -
French:
118,825 -
Indigenous language:
0 -
Most popular other language:
-
Spanish:
235
-
-
All others:
315
-
-
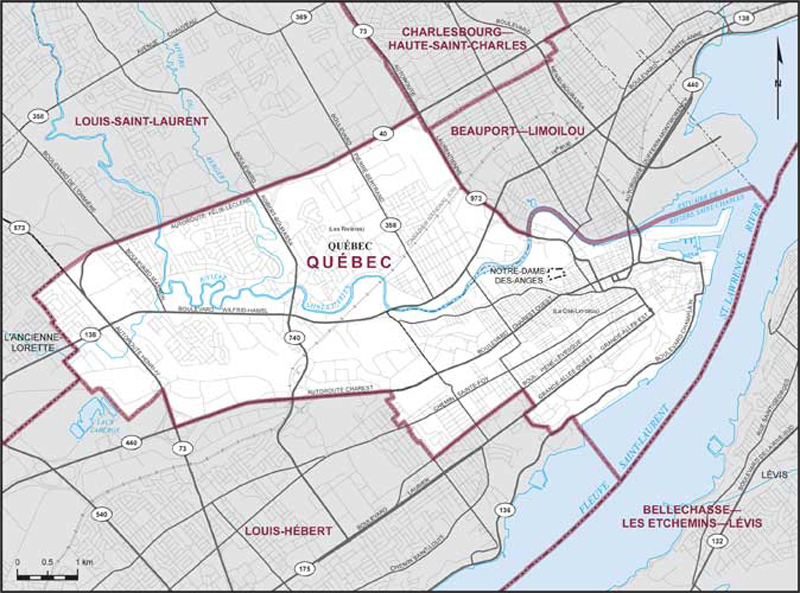
Electoral District:
QuébecProvince/Territory:
Québec-
Population:
98,772 -
Area:
35 km² -
Population density:
2,864.00/km² -
Population change:
+1.7% -
Average age:
46 -
Average income:
$49,560 -
Voter turnout:
67%
Language spoken most often at home:
-
English:
1,765 -
French:
88,630 -
Indigenous language:
30 -
Most popular other language:
-
Spanish:
1,155
-
-
All others:
2,585
-
-
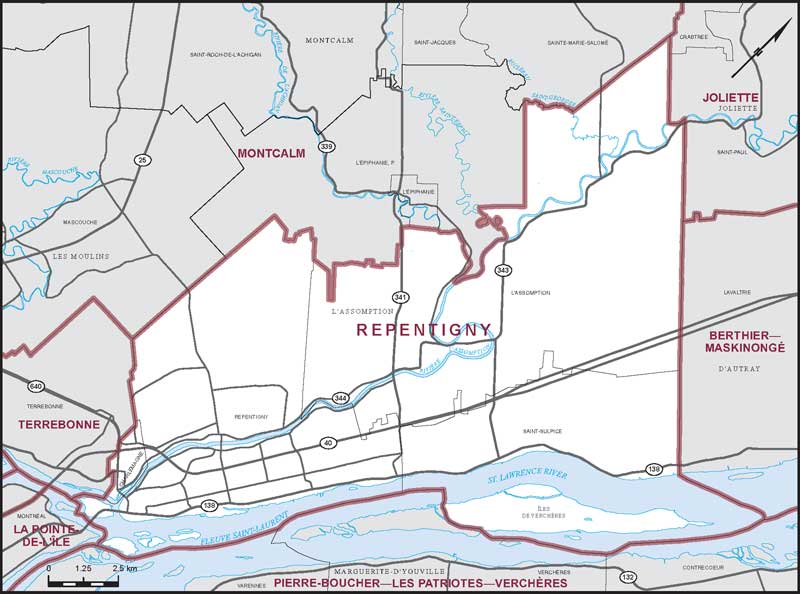
Electoral District:
RepentignyProvince/Territory:
Québec-
Population:
119,204 -
Area:
199 km² -
Population density:
600.00/km² -
Population change:
+2.7% -
Average age:
42 -
Average income:
$52,400 -
Voter turnout:
66%
Language spoken most often at home:
-
English:
1,985 -
French:
109,485 -
Indigenous language:
0 -
Most popular other language:
-
Spanish:
1,245
-
-
All others:
2,510
-
-
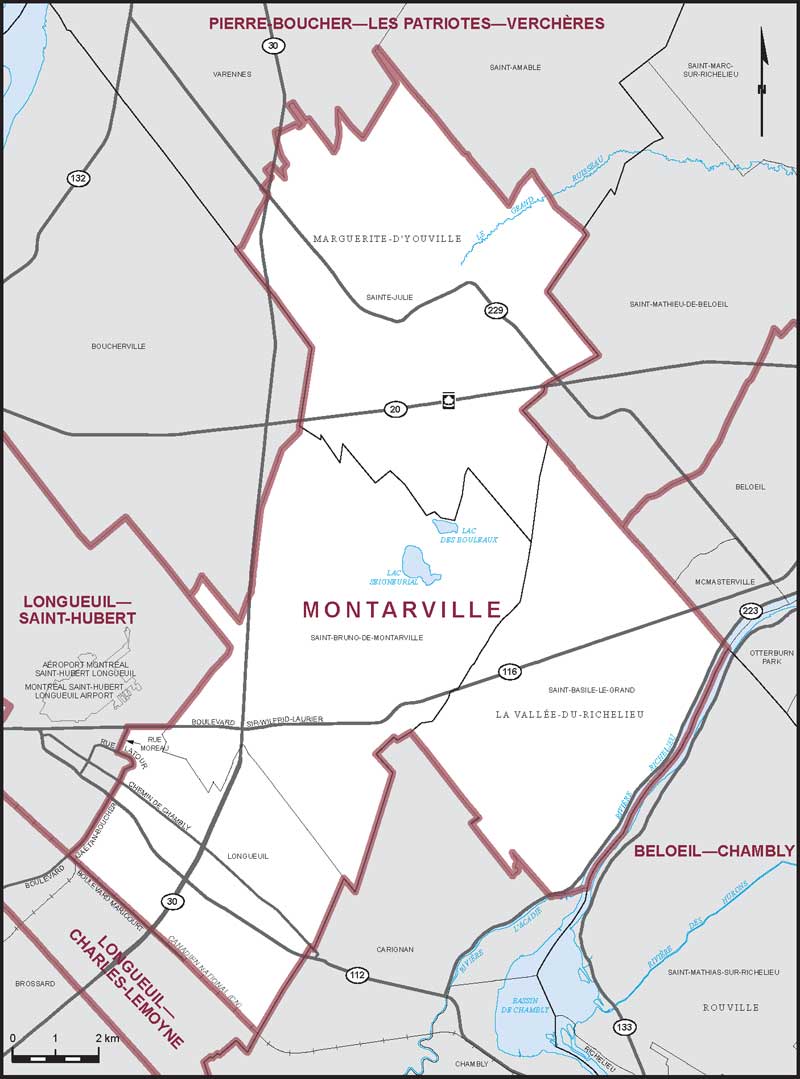
Electoral District:
MontarvilleProvince/Territory:
Québec-
Population:
100,515 -
Area:
150 km² -
Population density:
669.00/km² -
Population change:
+2.8% -
Average age:
42 -
Average income:
$63,650 -
Voter turnout:
75%
Language spoken most often at home:
-
English:
5,325 -
French:
86,080 -
Indigenous language:
0 -
Most popular other language:
-
Spanish:
1,350
-
-
All others:
3,230
-
-
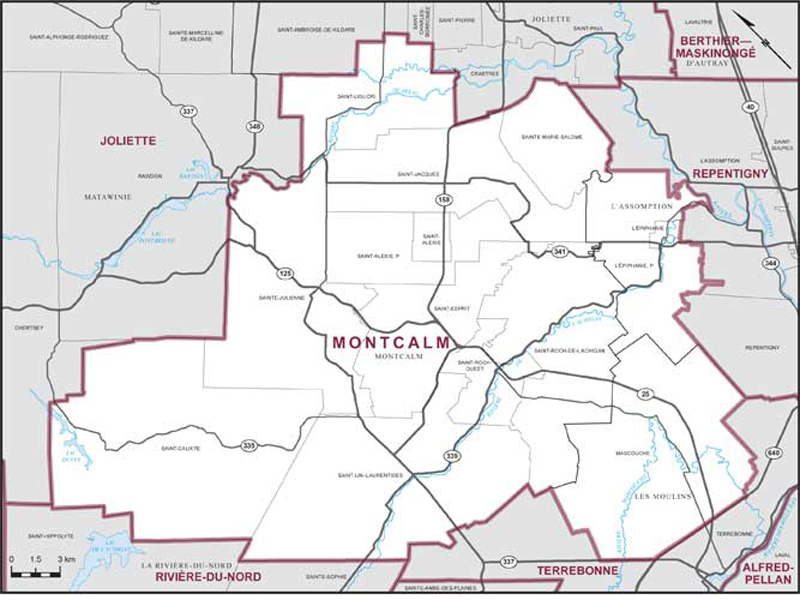
Electoral District:
MontcalmProvince/Territory:
Québec-
Population:
118,746 -
Area:
873 km² -
Population density:
136.00/km² -
Population change:
+10% -
Average age:
40 -
Average income:
$48,640 -
Voter turnout:
57%
Language spoken most often at home:
-
English:
2,075 -
French:
112,105 -
Indigenous language:
0 -
Most popular other language:
-
Spanish:
660
-
-
All others:
965
-