Federal Electoral District Fact Sheets
-
Electoral District:
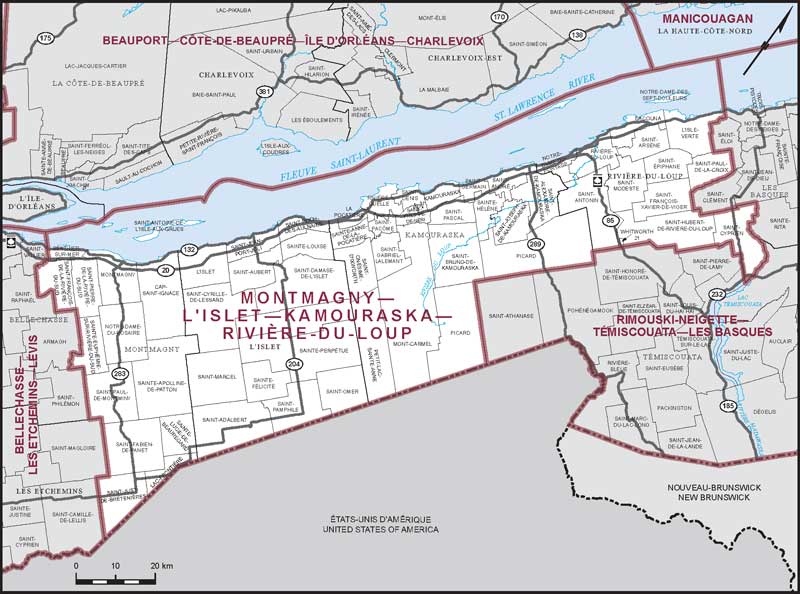
Montmagny—L'Islet—Kamouraska—Rivière-du-LoupProvince/Territory:
Québec-
Population:
96,527 -
Area:
7,310 km² -
Population density:
13.00/km² -
Population change:
+1.3% -
Average age:
47 -
Average income:
$44,120 -
Voter turnout:
62%
Language spoken most often at home:
-
English:
355 -
French:
94,000 -
Indigenous language:
0 -
Most popular other language:
-
Spanish:
225
-
-
All others:
220
-
-
Electoral District:
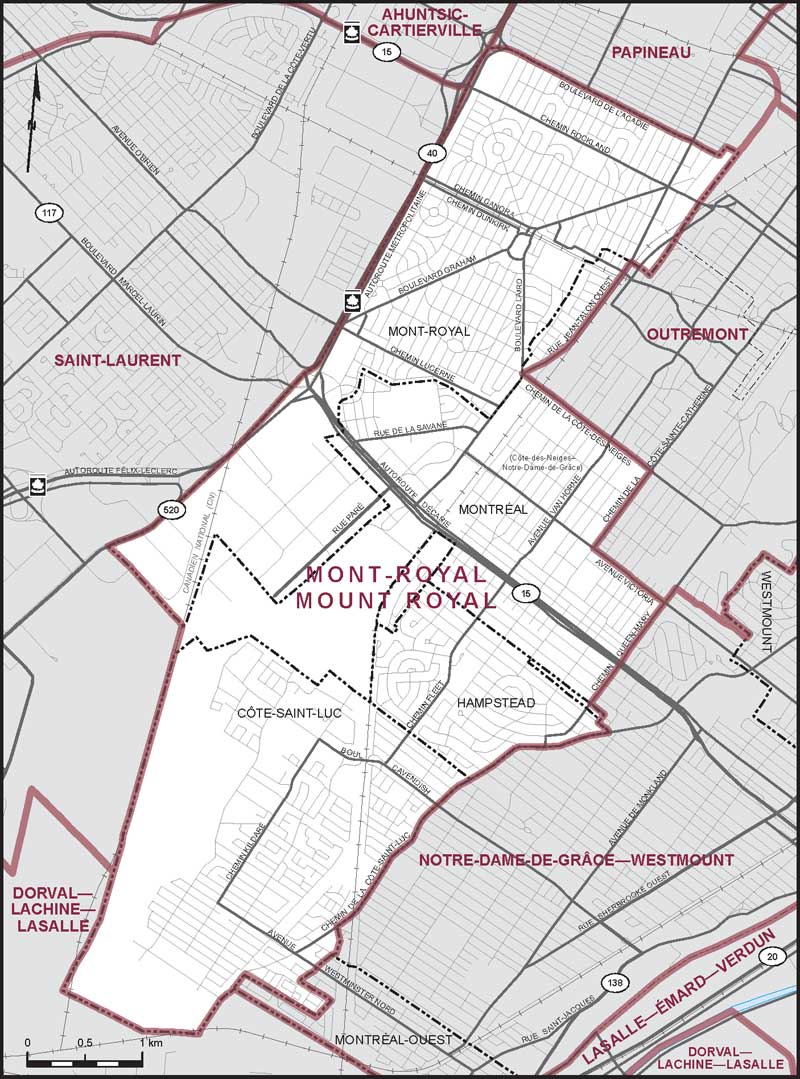
Mount RoyalProvince/Territory:
Québec-
Population:
108,484 -
Area:
23 km² -
Population density:
4,795.00/km² -
Population change:
+5% -
Average age:
41 -
Average income:
$64,200 -
Voter turnout:
57%
Language spoken most often at home:
-
English:
45,085 -
French:
24,575 -
Indigenous language:
0 -
Most popular other language:
-
Tagalog (Pilipino, Filipino):
3,920
-
-
All others:
22,790
-
-
Electoral District:
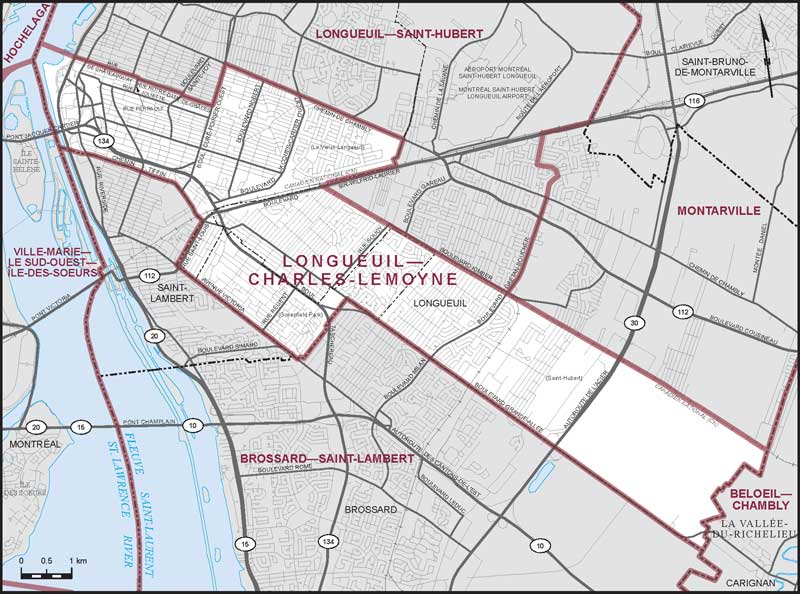
Longueuil—Charles-LeMoyneProvince/Territory:
Québec-
Population:
112,257 -
Area:
37 km² -
Population density:
2,998.00/km² -
Population change:
+5.3% -
Average age:
41 -
Average income:
$44,240 -
Voter turnout:
60%
Language spoken most often at home:
-
English:
11,910 -
French:
79,830 -
Indigenous language:
0 -
Most popular other language:
-
Spanish:
3,745
-
-
All others:
9,215
-
-
Electoral District:
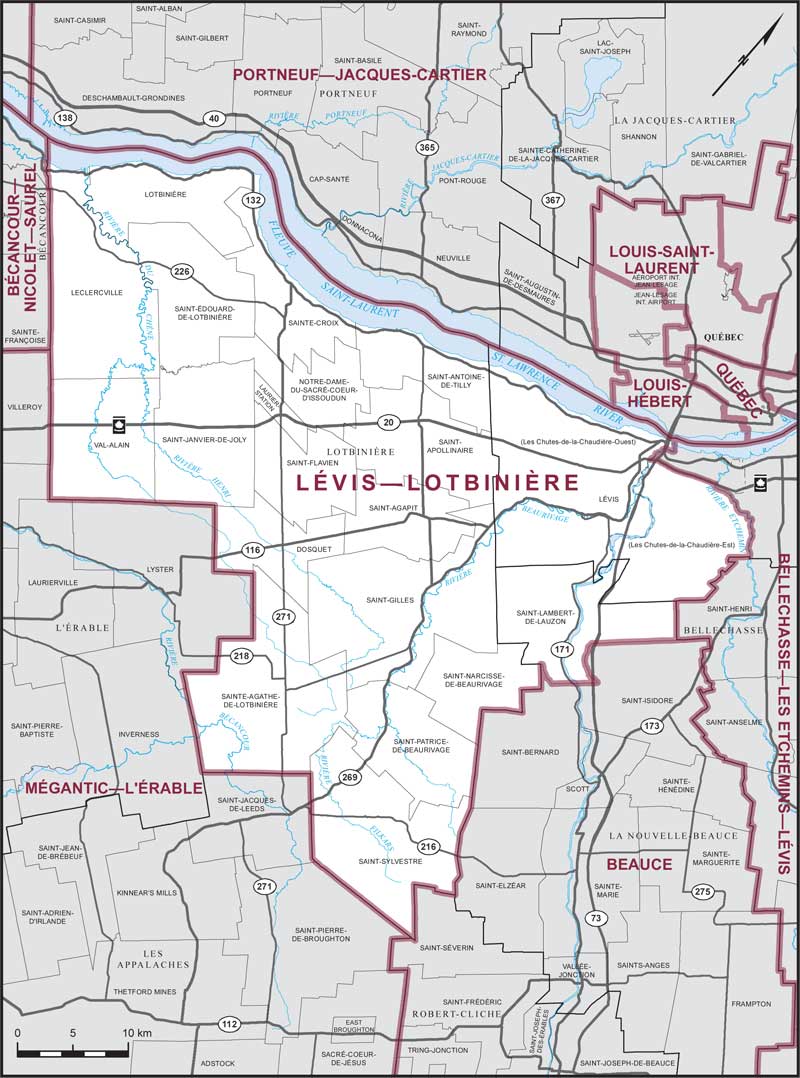
Lévis—LotbinièreProvince/Territory:
Québec-
Population:
118,608 -
Area:
2,065 km² -
Population density:
57.00/km² -
Population change:
+4.5% -
Average age:
41 -
Average income:
$54,600 -
Voter turnout:
70%
Language spoken most often at home:
-
English:
865 -
French:
115,120 -
Indigenous language:
0 -
Most popular other language:
-
Spanish:
375
-
-
All others:
475
-
-
Electoral District:
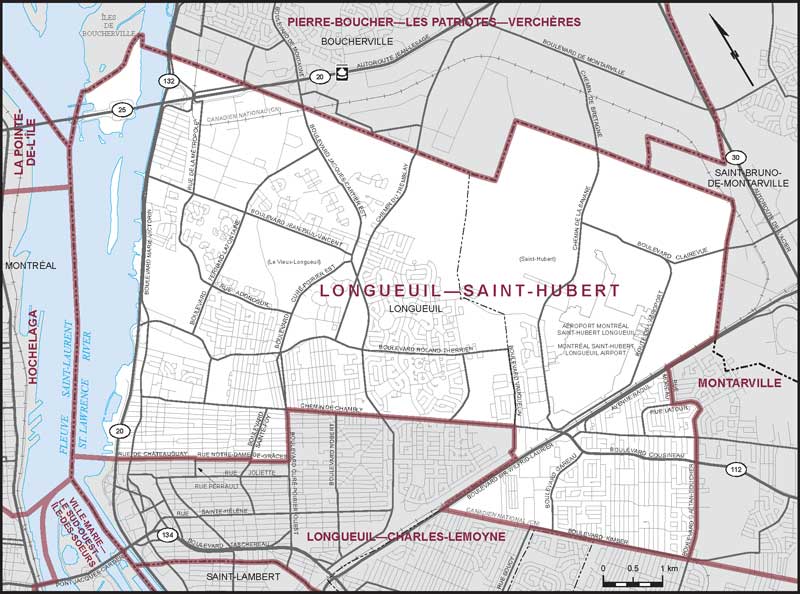
Longueuil—Saint-HubertProvince/Territory:
Québec-
Population:
115,082 -
Area:
55 km² -
Population density:
2,084.00/km² -
Population change:
+5.9% -
Average age:
43 -
Average income:
$52,400 -
Voter turnout:
68%
Language spoken most often at home:
-
English:
5,235 -
French:
92,425 -
Indigenous language:
0 -
Most popular other language:
-
Spanish:
3,325
-
-
All others:
6,650
-
-
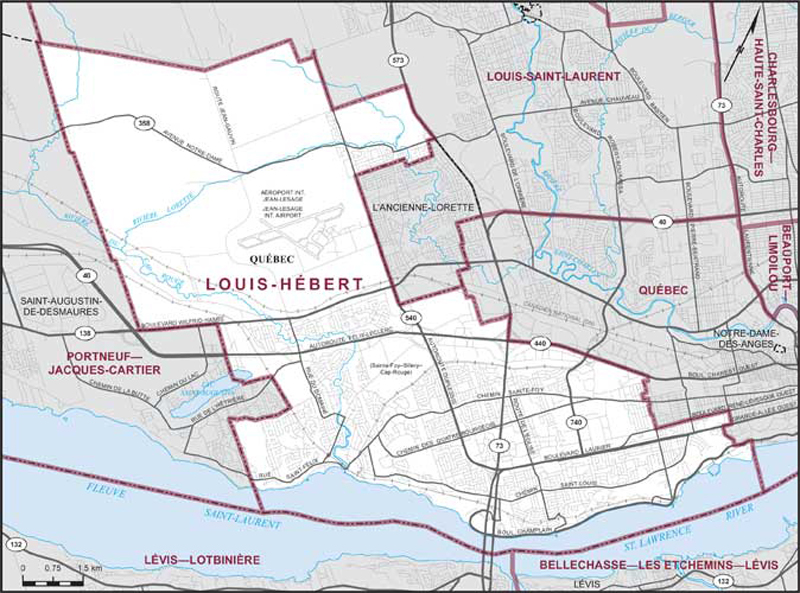
Electoral District:
Louis-HébertProvince/Territory:
Québec-
Population:
111,322 -
Area:
94 km² -
Population density:
1,179.00/km² -
Population change:
+7.7% -
Average age:
44 -
Average income:
$60,500 -
Voter turnout:
74%
Language spoken most often at home:
-
English:
2,050 -
French:
98,010 -
Indigenous language:
40 -
Most popular other language:
-
Spanish:
1,750
-
-
All others:
4,660
-
-
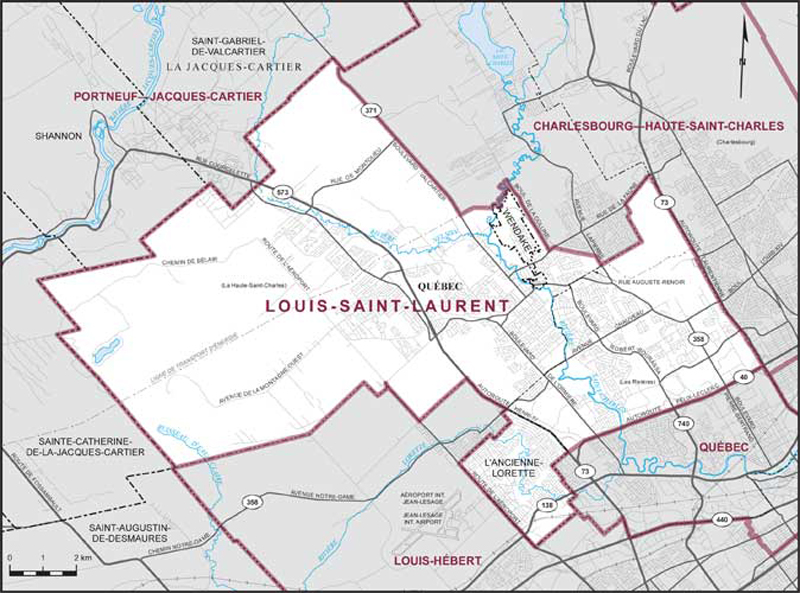
Electoral District:
Louis-Saint-LaurentProvince/Territory:
Québec-
Population:
123,123 -
Area:
138 km² -
Population density:
892.00/km² -
Population change:
+5% -
Average age:
43 -
Average income:
$54,450 -
Voter turnout:
68%
Language spoken most often at home:
-
English:
1,265 -
French:
116,590 -
Indigenous language:
125 -
Most popular other language:
-
Spanish:
805
-
-
All others:
1,460
-
-
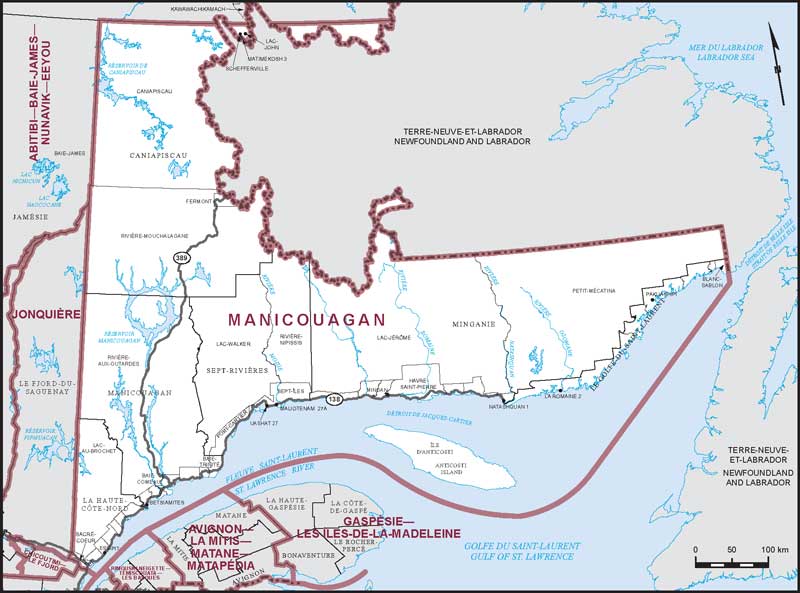
Electoral District:
ManicouaganProvince/Territory:
Québec-
Population:
88,525 -
Area:
234,442 km² -
Population density:
0.40/km² -
Population change:
-4.3% -
Average age:
44 -
Average income:
$53,100 -
Voter turnout:
50%
Language spoken most often at home:
-
English:
4,025 -
French:
75,880 -
Indigenous language:
5,665 -
Most popular other language:
-
Spanish:
75
-
-
All others:
200
-
-
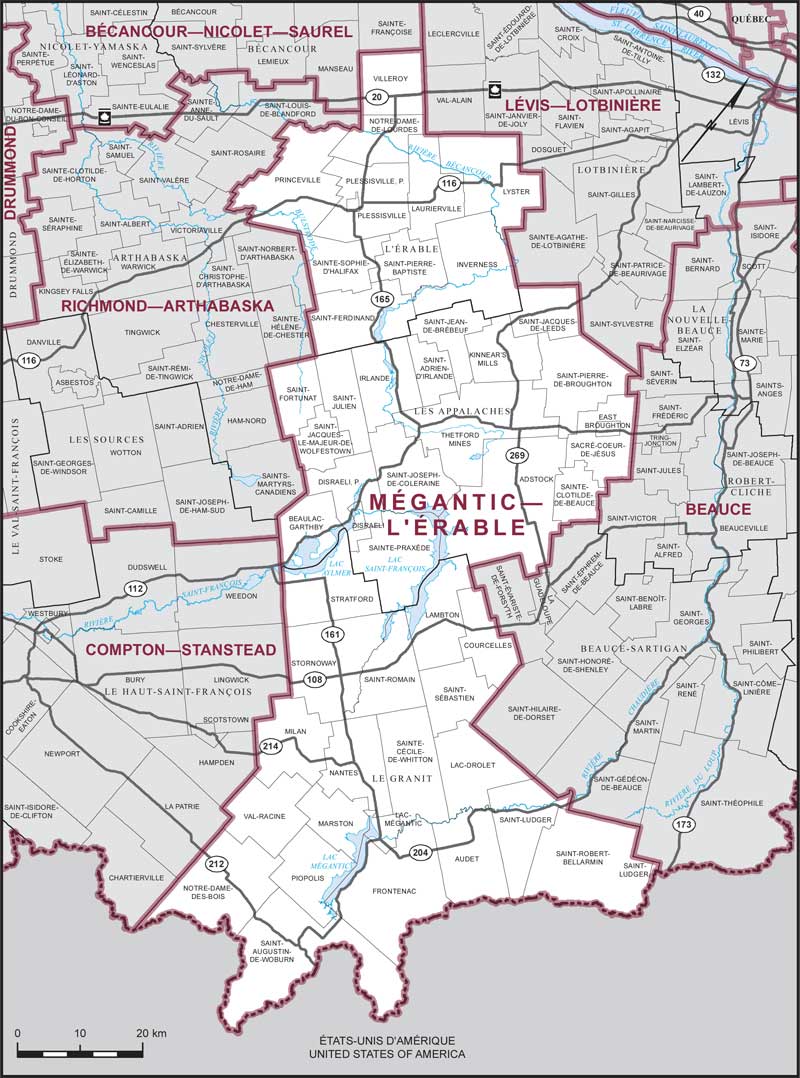
Electoral District:
Mégantic—L'ÉrableProvince/Territory:
Québec-
Population:
88,894 -
Area:
5,930 km² -
Population density:
15.00/km² -
Population change:
+1.9% -
Average age:
47 -
Average income:
$41,840 -
Voter turnout:
65%
Language spoken most often at home:
-
English:
740 -
French:
85,715 -
Indigenous language:
0 -
Most popular other language:
-
Spanish:
485
-
-
All others:
330
-
-
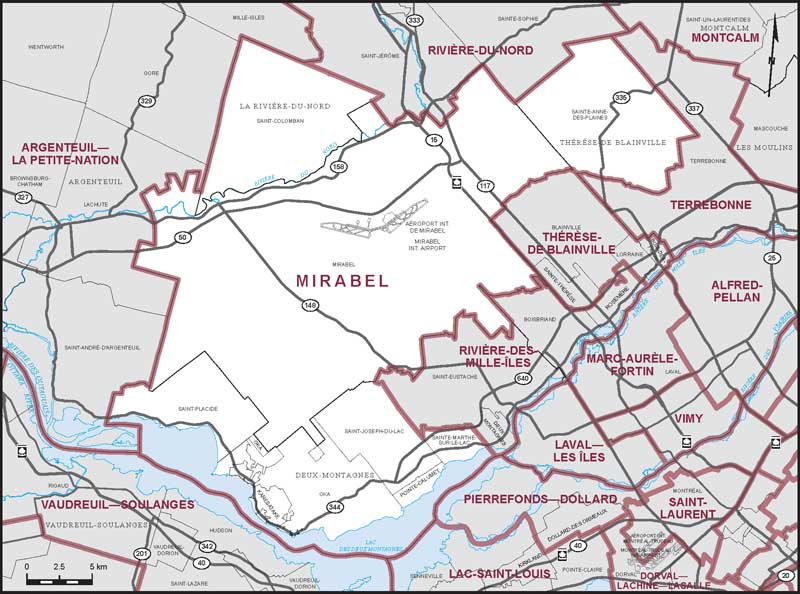
Electoral District:
MirabelProvince/Territory:
Québec-
Population:
132,930 -
Area:
837 km² -
Population density:
159.00/km² -
Population change:
+13% -
Average age:
38 -
Average income:
$52,550 -
Voter turnout:
64%
Language spoken most often at home:
-
English:
4,230 -
French:
122,220 -
Indigenous language:
0 -
Most popular other language:
-
Spanish:
690
-
-
All others:
2,035
-
-
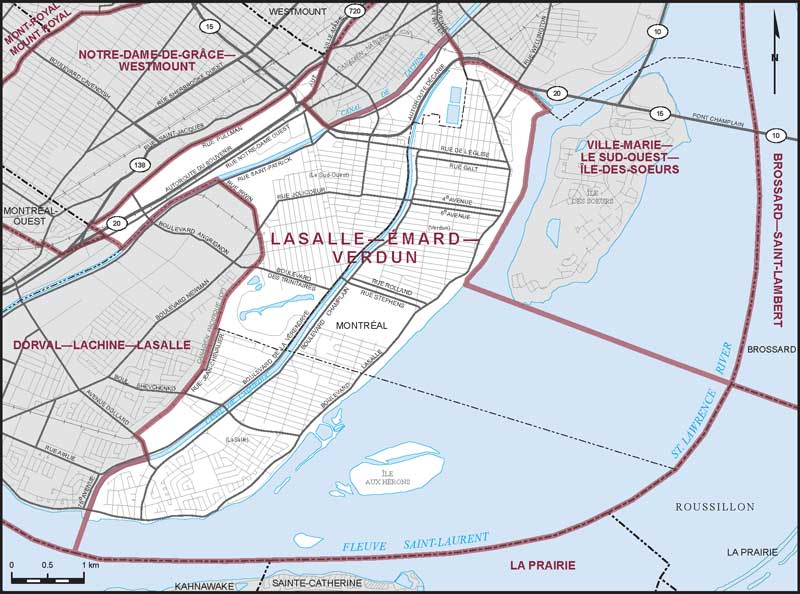
Electoral District:
LaSalle—Émard—VerdunProvince/Territory:
Québec-
Population:
107,564 -
Area:
19 km² -
Population density:
5,695.00/km² -
Population change:
+0.8% -
Average age:
42 -
Average income:
$47,720 -
Voter turnout:
61%
Language spoken most often at home:
-
English:
26,900 -
French:
58,575 -
Indigenous language:
15 -
Most popular other language:
-
Spanish:
2,540
-
-
All others:
10,670
-
-
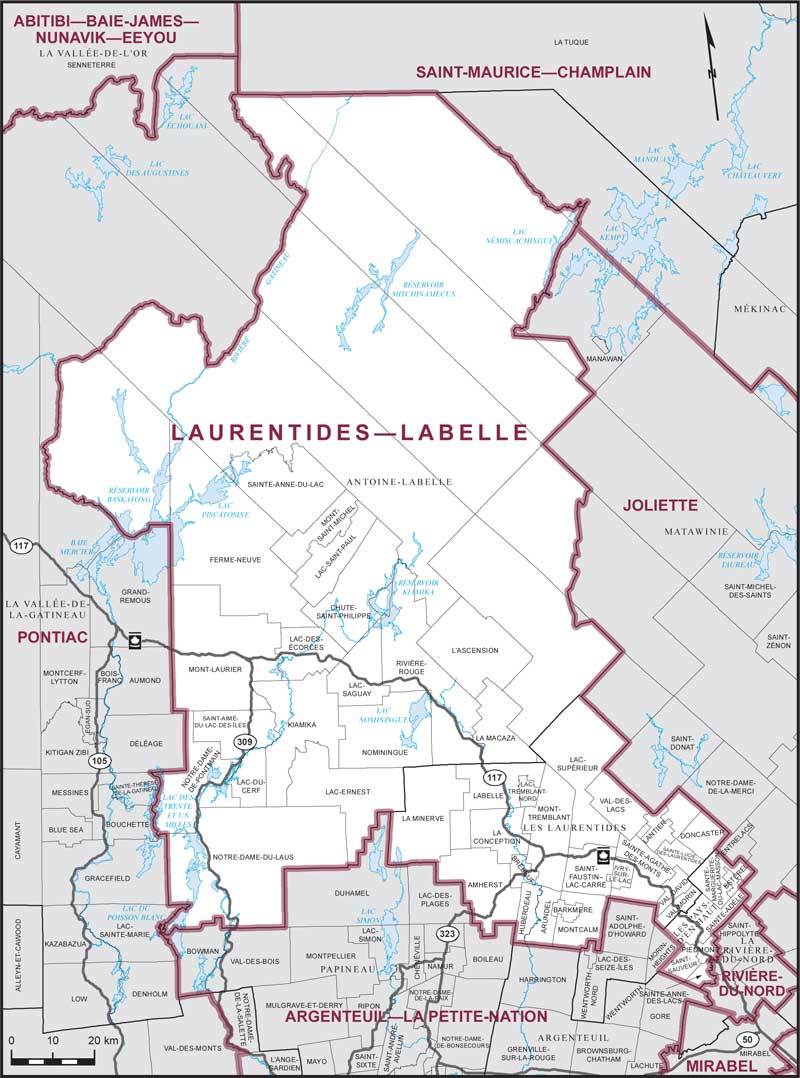
Electoral District:
Laurentides—LabelleProvince/Territory:
Québec-
Population:
123,795 -
Area:
17,588 km² -
Population density:
7.00/km² -
Population change:
+8.8% -
Average age:
49 -
Average income:
$48,760 -
Voter turnout:
62%
Language spoken most often at home:
-
English:
6,210 -
French:
113,630 -
Indigenous language:
5 -
Most popular other language:
-
Spanish:
250
-
-
All others:
505
-
-
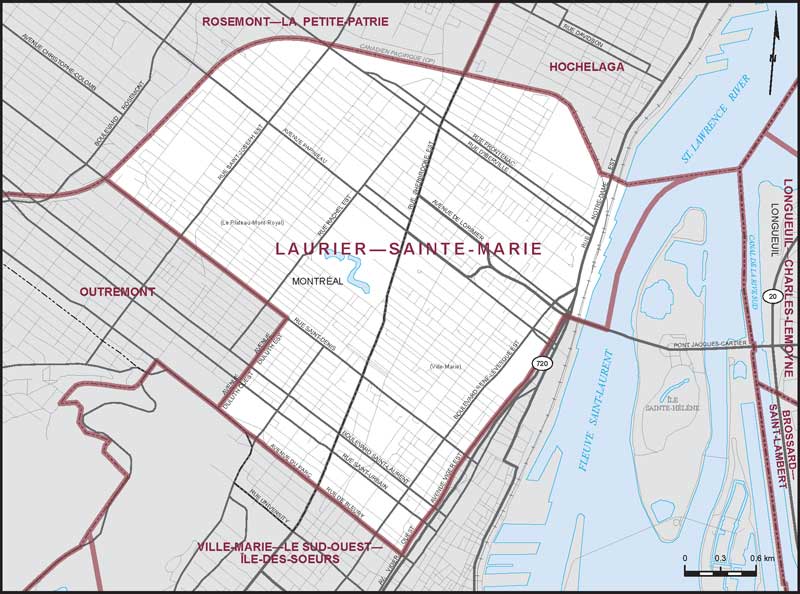
Electoral District:
Laurier—Sainte-MarieProvince/Territory:
Québec-
Population:
116,932 -
Area:
10 km² -
Population density:
11,286.00/km² -
Population change:
+4.6% -
Average age:
39 -
Average income:
$52,150 -
Voter turnout:
56%
Language spoken most often at home:
-
English:
19,025 -
French:
78,840 -
Indigenous language:
10 -
Most popular other language:
-
Spanish:
2,520
-
-
All others:
7,760
-
-
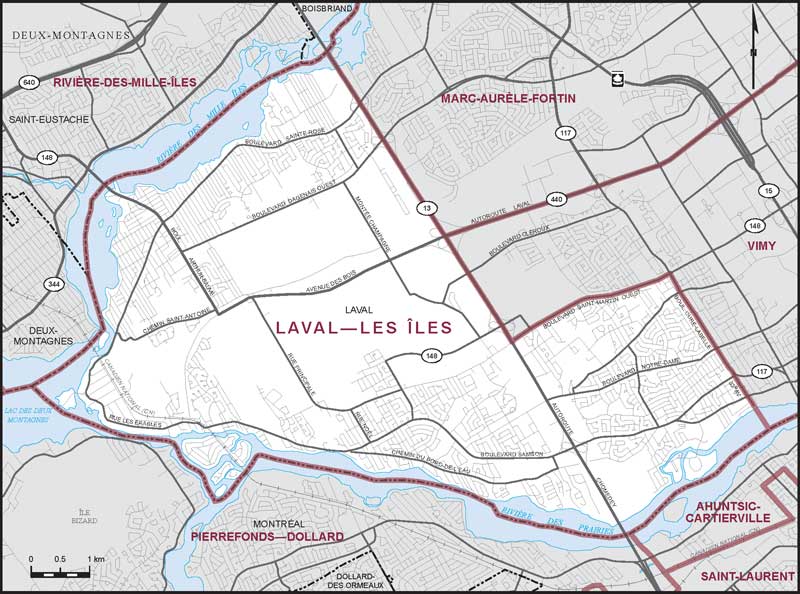
Electoral District:
Laval—Les ÎlesProvince/Territory:
Québec-
Population:
111,784 -
Area:
46 km² -
Population density:
2,425.00/km² -
Population change:
+3.5% -
Average age:
42 -
Average income:
$51,800 -
Voter turnout:
62%
Language spoken most often at home:
-
English:
22,895 -
French:
50,560 -
Indigenous language:
5 -
Most popular other language:
-
Arabic:
5,880
-
-
All others:
19,660
-
-
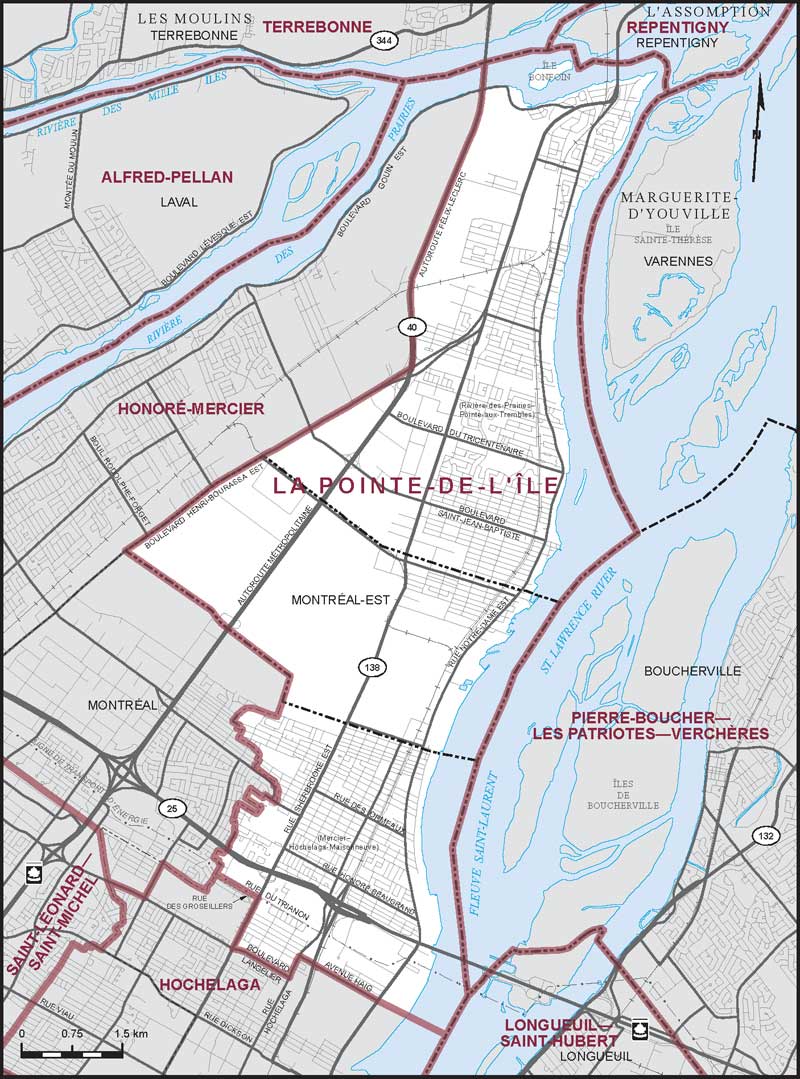
Electoral District:
La Pointe-de-l'ÎleProvince/Territory:
Québec-
Population:
110,486 -
Area:
41 km² -
Population density:
2,666.00/km² -
Population change:
+3.9% -
Average age:
43 -
Average income:
$46,600 -
Voter turnout:
62%
Language spoken most often at home:
-
English:
3,975 -
French:
88,850 -
Indigenous language:
0 -
Most popular other language:
-
Spanish:
2,915
-
-
All others:
6,060
-
-
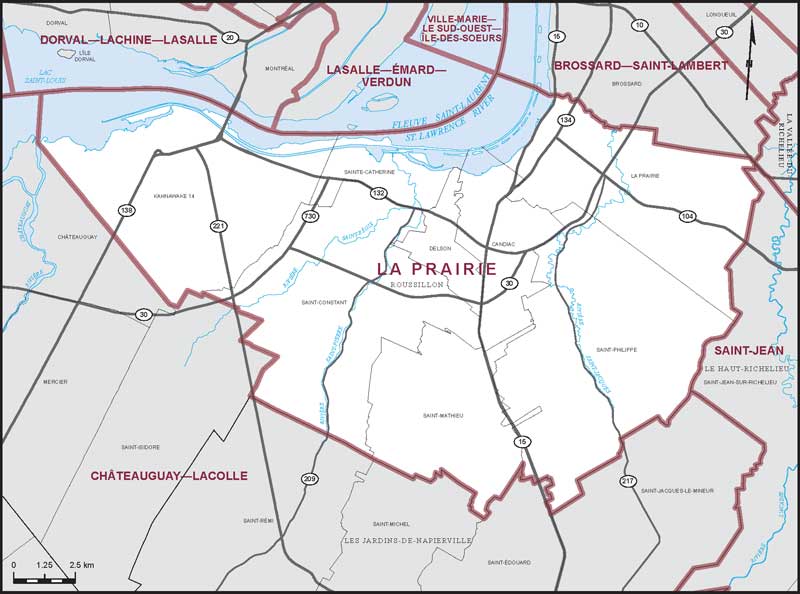
Electoral District:
La PrairieProvince/Territory:
Québec-
Population:
114,968 -
Area:
278 km² -
Population density:
414.00/km² -
Population change:
+9% -
Average age:
40 -
Average income:
$60,050 -
Voter turnout:
68%
Language spoken most often at home:
-
English:
8,570 -
French:
90,920 -
Indigenous language:
0 -
Most popular other language:
-
Spanish:
2,280
-
-
All others:
7,215
-