Federal Electoral District Fact Sheets
-
Electoral District:
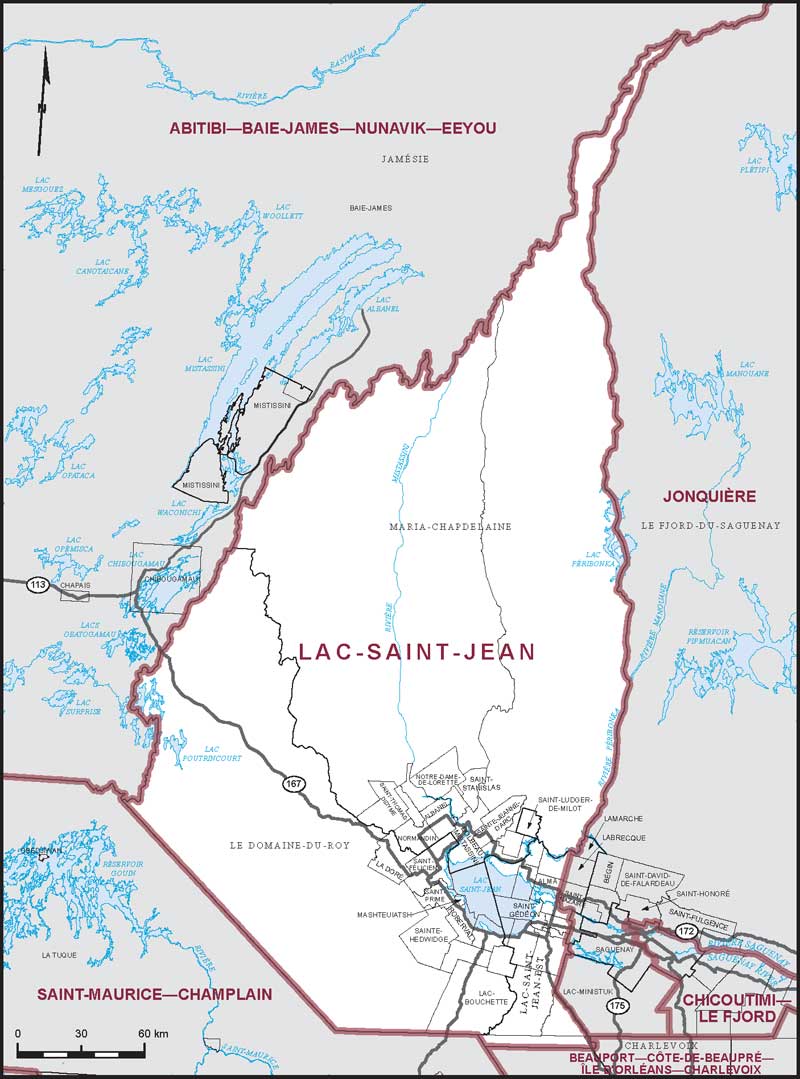
Lac-Saint-JeanProvince/Territory:
Québec-
Population:
103,886 -
Area:
55,367 km² -
Population density:
2.00/km² -
Population change:
-1% -
Average age:
46 -
Average income:
$45,480 -
Voter turnout:
61%
Language spoken most often at home:
-
English:
230 -
French:
101,810 -
Indigenous language:
135 -
Most popular other language:
-
Spanish:
95
-
-
All others:
70
-
-
Electoral District:
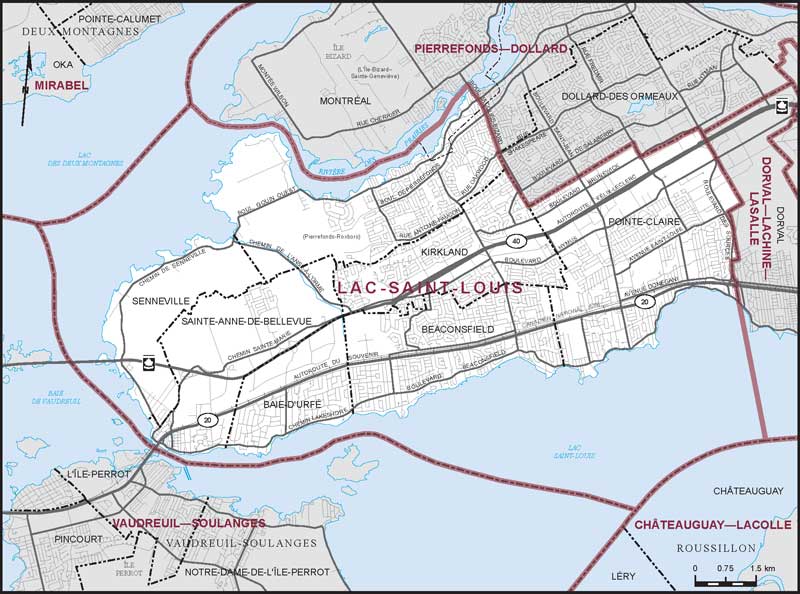
Lac-Saint-LouisProvince/Territory:
Québec-
Population:
110,093 -
Area:
78 km² -
Population density:
1,408.00/km² -
Population change:
+1.4% -
Average age:
44 -
Average income:
$66,200 -
Voter turnout:
70%
Language spoken most often at home:
-
English:
63,395 -
French:
19,295 -
Indigenous language:
15 -
Most popular other language:
-
Mandarin:
4,630
-
-
All others:
12,755
-
-
Electoral District:
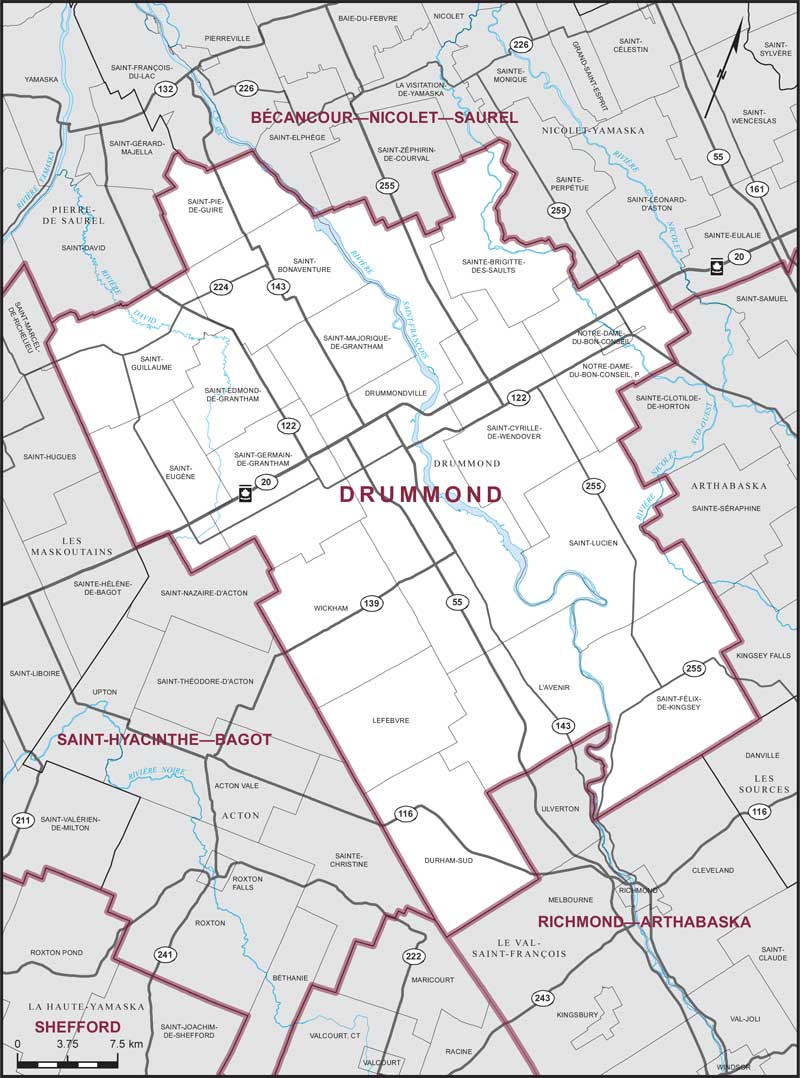
DrummondProvince/Territory:
Québec-
Population:
107,967 -
Area:
1,599 km² -
Population density:
68.00/km² -
Population change:
+4.4% -
Average age:
43 -
Average income:
$45,080 -
Voter turnout:
61%
Language spoken most often at home:
-
English:
1,055 -
French:
102,455 -
Indigenous language:
0 -
Most popular other language:
-
Spanish:
865
-
-
All others:
1,045
-
-
Electoral District:
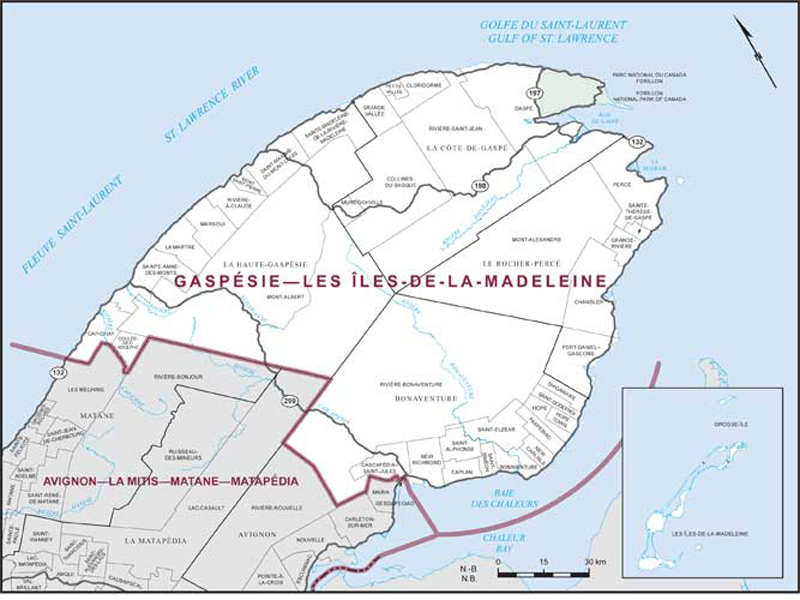
Gaspésie—Les Îles-de-la-MadeleineProvince/Territory:
Québec-
Population:
75,927 -
Area:
16,784 km² -
Population density:
5.00/km² -
Population change:
+0.1% -
Average age:
49 -
Average income:
$43,400 -
Voter turnout:
57%
Language spoken most often at home:
-
English:
5,800 -
French:
68,670 -
Indigenous language:
0 -
Most popular other language:
-
Spanish:
80
-
-
All others:
110
-
-
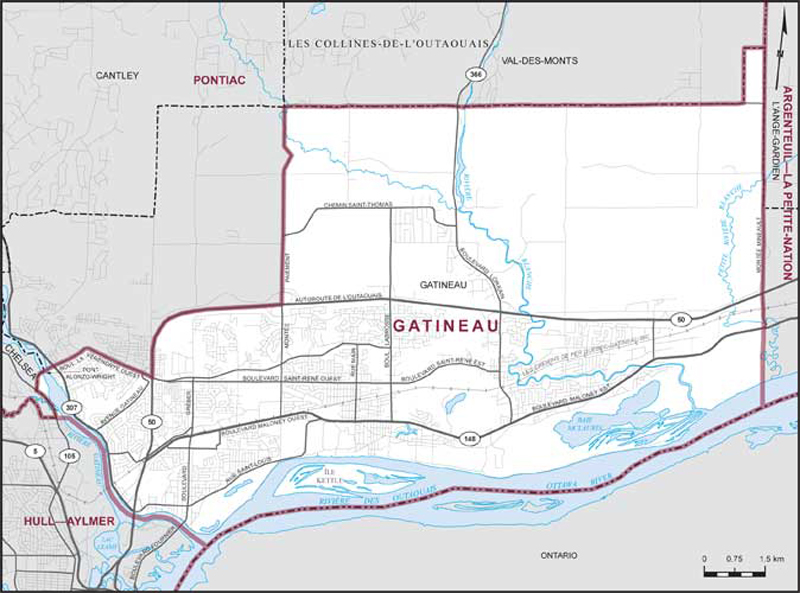
Electoral District:
GatineauProvince/Territory:
Québec-
Population:
107,286 -
Area:
119 km² -
Population density:
903.00/km² -
Population change:
-0.2% -
Average age:
42 -
Average income:
$51,550 -
Voter turnout:
64%
Language spoken most often at home:
-
English:
9,315 -
French:
87,455 -
Indigenous language:
0 -
Most popular other language:
-
Arabic:
1,540
-
-
All others:
3,225
-
-
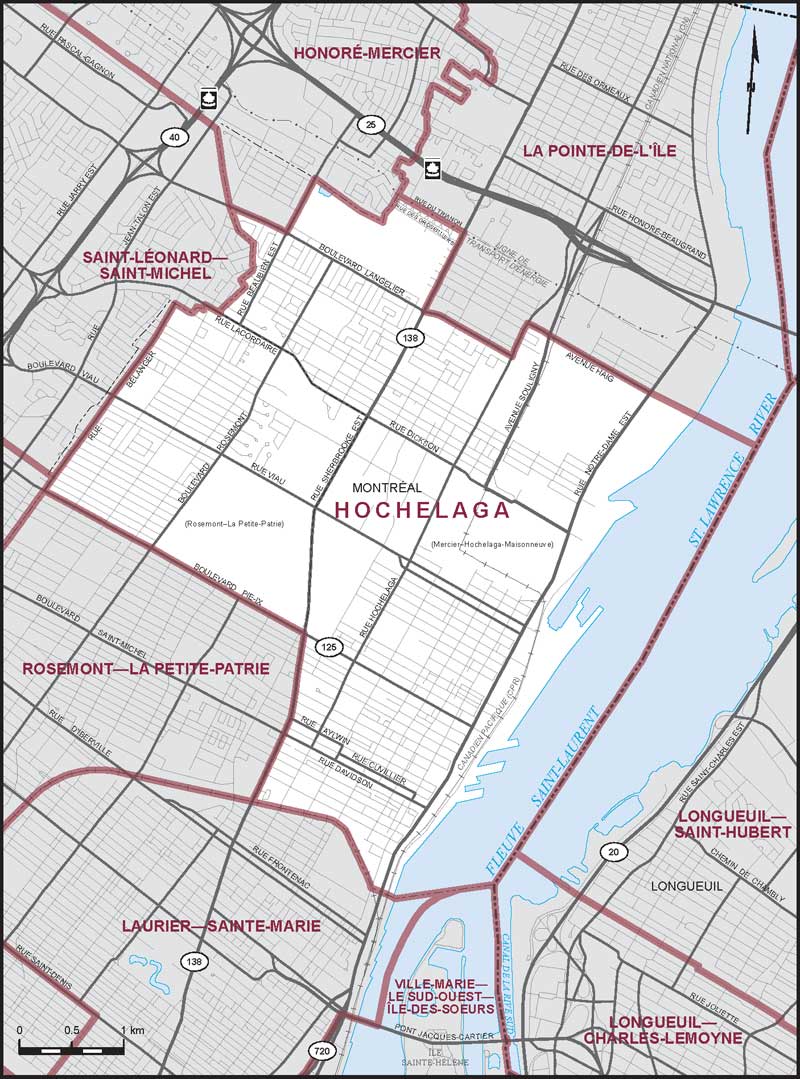
Electoral District:
HochelagaProvince/Territory:
Québec-
Population:
108,264 -
Area:
20 km² -
Population density:
5,532.00/km² -
Population change:
+1.7% -
Average age:
41 -
Average income:
$46,720 -
Voter turnout:
62%
Language spoken most often at home:
-
English:
6,860 -
French:
81,680 -
Indigenous language:
10 -
Most popular other language:
-
Spanish:
2,950
-
-
All others:
8,515
-
-
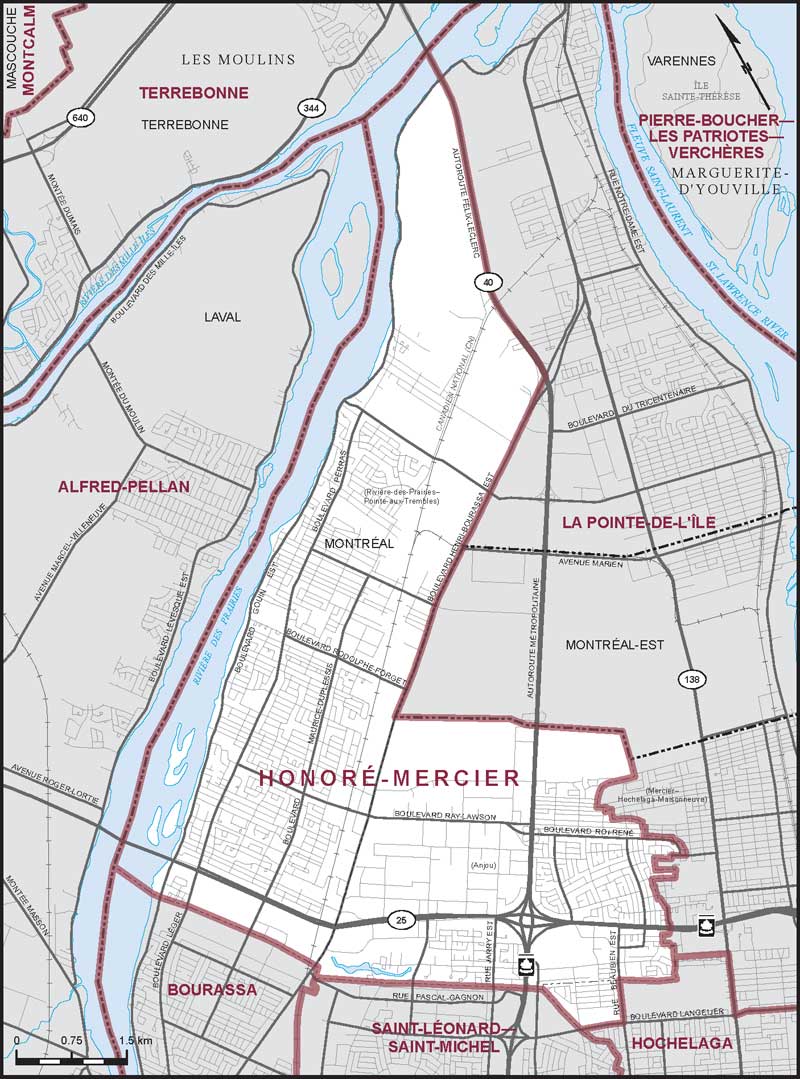
Electoral District:
Honoré-MercierProvince/Territory:
Québec-
Population:
104,578 -
Area:
38 km² -
Population density:
2,773.00/km² -
Population change:
+1% -
Average age:
43 -
Average income:
$46,240 -
Voter turnout:
64%
Language spoken most often at home:
-
English:
19,395 -
French:
56,240 -
Indigenous language:
0 -
Most popular other language:
-
Italian:
3,975
-
-
All others:
13,700
-
-
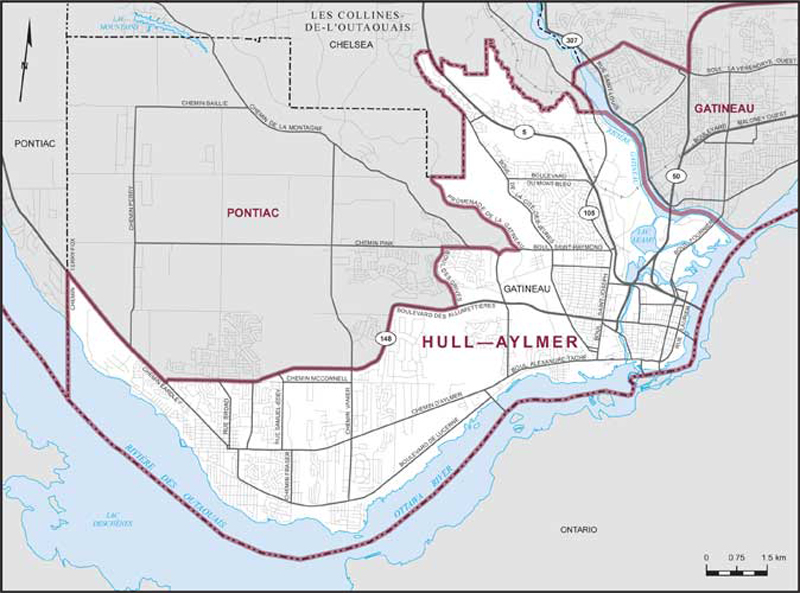
Electoral District:
Hull—AylmerProvince/Territory:
Québec-
Population:
110,881 -
Area:
62 km² -
Population density:
1,776.00/km² -
Population change:
+5.2% -
Average age:
41 -
Average income:
$55,200 -
Voter turnout:
67%
Language spoken most often at home:
-
English:
25,595 -
French:
65,855 -
Indigenous language:
20 -
Most popular other language:
-
Arabic:
1,940
-
-
All others:
7,075
-
-
Electoral District:
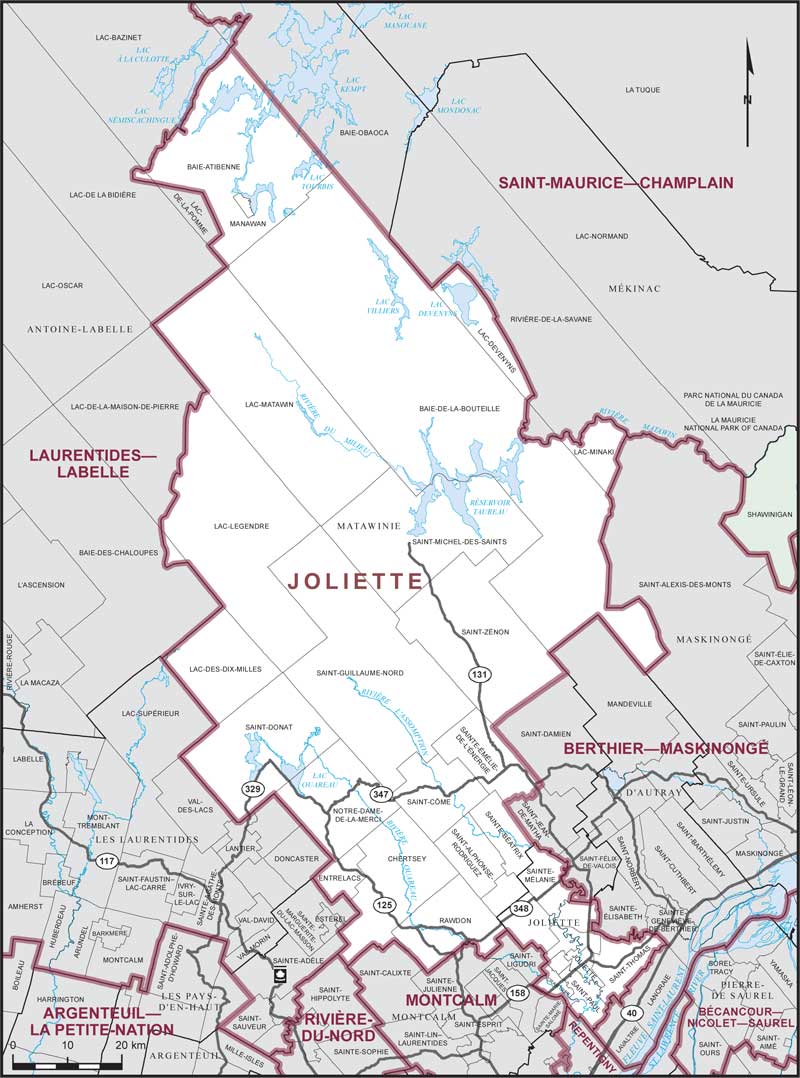
JolietteProvince/Territory:
Québec-
Population:
112,418 -
Area:
8,124 km² -
Population density:
14.00/km² -
Population change:
+8% -
Average age:
47 -
Average income:
$45,280 -
Voter turnout:
62%
Language spoken most often at home:
-
English:
2,210 -
French:
104,825 -
Indigenous language:
1,755 -
Most popular other language:
-
Spanish:
405
-
-
All others:
775
-
-
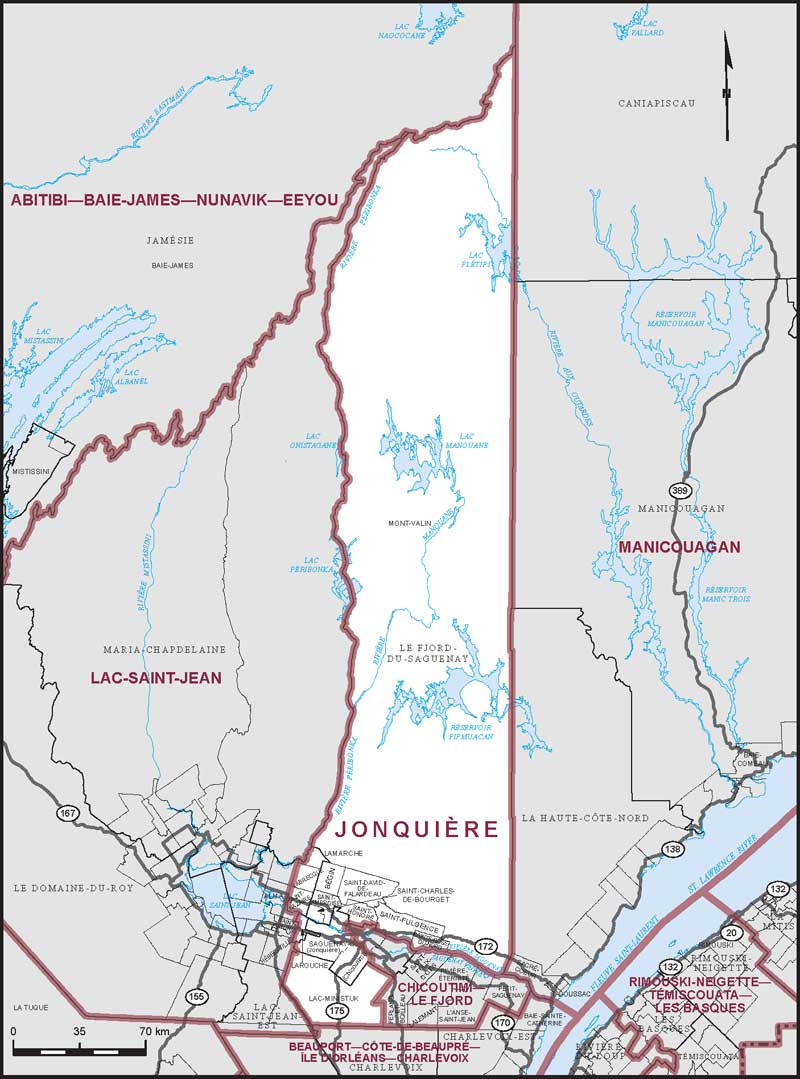
Electoral District:
JonquièreProvince/Territory:
Québec-
Population:
91,073 -
Area:
37,642 km² -
Population density:
2.00/km² -
Population change:
+1.4% -
Average age:
44 -
Average income:
$49,200 -
Voter turnout:
63%
Language spoken most often at home:
-
English:
415 -
French:
89,245 -
Indigenous language:
10 -
Most popular other language:
-
Spanish:
70
-
-
All others:
100
-
-
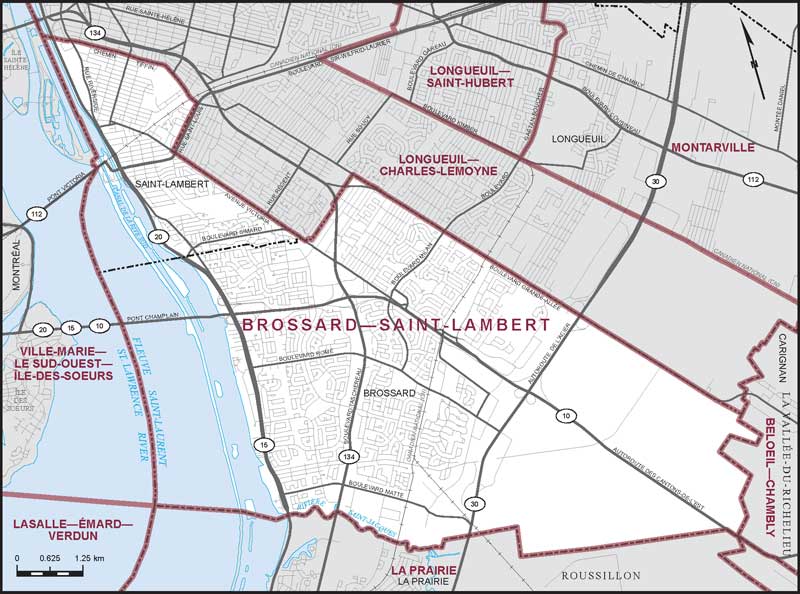
Electoral District:
Brossard—Saint-LambertProvince/Territory:
Québec-
Population:
114,286 -
Area:
53 km² -
Population density:
2,166.00/km² -
Population change:
+6.2% -
Average age:
44 -
Average income:
$60,200 -
Voter turnout:
64%
Language spoken most often at home:
-
English:
19,590 -
French:
55,410 -
Indigenous language:
0 -
Most popular other language:
-
Mandarin & Yue (Cantonese):
9,730
-
-
All others:
17,765
-
-
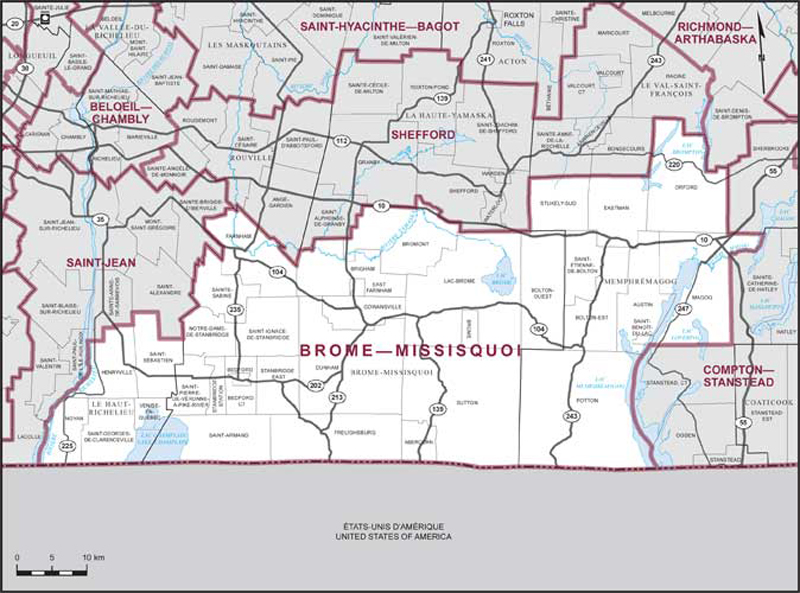
Electoral District:
Brome—MissisquoiProvince/Territory:
Québec-
Population:
113,913 -
Area:
2,779 km² -
Population density:
41.00/km² -
Population change:
+10.1% -
Average age:
48 -
Average income:
$52,800 -
Voter turnout:
66%
Language spoken most often at home:
-
English:
14,710 -
French:
93,990 -
Indigenous language:
0 -
Most popular other language:
-
Spanish:
295
-
-
All others:
525
-
-
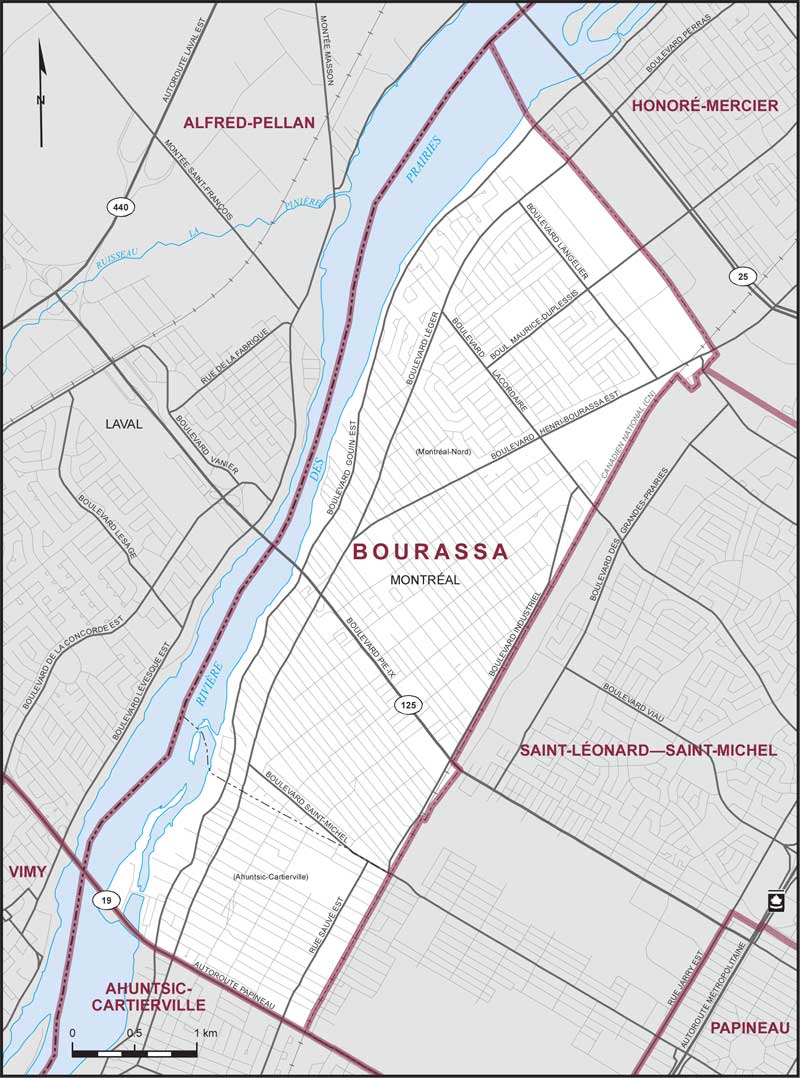
Electoral District:
BourassaProvince/Territory:
Québec-
Population:
105,637 -
Area:
14 km² -
Population density:
7,803.00/km² -
Population change:
+4.6% -
Average age:
41 -
Average income:
$38,960 -
Voter turnout:
56%
Language spoken most often at home:
-
English:
8,235 -
French:
62,260 -
Indigenous language:
0 -
Most popular other language:
-
Haitian Creole & Creole:
5,690
-
-
All others:
17,985
-
-
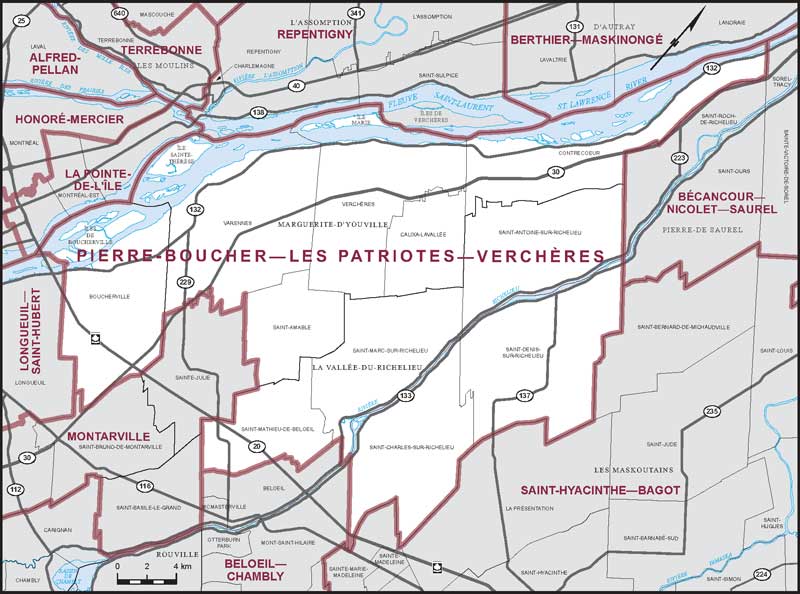
Electoral District:
Pierre-Boucher—Les Patriotes—VerchèresProvince/Territory:
Québec-
Population:
103,020 -
Area:
685 km² -
Population density:
150.00/km² -
Population change:
+3.2% -
Average age:
42 -
Average income:
$62,750 -
Voter turnout:
69%
Language spoken most often at home:
-
English:
2,060 -
French:
96,245 -
Indigenous language:
0 -
Most popular other language:
-
Spanish:
745
-
-
All others:
1,365
-
-
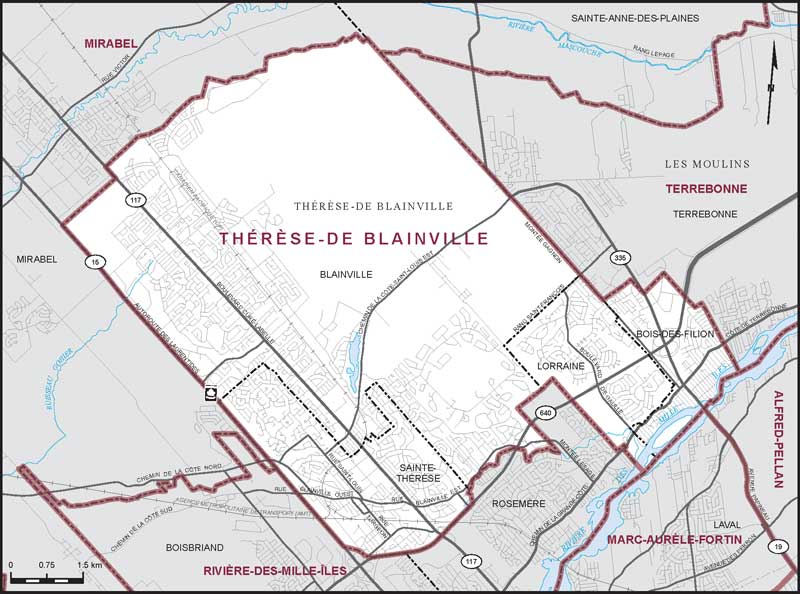
Electoral District:
Thérèse-De BlainvilleProvince/Territory:
Québec-
Population:
106,013 -
Area:
75 km² -
Population density:
1,419.00/km² -
Population change:
+4.1% -
Average age:
42 -
Average income:
$59,550 -
Voter turnout:
64%
Language spoken most often at home:
-
English:
5,950 -
French:
90,185 -
Indigenous language:
0 -
Most popular other language:
-
Spanish:
1,015
-
-
All others:
3,390
-
-
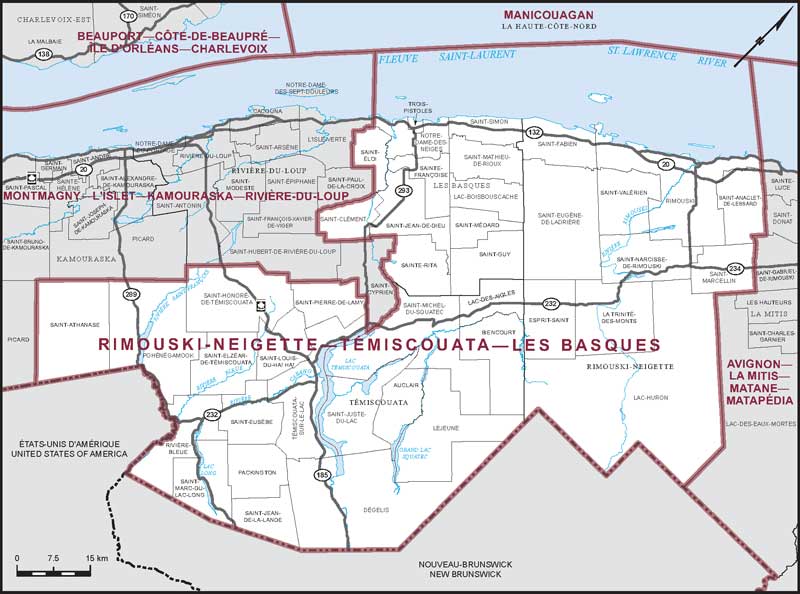
Electoral District:
Rimouski-Neigette—Témiscouata—Les BasquesProvince/Territory:
Québec-
Population:
85,556 -
Area:
7,724 km² -
Population density:
11.00/km² -
Population change:
+0.8% -
Average age:
47 -
Average income:
$45,160 -
Voter turnout:
61%
Language spoken most often at home:
-
English:
355 -
French:
83,740 -
Indigenous language:
0 -
Most popular other language:
-
Spanish:
120
-
-
All others:
260
-