Federal Electoral District Fact Sheets
-
Electoral District:
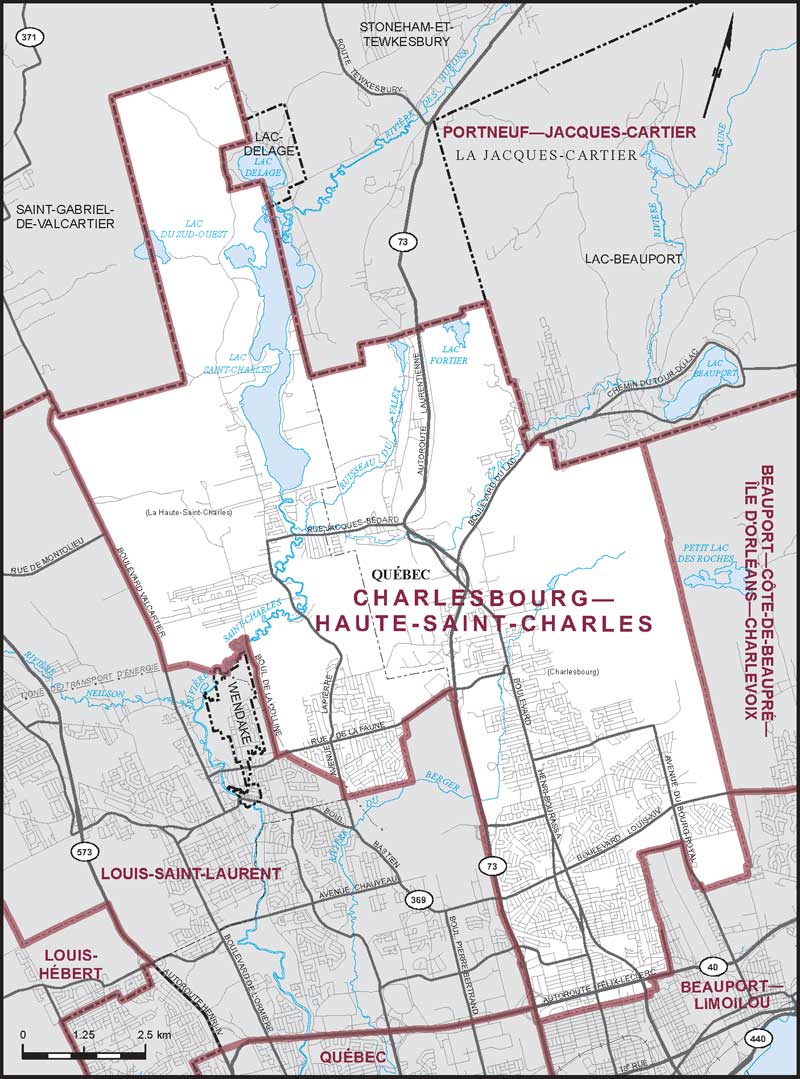
Charlesbourg—Haute-Saint-CharlesProvince/Territory:
Québec-
Population:
109,690 -
Area:
111 km² -
Population density:
986.00/km² -
Population change:
+2.3% -
Average age:
43 -
Average income:
$51,250 -
Voter turnout:
69%
Language spoken most often at home:
-
English:
875 -
French:
104,110 -
Indigenous language:
20 -
Most popular other language:
-
Spanish:
665
-
-
All others:
1,440
-
-
Electoral District:
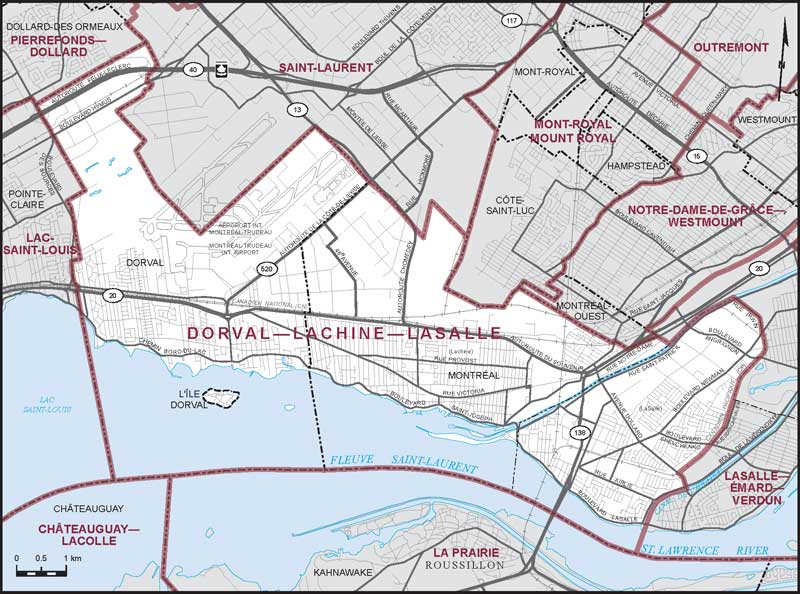
Dorval—Lachine—LaSalleProvince/Territory:
Québec-
Population:
119,395 -
Area:
50 km² -
Population density:
2,402.00/km² -
Population change:
+5.8% -
Average age:
42 -
Average income:
$47,440 -
Voter turnout:
59%
Language spoken most often at home:
-
English:
42,450 -
French:
44,140 -
Indigenous language:
40 -
Most popular other language:
-
Mandarin:
3,495
-
-
All others:
18,290
-
-
Electoral District:
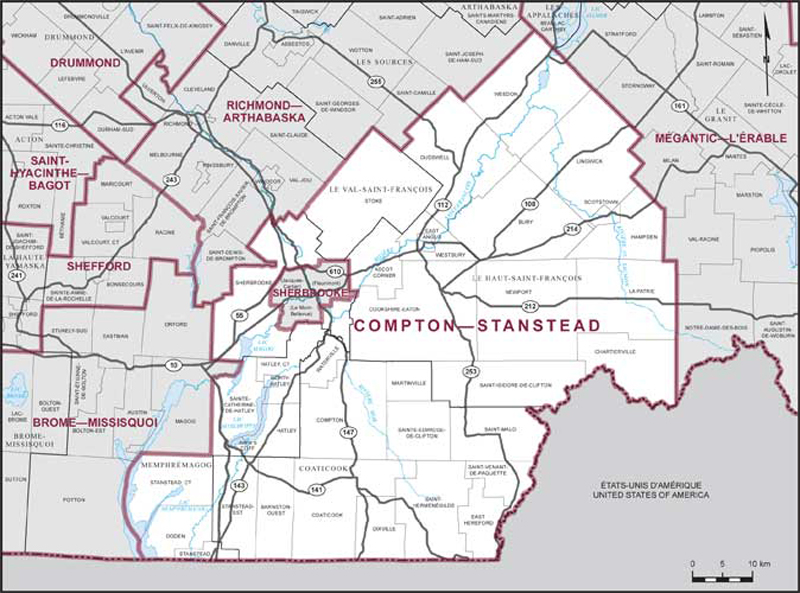
Compton—StansteadProvince/Territory:
Québec-
Population:
111,088 -
Area:
4,555 km² -
Population density:
24.00/km² -
Population change:
+5.3% -
Average age:
42 -
Average income:
$49,040 -
Voter turnout:
67%
Language spoken most often at home:
-
English:
11,670 -
French:
95,365 -
Indigenous language:
0 -
Most popular other language:
-
Spanish:
610
-
-
All others:
675
-
-
Electoral District:
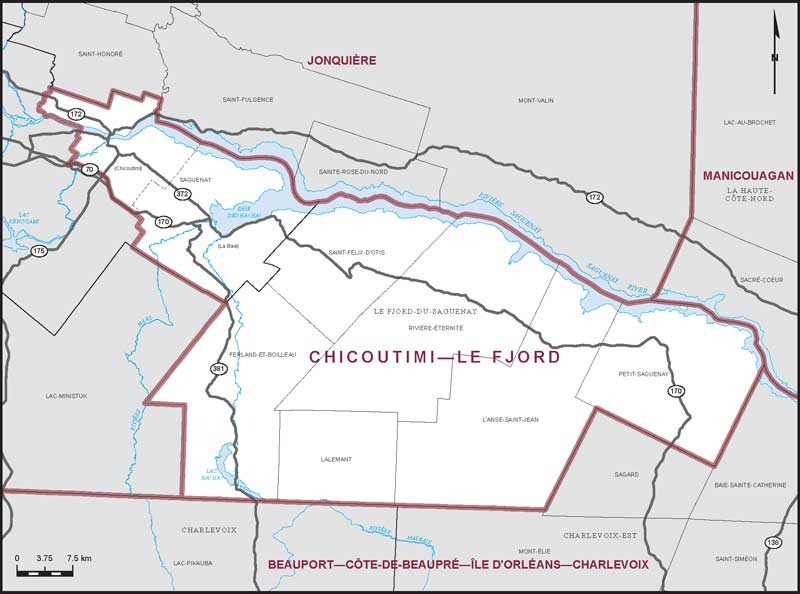
Chicoutimi—Le FjordProvince/Territory:
Québec-
Population:
80,593 -
Area:
2,535 km² -
Population density:
32.00/km² -
Population change:
-1.3% -
Average age:
46 -
Average income:
$48,400 -
Voter turnout:
65%
Language spoken most often at home:
-
English:
630 -
French:
78,405 -
Indigenous language:
55 -
Most popular other language:
-
Spanish:
130
-
-
All others:
345
-
-
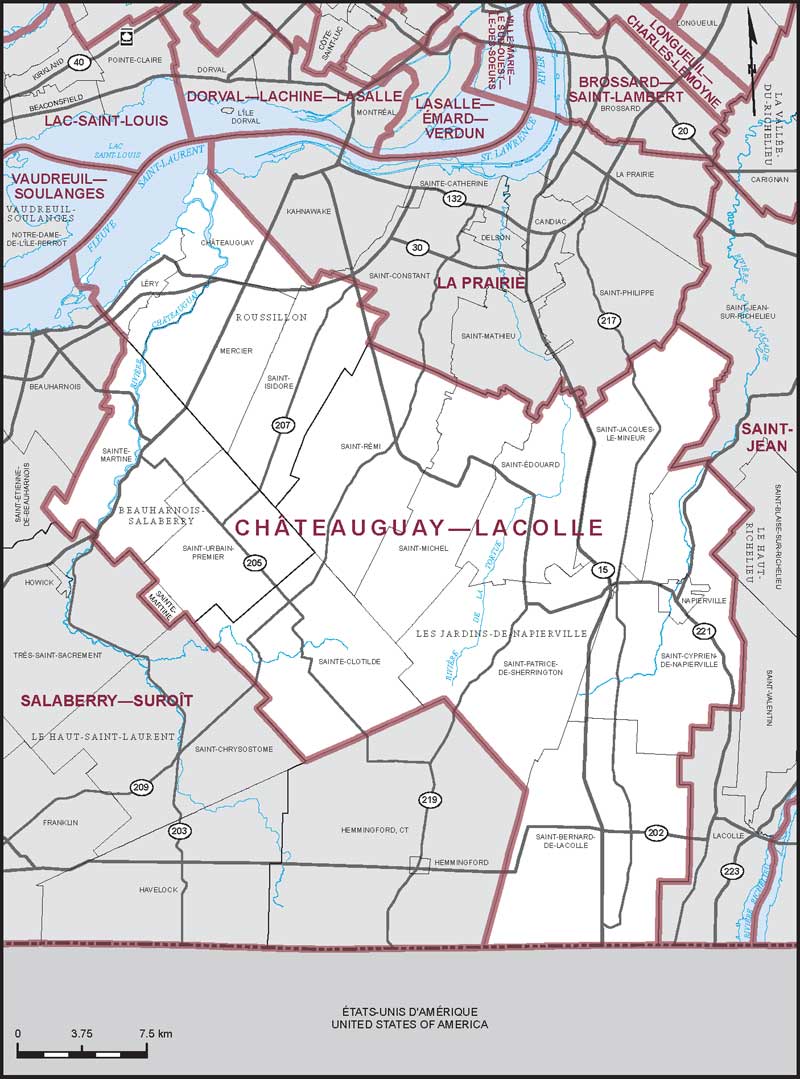
Electoral District:
Châteauguay—LacolleProvince/Territory:
Québec-
Population:
105,111 -
Area:
904 km² -
Population density:
116.00/km² -
Population change:
+7.4% -
Average age:
41 -
Average income:
$48,840 -
Voter turnout:
62%
Language spoken most often at home:
-
English:
17,590 -
French:
77,220 -
Indigenous language:
5 -
Most popular other language:
-
Spanish:
1,455
-
-
All others:
4,305
-
-
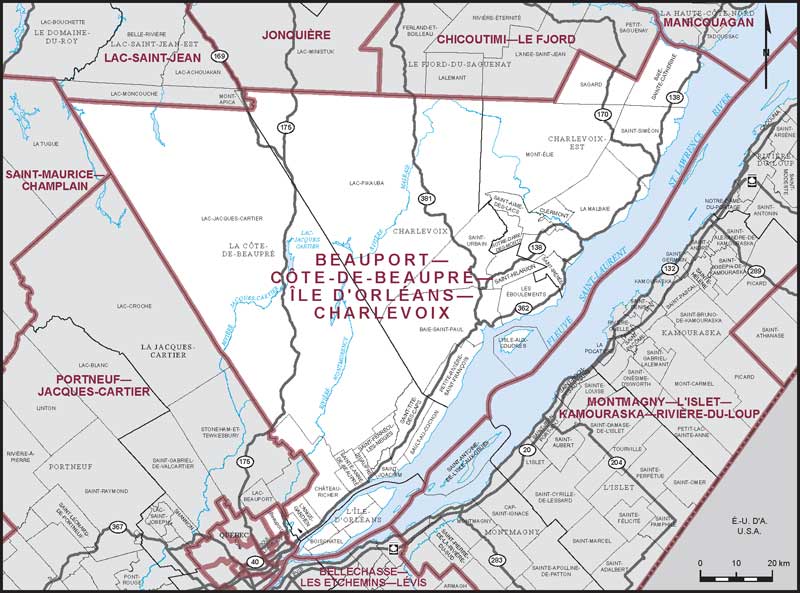
Electoral District:
Beauport—Côte-de-Beaupré—Île d'Orléans—CharlevoixProvince/Territory:
Québec-
Population:
95,736 -
Area:
11,116 km² -
Population density:
9.00/km² -
Population change:
+2.2% -
Average age:
45 -
Average income:
$50,840 -
Voter turnout:
66%
Language spoken most often at home:
-
English:
530 -
French:
92,540 -
Indigenous language:
5 -
Most popular other language:
-
Spanish:
170
-
-
All others:
370
-
-
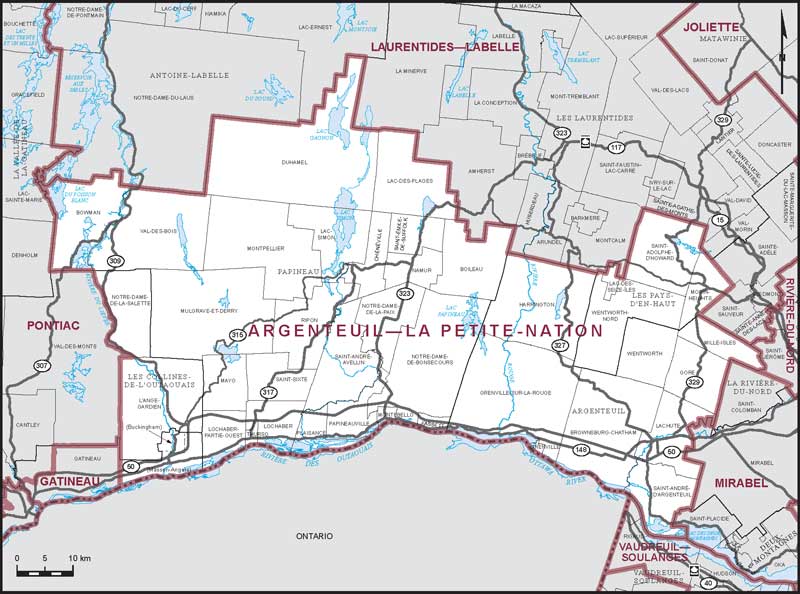
Electoral District:
Argenteuil—La Petite-NationProvince/Territory:
Québec-
Population:
102,311 -
Area:
4,890 km² -
Population density:
21.00/km² -
Population change:
+6.8% -
Average age:
45 -
Average income:
$47,040 -
Voter turnout:
61%
Language spoken most often at home:
-
English:
10,705 -
French:
88,075 -
Indigenous language:
0 -
Most popular other language:
-
Spanish:
155
-
-
All others:
495
-
-
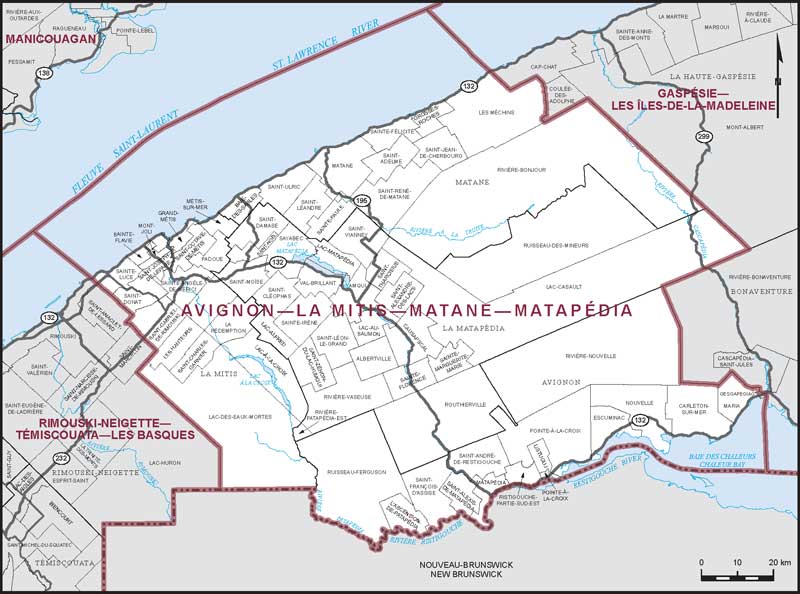
Electoral District:
Avignon—La Mitis--Matane—MatapédiaProvince/Territory:
Québec-
Population:
70,253 -
Area:
14,433 km² -
Population density:
5.00/km² -
Population change:
-2.3% -
Average age:
48 -
Average income:
$42,160 -
Voter turnout:
57%
Language spoken most often at home:
-
English:
1,415 -
French:
67,315 -
Indigenous language:
70 -
Most popular other language:
-
Spanish:
35
-
-
All others:
35
-
-
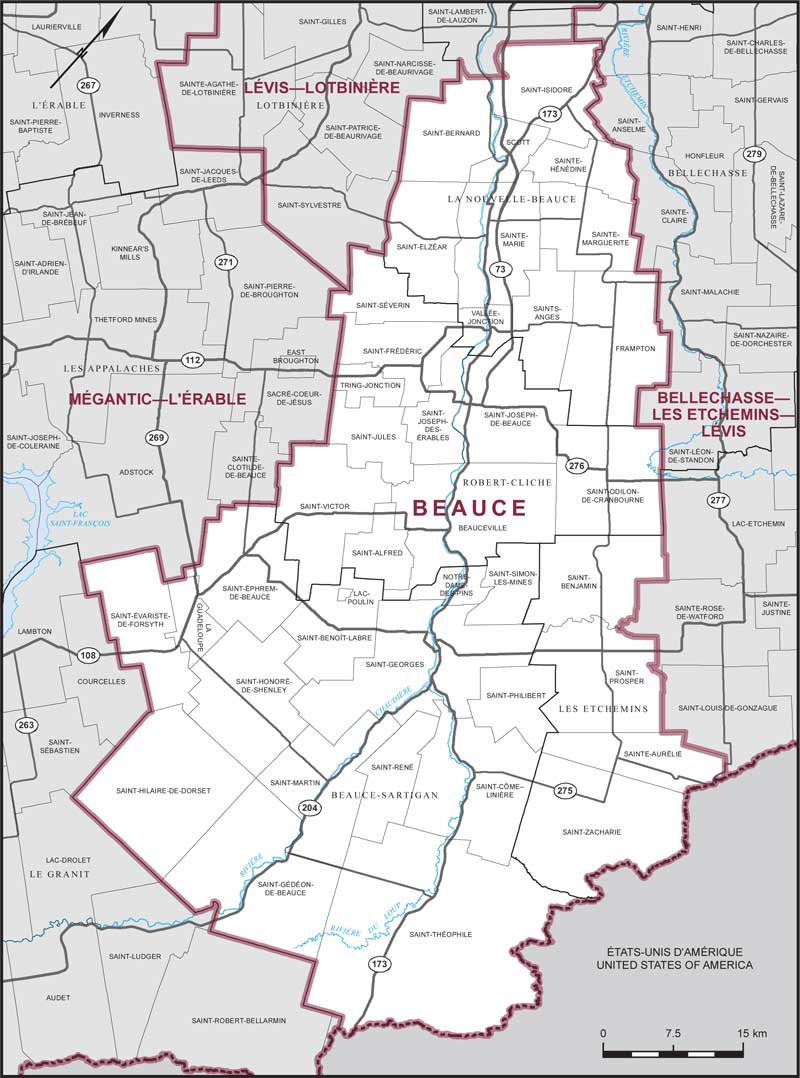
Electoral District:
BeauceProvince/Territory:
Québec-
Population:
111,034 -
Area:
4,101 km² -
Population density:
27.00/km² -
Population change:
+2.1% -
Average age:
43 -
Average income:
$46,120 -
Voter turnout:
67%
Language spoken most often at home:
-
English:
510 -
French:
107,515 -
Indigenous language:
0 -
Most popular other language:
-
Spanish:
680
-
-
All others:
315
-
-
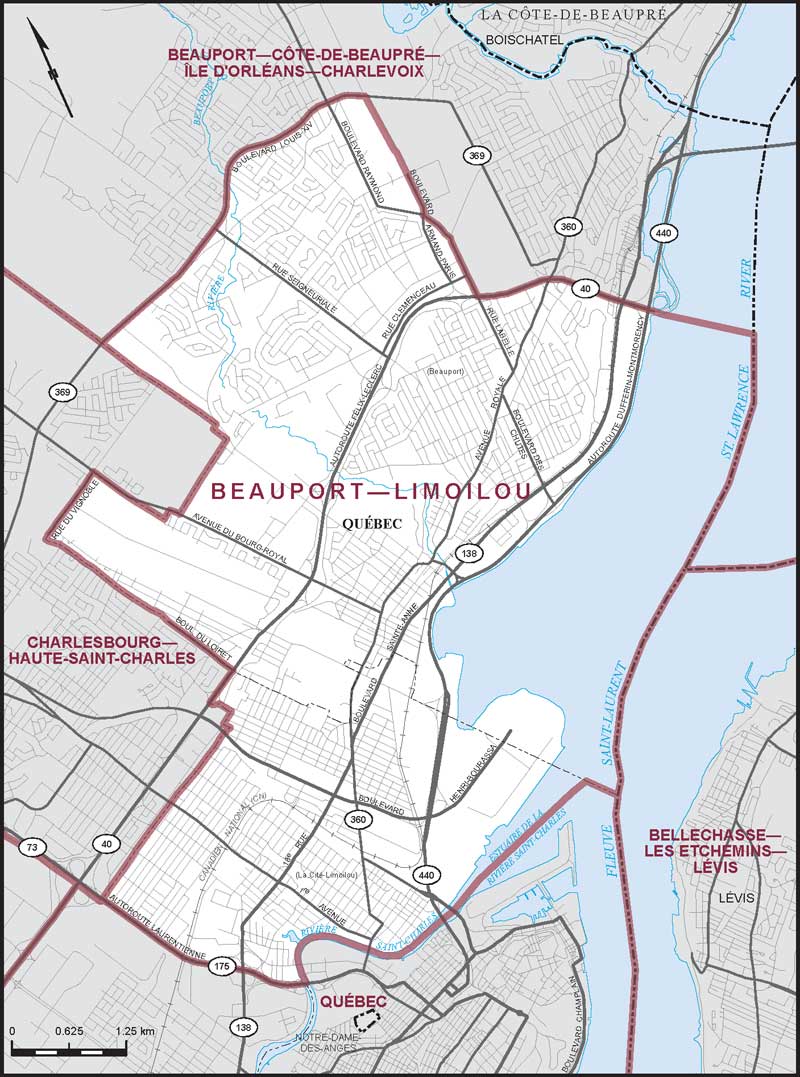
Electoral District:
Beauport—LimoilouProvince/Territory:
Québec-
Population:
96,064 -
Area:
33 km² -
Population density:
2,881.00/km² -
Population change:
0% -
Average age:
44 -
Average income:
$45,560 -
Voter turnout:
65%
Language spoken most often at home:
-
English:
860 -
French:
88,920 -
Indigenous language:
30 -
Most popular other language:
-
Spanish:
755
-
-
All others:
2,155
-
-
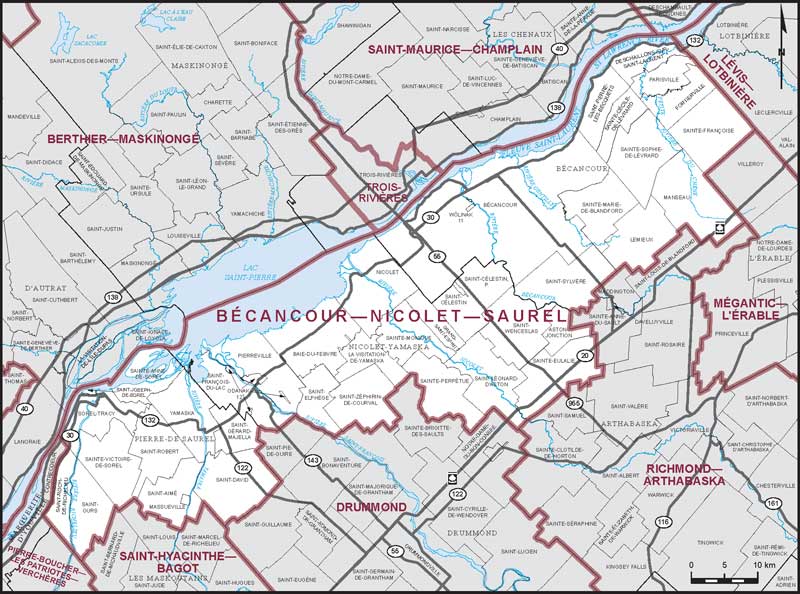
Electoral District:
Bécancour—Nicolet—SaurelProvince/Territory:
Québec-
Population:
96,439 -
Area:
2,743 km² -
Population density:
35.00/km² -
Population change:
+2% -
Average age:
47 -
Average income:
$45,320 -
Voter turnout:
63%
Language spoken most often at home:
-
English:
640 -
French:
92,730 -
Indigenous language:
0 -
Most popular other language:
-
Spanish:
230
-
-
All others:
350
-
-
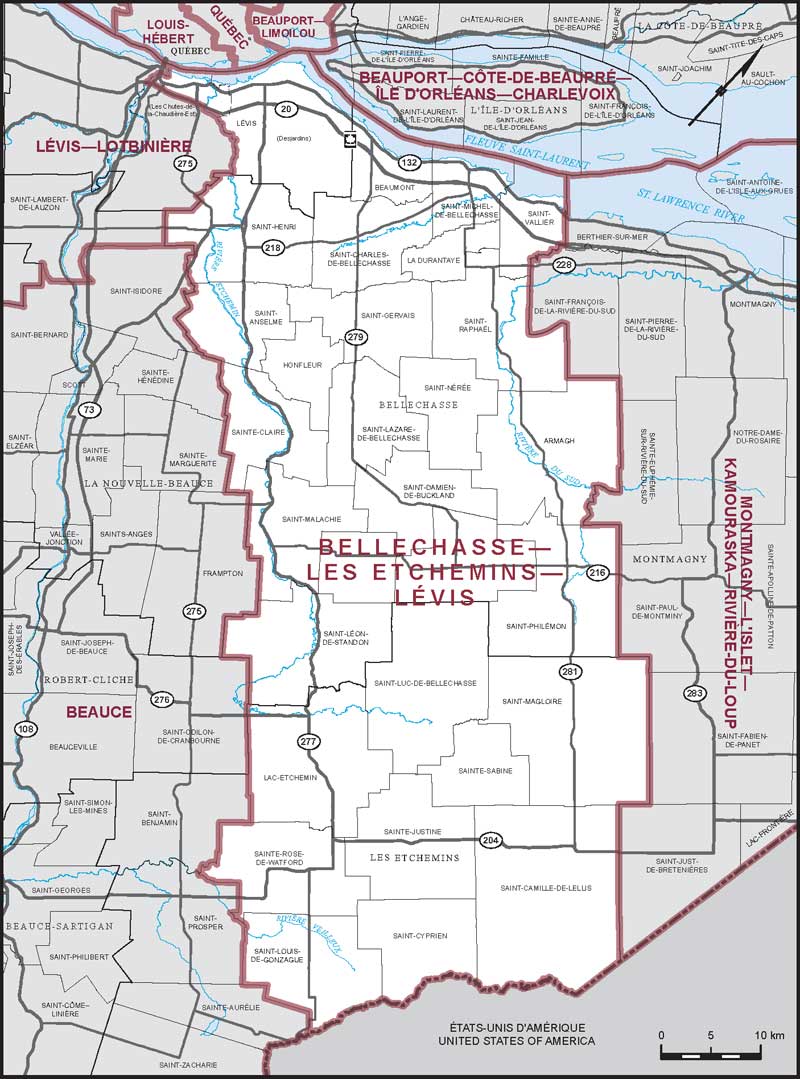
Electoral District:
Bellechasse—Les Etchemins—LévisProvince/Territory:
Québec-
Population:
120,179 -
Area:
3,201 km² -
Population density:
38.00/km² -
Population change:
+4.5% -
Average age:
45 -
Average income:
$49,520 -
Voter turnout:
67%
Language spoken most often at home:
-
English:
795 -
French:
114,850 -
Indigenous language:
0 -
Most popular other language:
-
Spanish:
505
-
-
All others:
760
-
-
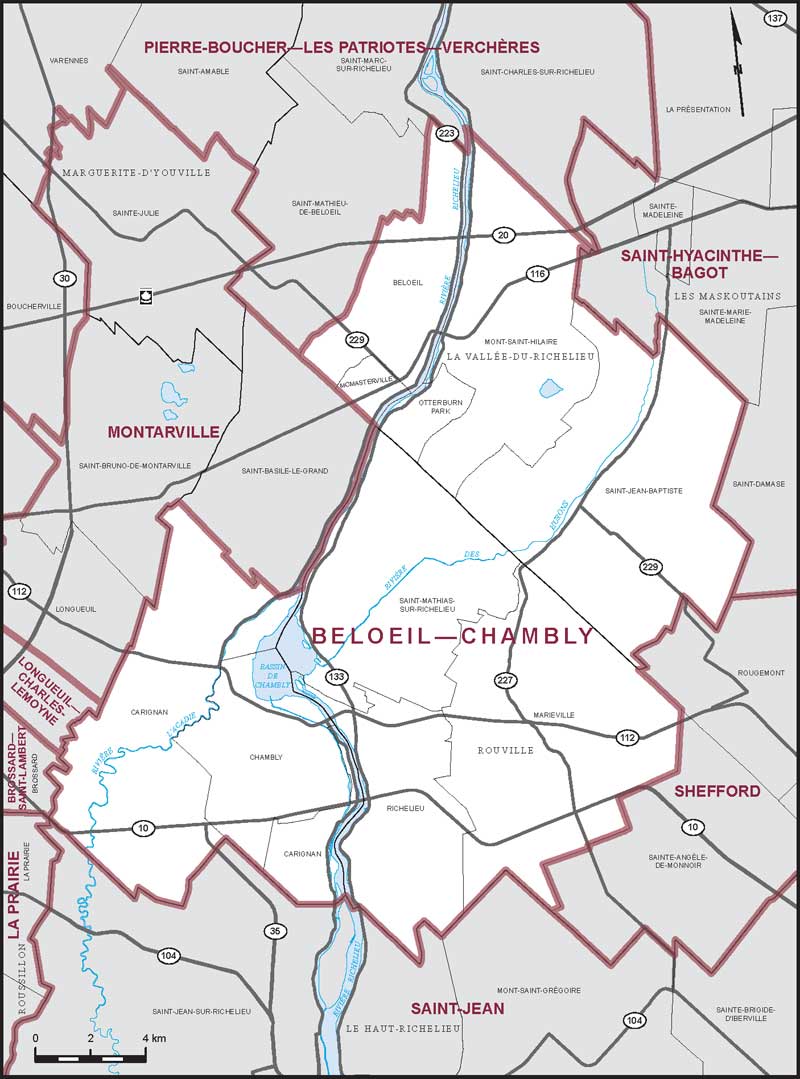
Electoral District:
Beloeil—ChamblyProvince/Territory:
Québec-
Population:
125,359 -
Area:
378 km² -
Population density:
332.00/km² -
Population change:
+6.8% -
Average age:
41 -
Average income:
$59,350 -
Voter turnout:
69%
Language spoken most often at home:
-
English:
4,555 -
French:
114,450 -
Indigenous language:
0 -
Most popular other language:
-
Spanish:
830
-
-
All others:
1,795
-
-
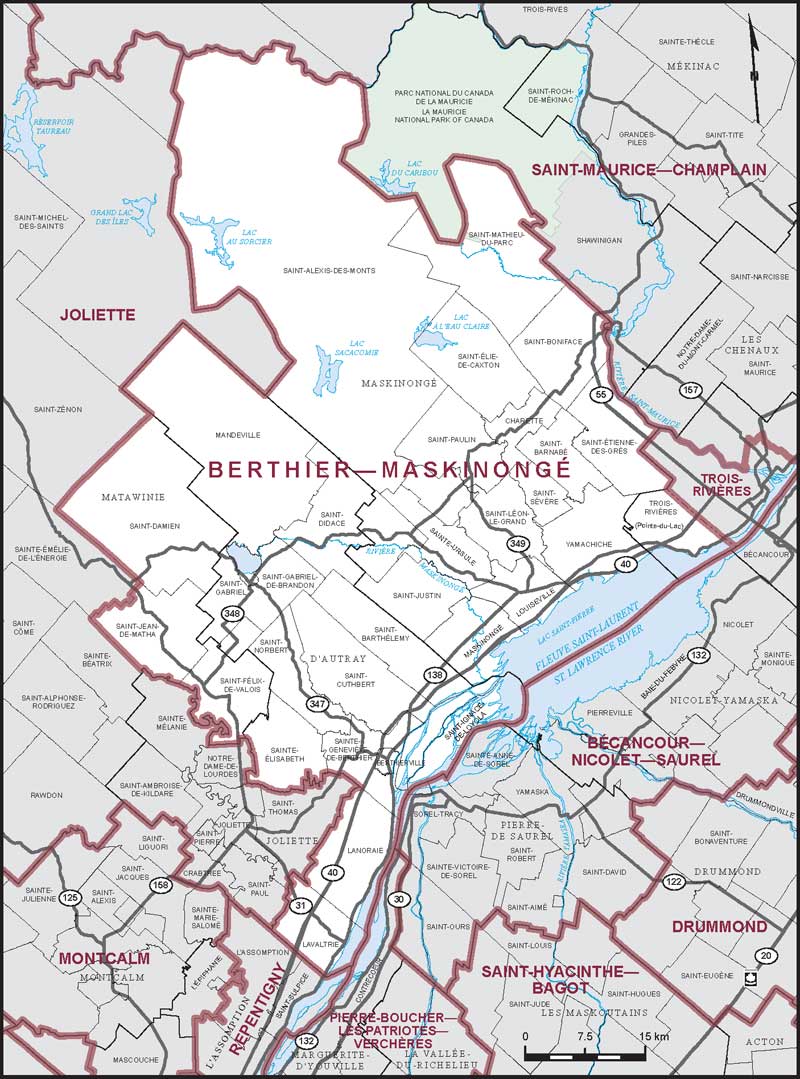
Electoral District:
Berthier—MaskinongéProvince/Territory:
Québec-
Population:
105,280 -
Area:
4,115 km² -
Population density:
26.00/km² -
Population change:
+4.9% -
Average age:
46 -
Average income:
$44,280 -
Voter turnout:
65%
Language spoken most often at home:
-
English:
810 -
French:
102,080 -
Indigenous language:
0 -
Most popular other language:
-
Spanish:
260
-
-
All others:
270
-
-
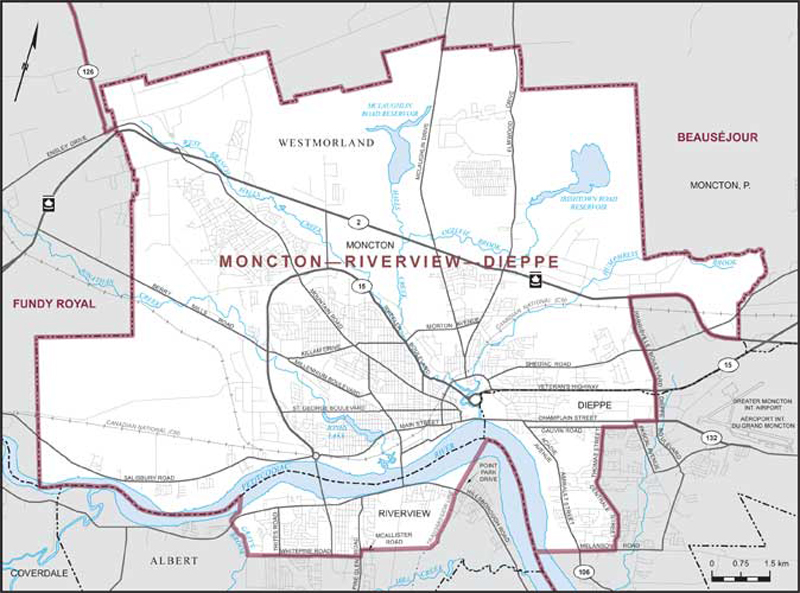
Electoral District:
Moncton—Riverview—DieppeProvince/Territory:
New Brunswick-
Population:
101,237 -
Area:
155 km² -
Population density:
655.00/km² -
Population change:
+9.2% -
Average age:
42 -
Average income:
$46,120 -
Voter turnout:
62%
Language spoken most often at home:
-
English:
67,080 -
French:
22,465 -
Indigenous language:
0 -
Most popular other language:
-
Arabic:
895
-
-
All others:
4,895
-
-
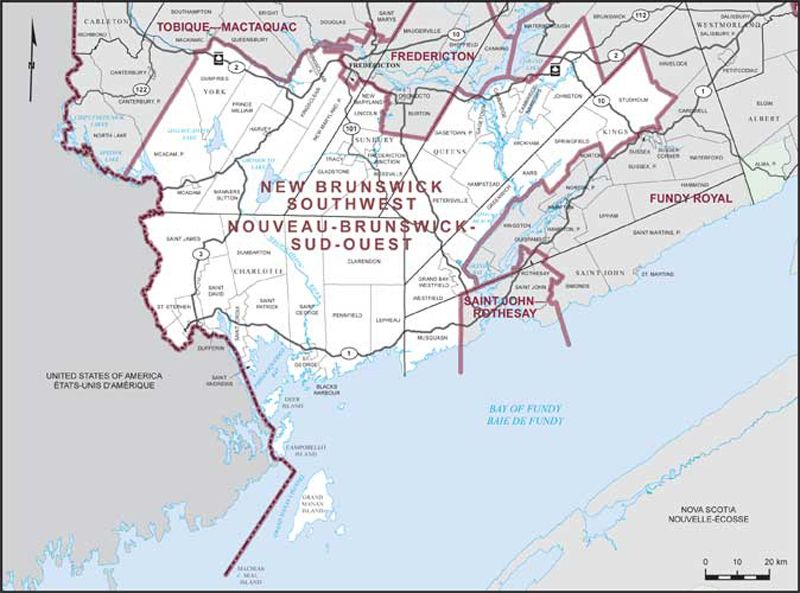
Electoral District:
New Brunswick SouthwestProvince/Territory:
New Brunswick-
Population:
67,781 -
Area:
9,886 km² -
Population density:
7.00/km² -
Population change:
+3.8% -
Average age:
45 -
Average income:
$47,240 -
Voter turnout:
67%
Language spoken most often at home:
-
English:
64,855 -
French:
1,140 -
Indigenous language:
10 -
Most popular other language:
-
Tagalog (Pilipino, Filipino):
135
-
-
All others:
510
-