Federal Electoral District Fact Sheets
-
Electoral District:
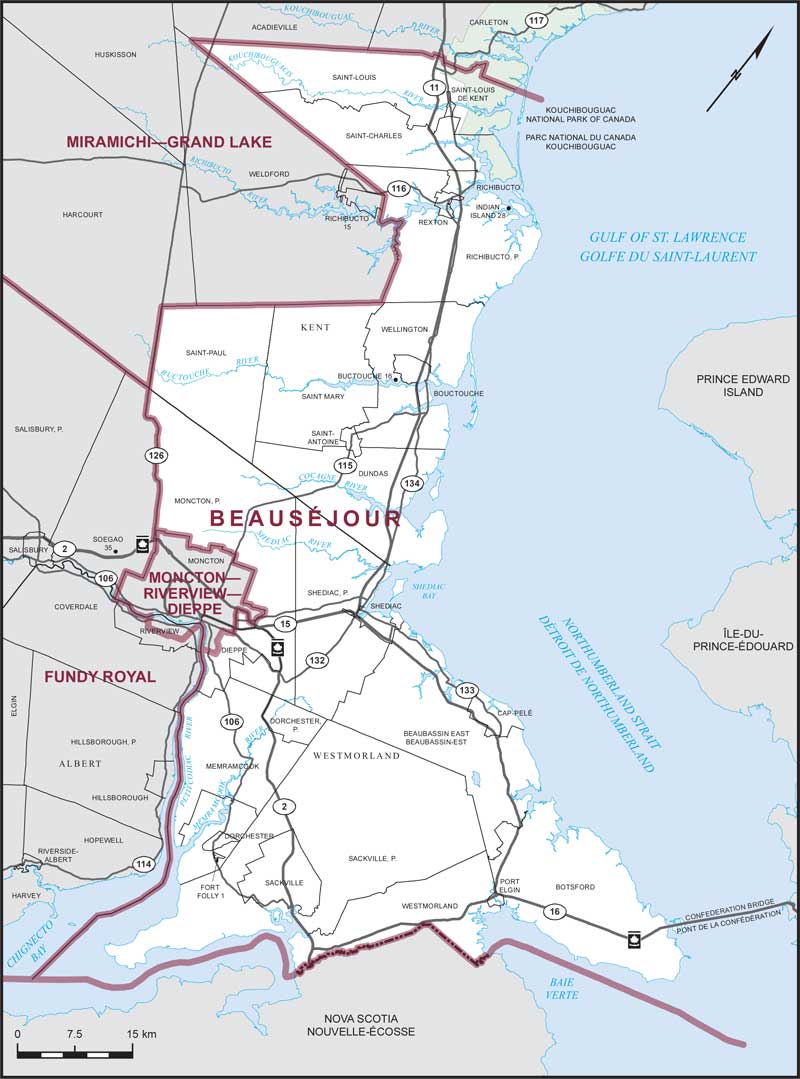
BeauséjourProvince/Territory:
New Brunswick-
Population:
88,797 -
Area:
3,992 km² -
Population density:
22.00/km² -
Population change:
+7.9% -
Average age:
46 -
Average income:
$47,840 -
Voter turnout:
68%
Language spoken most often at home:
-
English:
35,905 -
French:
47,475 -
Indigenous language:
20 -
Most popular other language:
-
Tagalog (Pilipino, Filipino):
370
-
-
All others:
1,225
-
-
Electoral District:
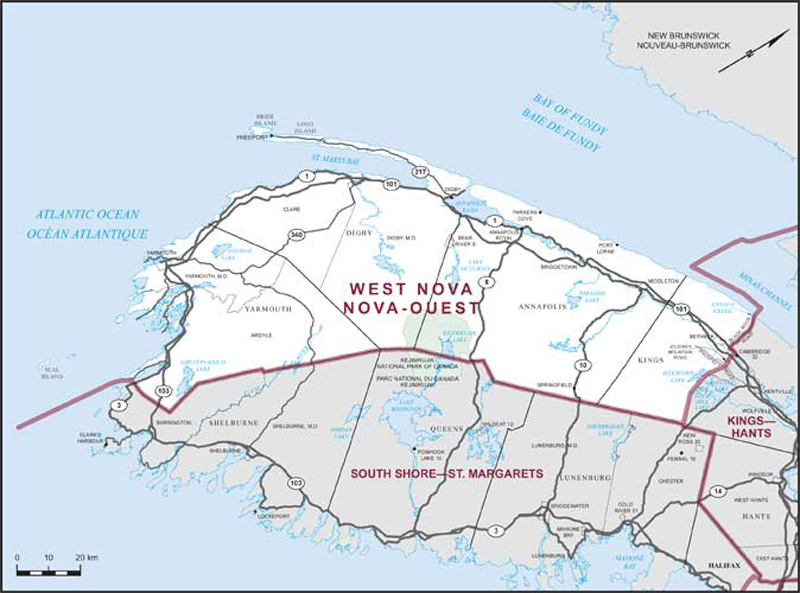
West NovaProvince/Territory:
Nova Scotia-
Population:
83,571 -
Area:
8,869 km² -
Population density:
9.00/km² -
Population change:
+1.9% -
Average age:
47 -
Average income:
$40,360 -
Voter turnout:
62%
Language spoken most often at home:
-
English:
74,365 -
French:
6,435 -
Indigenous language:
5 -
Most popular other language:
-
German:
95
-
-
All others:
630
-
-
Electoral District:
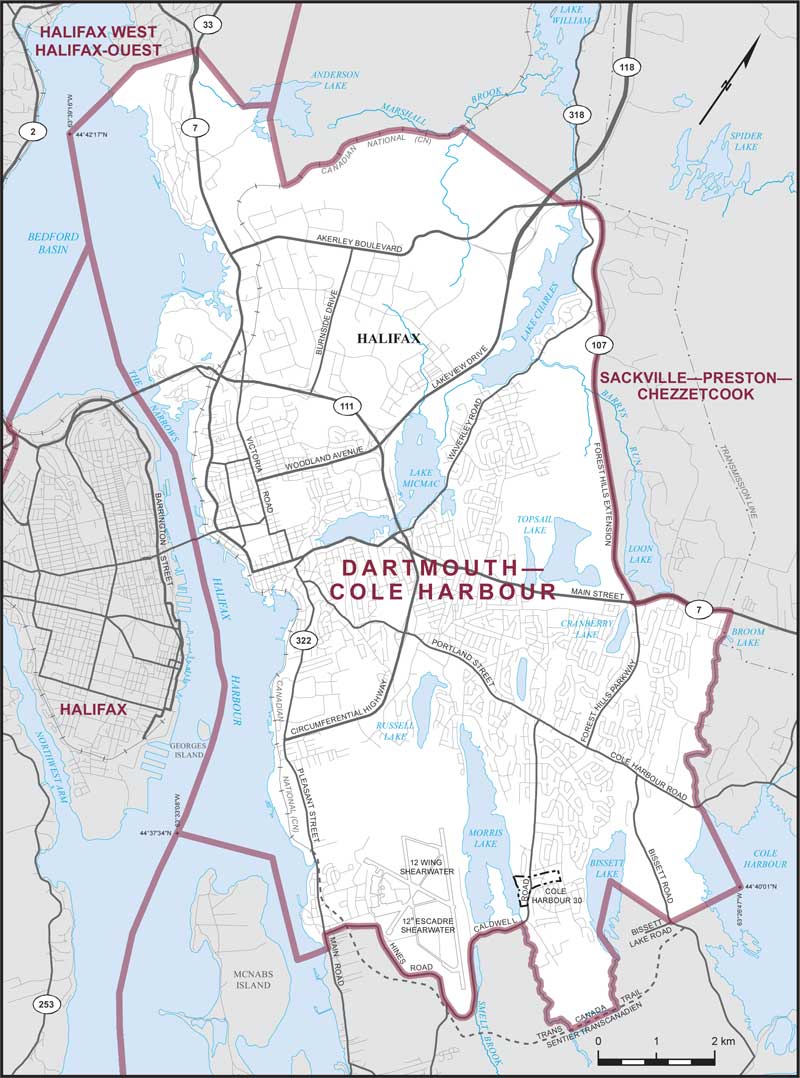
Dartmouth—Cole HarbourProvince/Territory:
Nova Scotia-
Population:
96,165 -
Area:
90 km² -
Population density:
1,067.00/km² -
Population change:
+4.2% -
Average age:
43 -
Average income:
$50,720 -
Voter turnout:
61%
Language spoken most often at home:
-
English:
88,705 -
French:
1,080 -
Indigenous language:
10 -
Most popular other language:
-
Punjabi (Panjabi):
815
-
-
All others:
2,935
-
-
Electoral District:
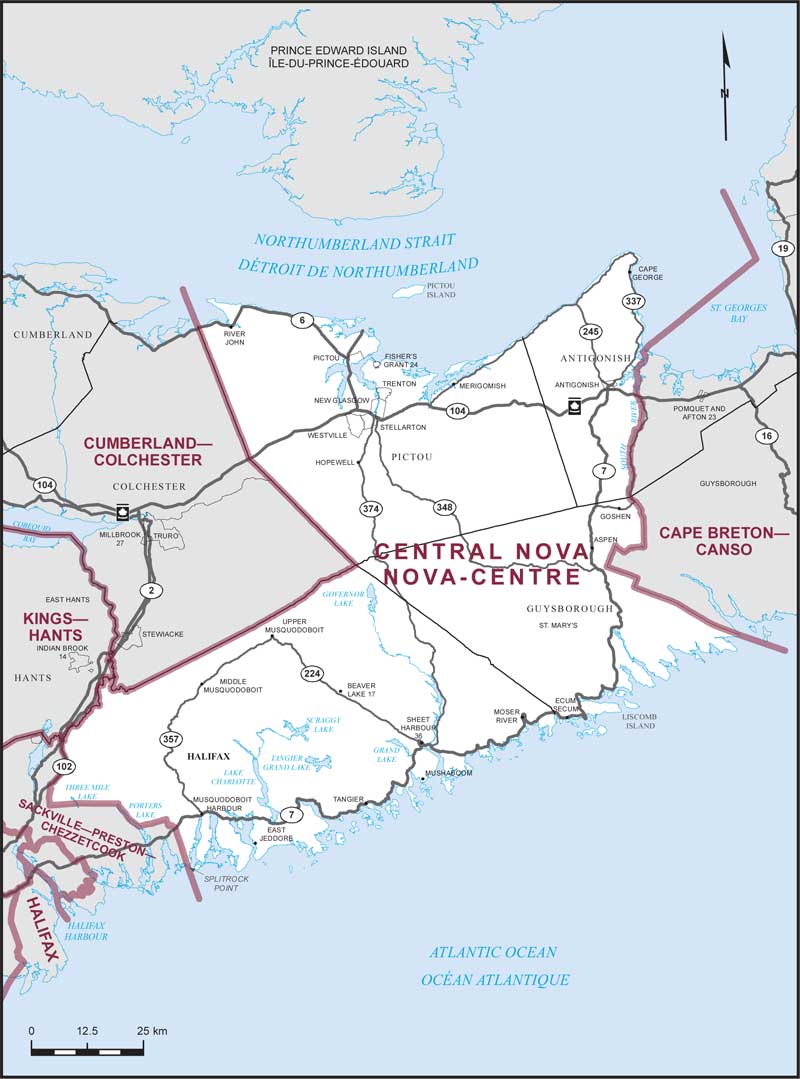
Central NovaProvince/Territory:
Nova Scotia-
Population:
73,188 -
Area:
9,281 km² -
Population density:
8.00/km² -
Population change:
+1.7% -
Average age:
47 -
Average income:
$44,880 -
Voter turnout:
66%
Language spoken most often at home:
-
English:
70,865 -
French:
160 -
Indigenous language:
45 -
Most popular other language:
-
Tagalog (Pilipino, Filipino):
135
-
-
All others:
645
-
-
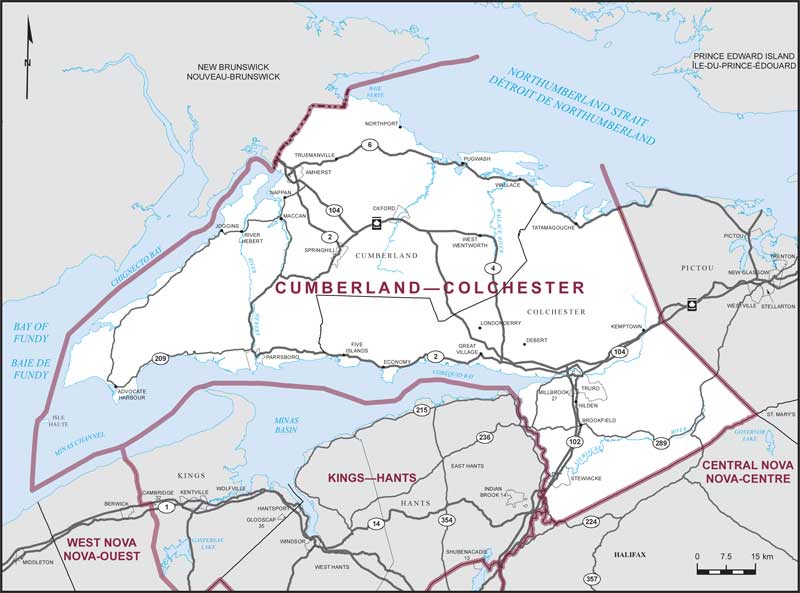
Electoral District:
Cumberland—ColchesterProvince/Territory:
Nova Scotia-
Population:
82,014 -
Area:
7,903 km² -
Population density:
10.00/km² -
Population change:
+1.8% -
Average age:
46 -
Average income:
$43,680 -
Voter turnout:
60%
Language spoken most often at home:
-
English:
78,995 -
French:
145 -
Indigenous language:
25 -
Most popular other language:
-
Punjabi (Panjabi):
205
-
-
All others:
825
-
-
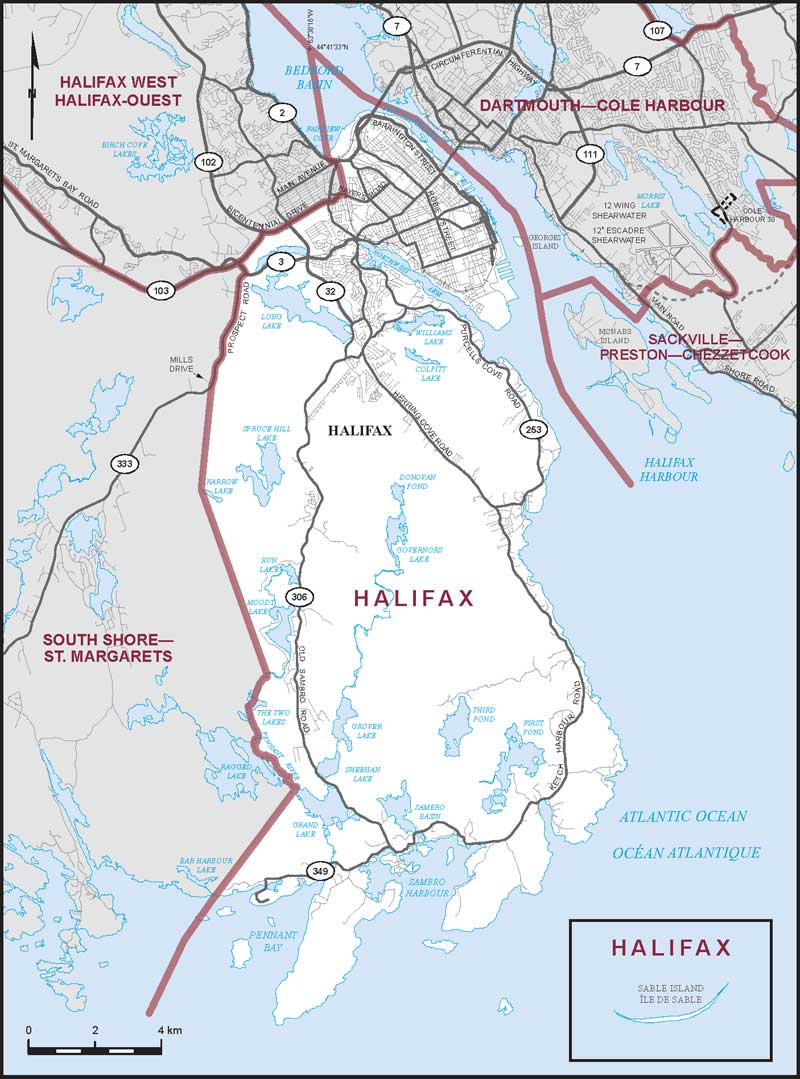
Electoral District:
HalifaxProvince/Territory:
Nova Scotia-
Population:
107,010 -
Area:
215 km² -
Population density:
499.00/km² -
Population change:
+13.1% -
Average age:
39 -
Average income:
$53,000 -
Voter turnout:
66%
Language spoken most often at home:
-
English:
92,095 -
French:
675 -
Indigenous language:
5 -
Most popular other language:
-
Mandarin:
1,995
-
-
All others:
7,665
-
-
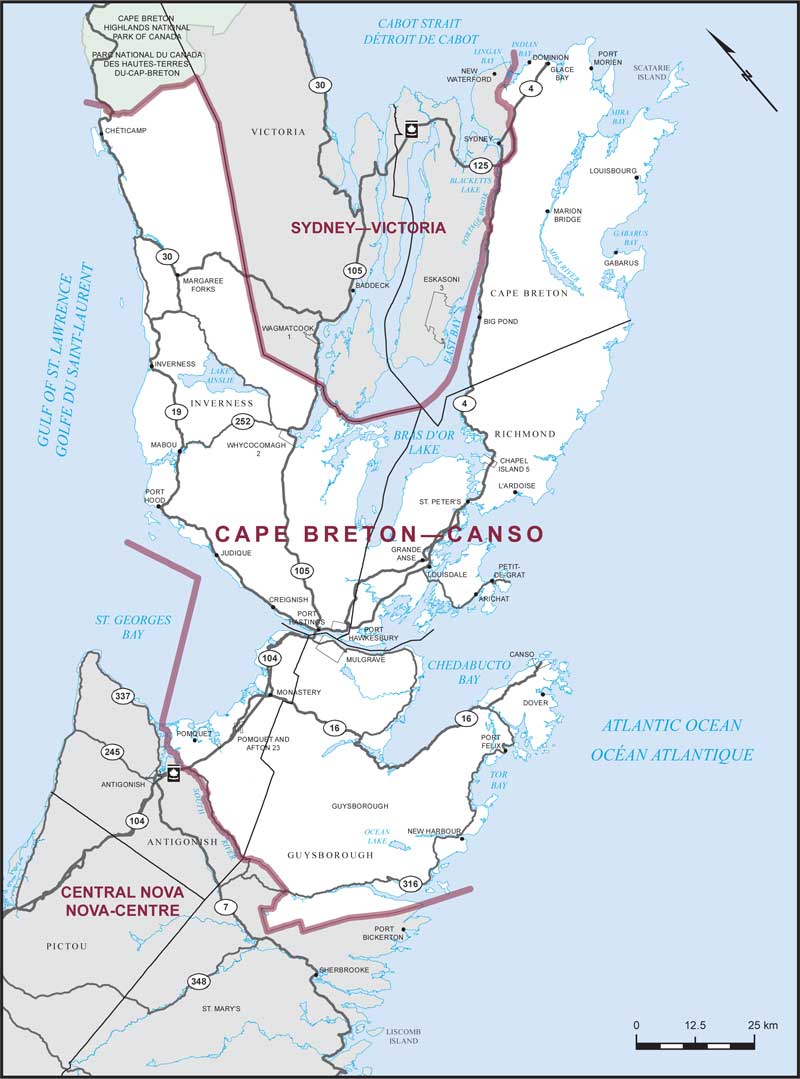
Electoral District:
Cape Breton—CansoProvince/Territory:
Nova Scotia-
Population:
71,380 -
Area:
8,733 km² -
Population density:
8.00/km² -
Population change:
-0.7% -
Average age:
48 -
Average income:
$43,000 -
Voter turnout:
66%
Language spoken most often at home:
-
English:
67,125 -
French:
2,010 -
Indigenous language:
230 -
Most popular other language:
-
German:
140
-
-
All others:
535
-
-
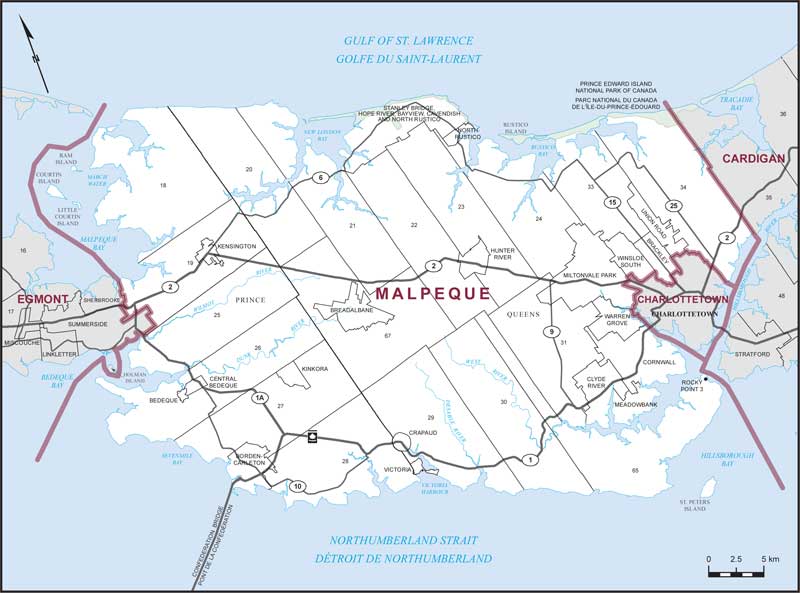
Electoral District:
MalpequeProvince/Territory:
Prince Edward Island-
Population:
39,731 -
Area:
1,606 km² -
Population density:
25.00/km² -
Population change:
+10.3% -
Average age:
43 -
Average income:
$47,800 -
Voter turnout:
75%
Language spoken most often at home:
-
English:
38,080 -
French:
285 -
Indigenous language:
0 -
Most popular other language:
-
Mandarin:
165
-
-
All others:
740
-
-
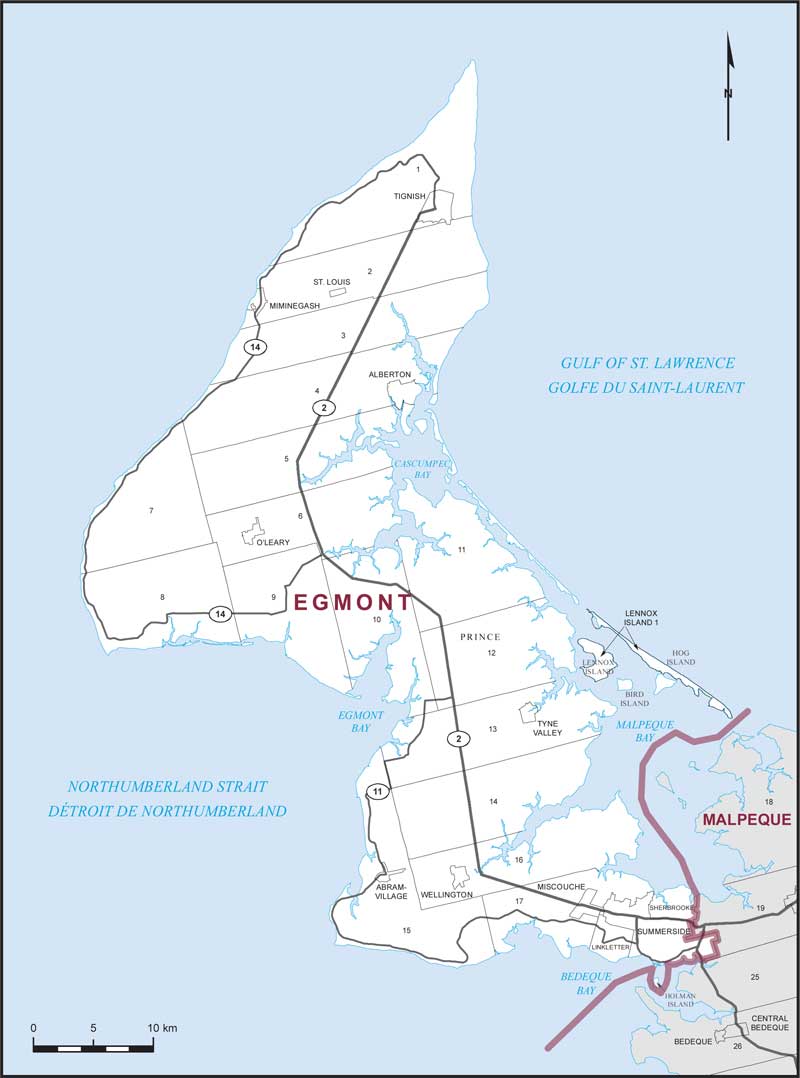
Electoral District:
EgmontProvince/Territory:
Prince Edward Island-
Population:
35,925 -
Area:
1,483 km² -
Population density:
24.00/km² -
Population change:
+5.1% -
Average age:
47 -
Average income:
$42,680 -
Voter turnout:
69%
Language spoken most often at home:
-
English:
32,505 -
French:
1,325 -
Indigenous language:
5 -
Most popular other language:
-
Tagalog (Pilipino, Filipino):
530
-
-
All others:
705
-
-
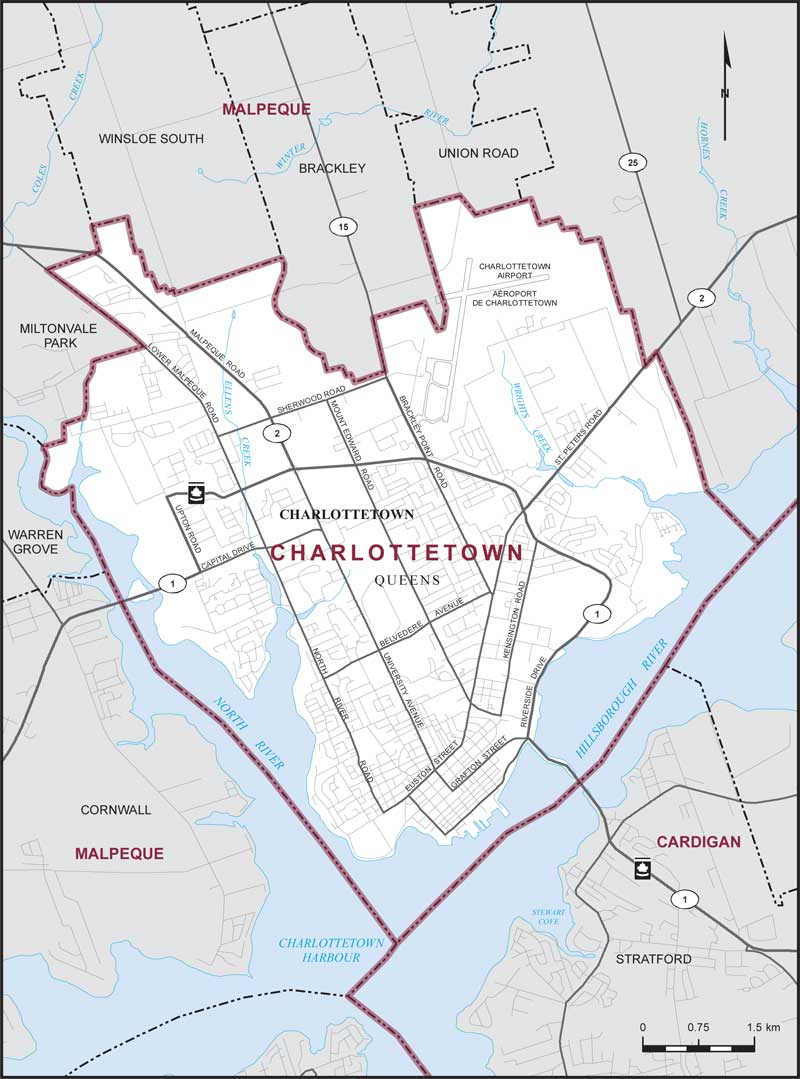
Electoral District:
CharlottetownProvince/Territory:
Prince Edward Island-
Population:
38,809 -
Area:
44 km² -
Population density:
877.00/km² -
Population change:
+7.5% -
Average age:
42 -
Average income:
$46,160 -
Voter turnout:
41%
Language spoken most often at home:
-
English:
32,020 -
French:
260 -
Indigenous language:
0 -
Most popular other language:
-
Mandarin:
1,220
-
-
All others:
3,295
-
-
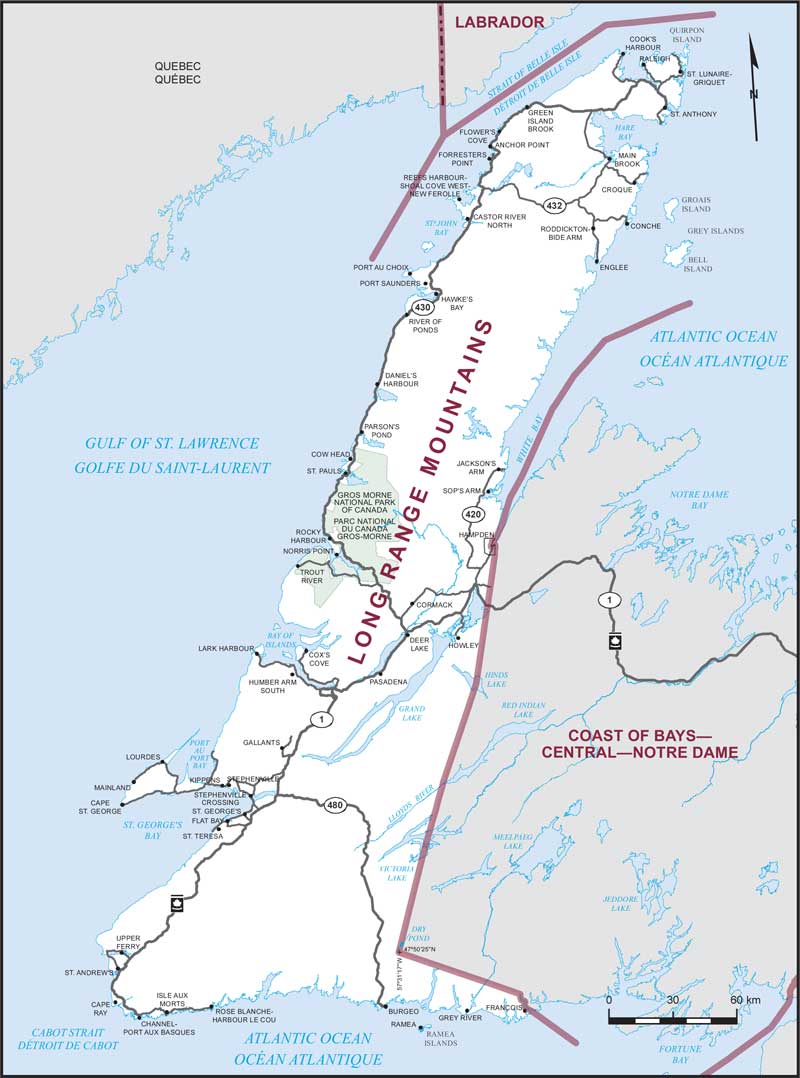
Electoral District:
Long Range MountainsProvince/Territory:
Newfoundland and Labrador-
Population:
81,716 -
Area:
37,319 km² -
Population density:
2.00/km² -
Population change:
-5.6% -
Average age:
49 -
Average income:
$41,600 -
Voter turnout:
53%
Language spoken most often at home:
-
English:
79,890 -
French:
115 -
Indigenous language:
0 -
Most popular other language:
-
Tagalog (Pilipino, Filipino):
60
-
-
All others:
335
-
-
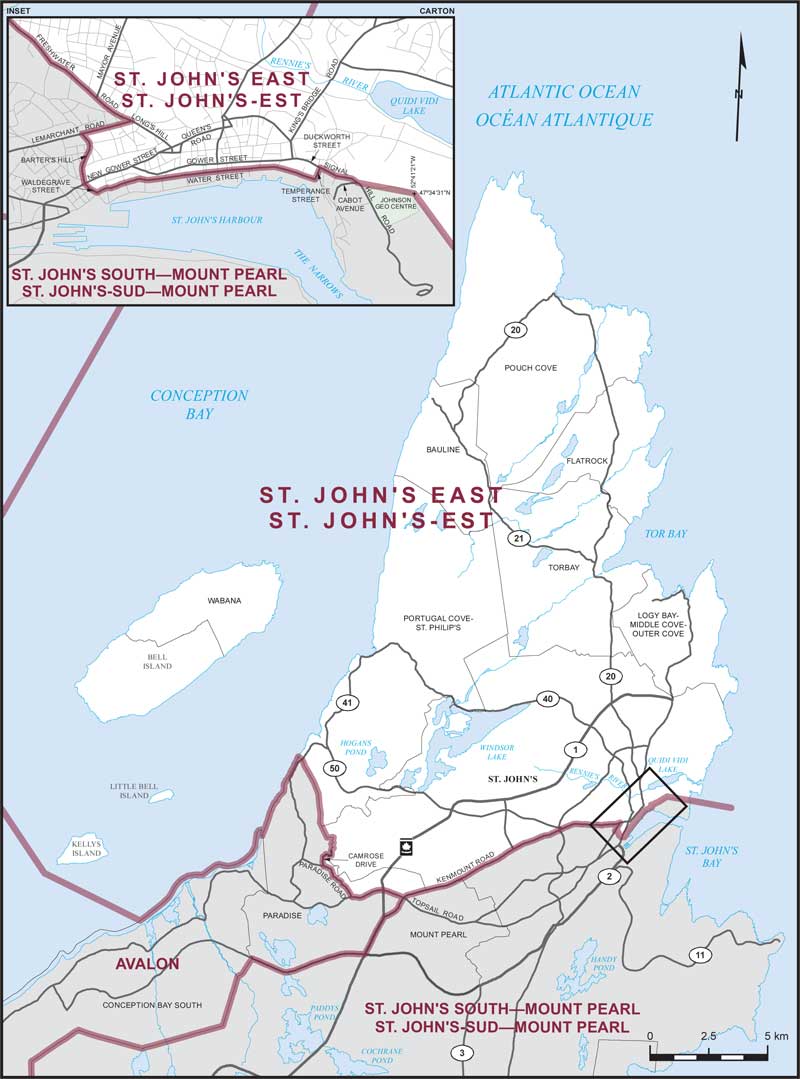
Electoral District:
St. John's EastProvince/Territory:
Newfoundland and Labrador-
Population:
87,345 -
Area:
328 km² -
Population density:
266.00/km² -
Population change:
+1.9% -
Average age:
42 -
Average income:
$59,800 -
Voter turnout:
57%
Language spoken most often at home:
-
English:
81,275 -
French:
290 -
Indigenous language:
0 -
Most popular other language:
-
Arabic:
540
-
-
All others:
2,340
-
-
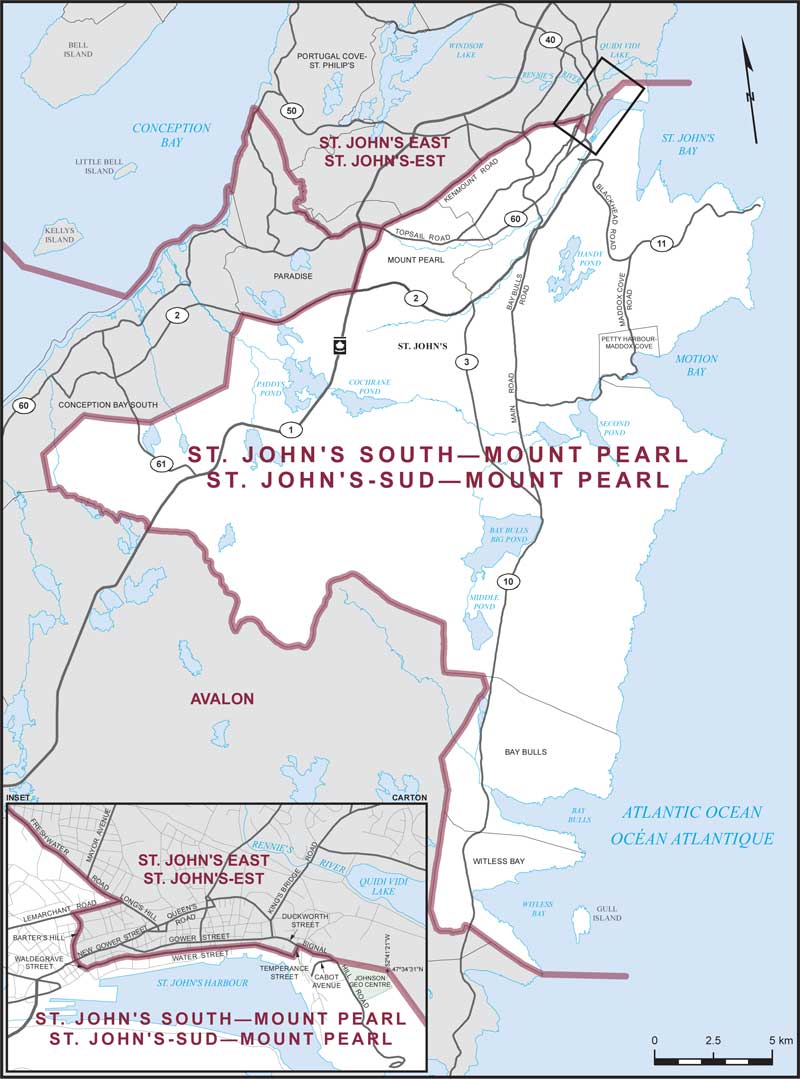
Electoral District:
St. John's South—Mount PearlProvince/Territory:
Newfoundland and Labrador-
Population:
81,544 -
Area:
423 km² -
Population density:
193.00/km² -
Population change:
-0.5% -
Average age:
43 -
Average income:
$51,080 -
Voter turnout:
53%
Language spoken most often at home:
-
English:
78,755 -
French:
110 -
Indigenous language:
5 -
Most popular other language:
-
Arabic:
330
-
-
All others:
1,150
-
-
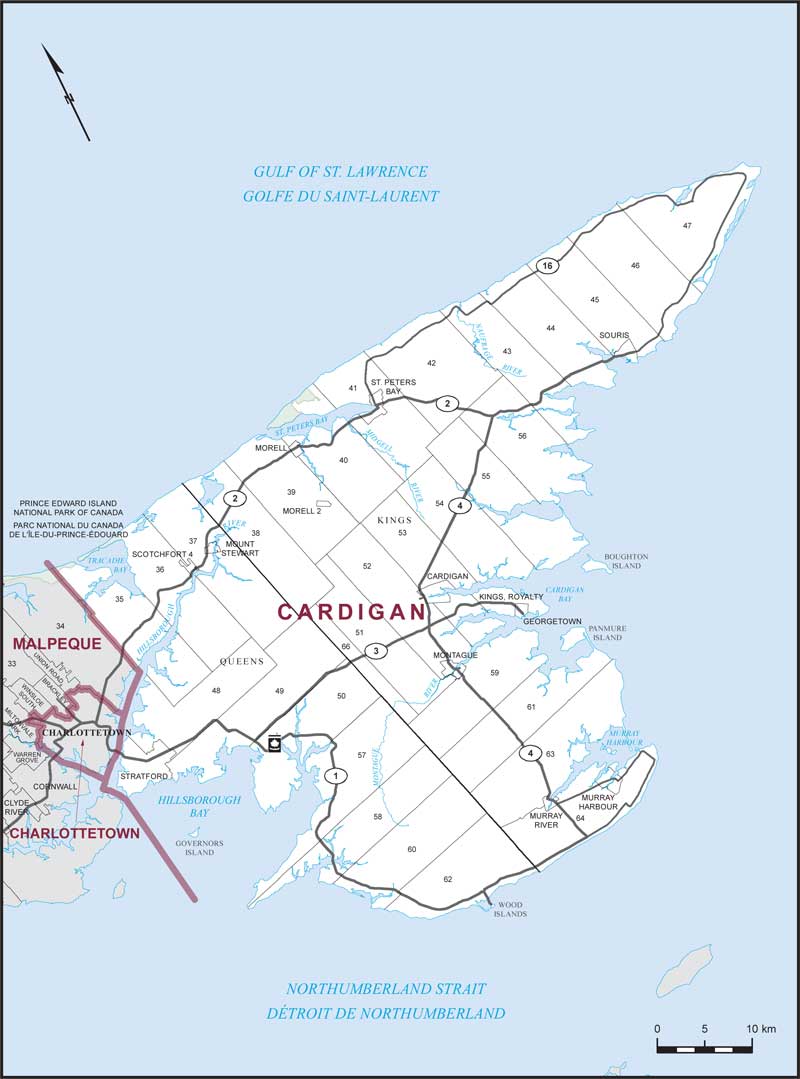
Electoral District:
CardiganProvince/Territory:
Prince Edward Island-
Population:
39,866 -
Area:
2,548 km² -
Population density:
15.00/km² -
Population change:
+8.9% -
Average age:
43 -
Average income:
$47,640 -
Voter turnout:
72%
Language spoken most often at home:
-
English:
36,595 -
French:
210 -
Indigenous language:
0 -
Most popular other language:
-
Mandarin:
1,565
-
-
All others:
850
-
-
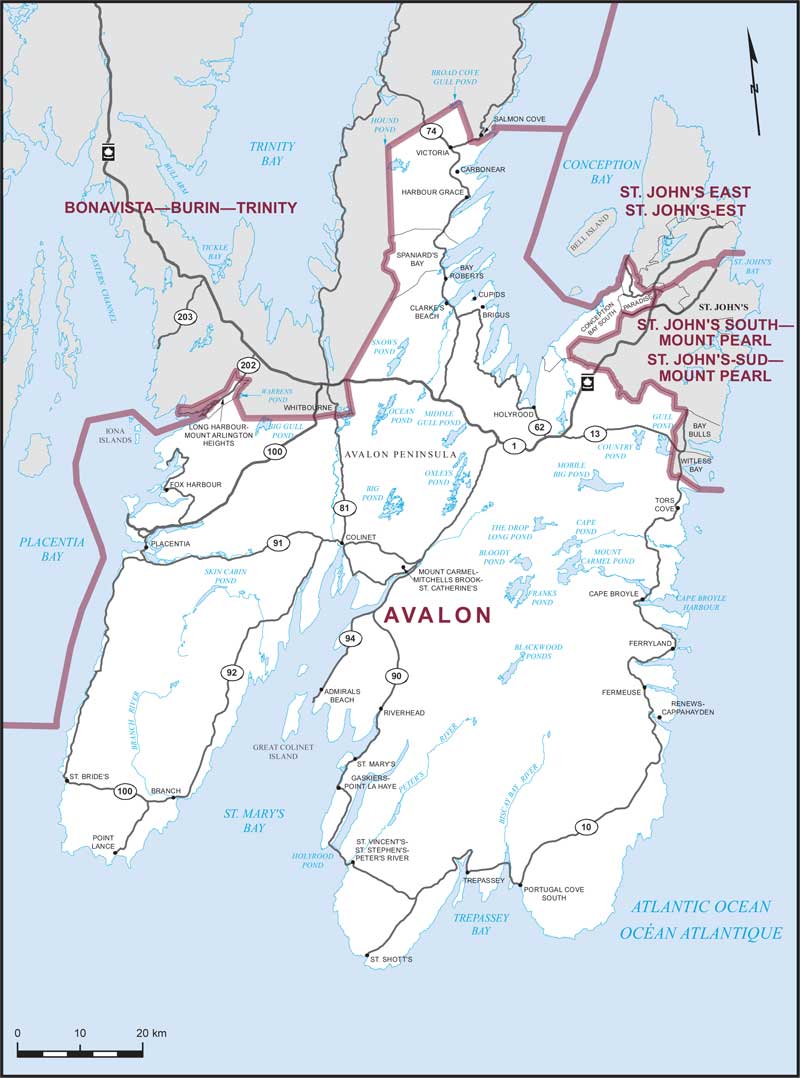
Electoral District:
AvalonProvince/Territory:
Newfoundland and Labrador-
Population:
87,191 -
Area:
6,357 km² -
Population density:
14.00/km² -
Population change:
+0.7% -
Average age:
44 -
Average income:
$50,440 -
Voter turnout:
53%
Language spoken most often at home:
-
English:
86,385 -
French:
65 -
Indigenous language:
0 -
Most popular other language:
-
American Sign Language:
25
-
-
All others:
175
-
-
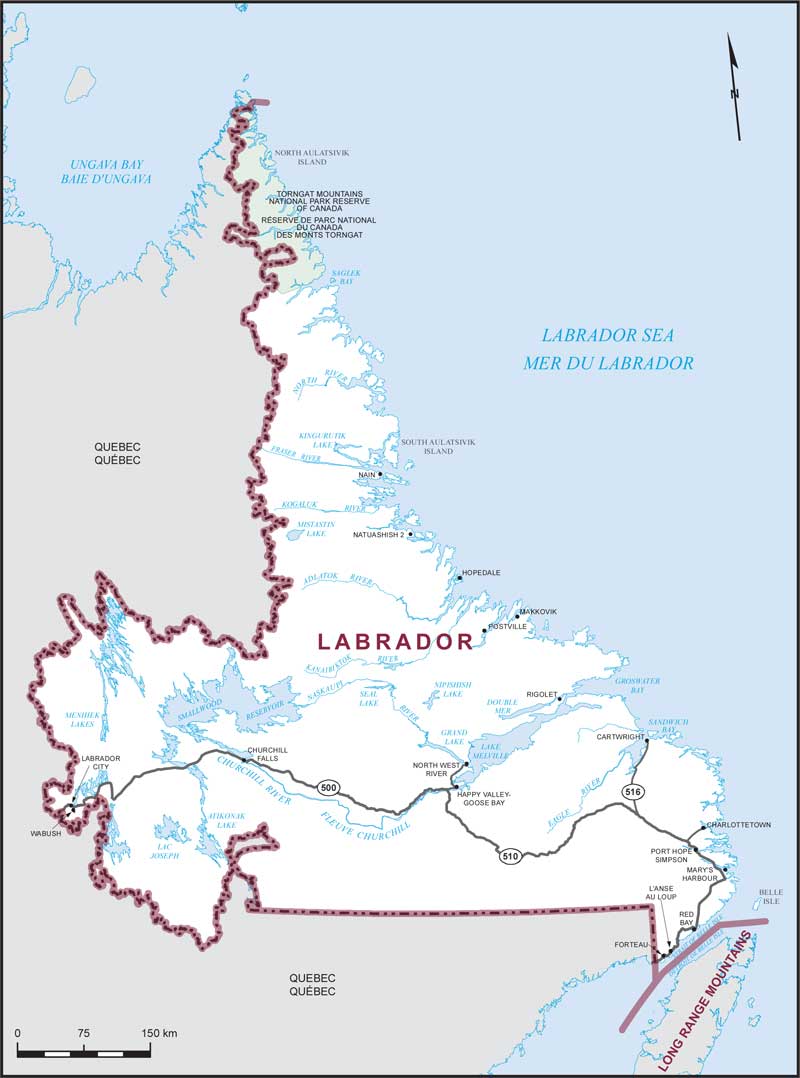
Electoral District:
LabradorProvince/Territory:
Newfoundland and Labrador-
Population:
26,655 -
Area:
258,539 km² -
Population density:
0.10/km² -
Population change:
-2% -
Average age:
38 -
Average income:
$64,000 -
Voter turnout:
48%
Language spoken most often at home:
-
English:
23,880 -
French:
195 -
Indigenous language:
1,345 -
Most popular other language:
-
Tagalog (Pilipino, Filipino):
240
-
-
All others:
215
-