Federal Electoral District Fact Sheets
-
Electoral District:
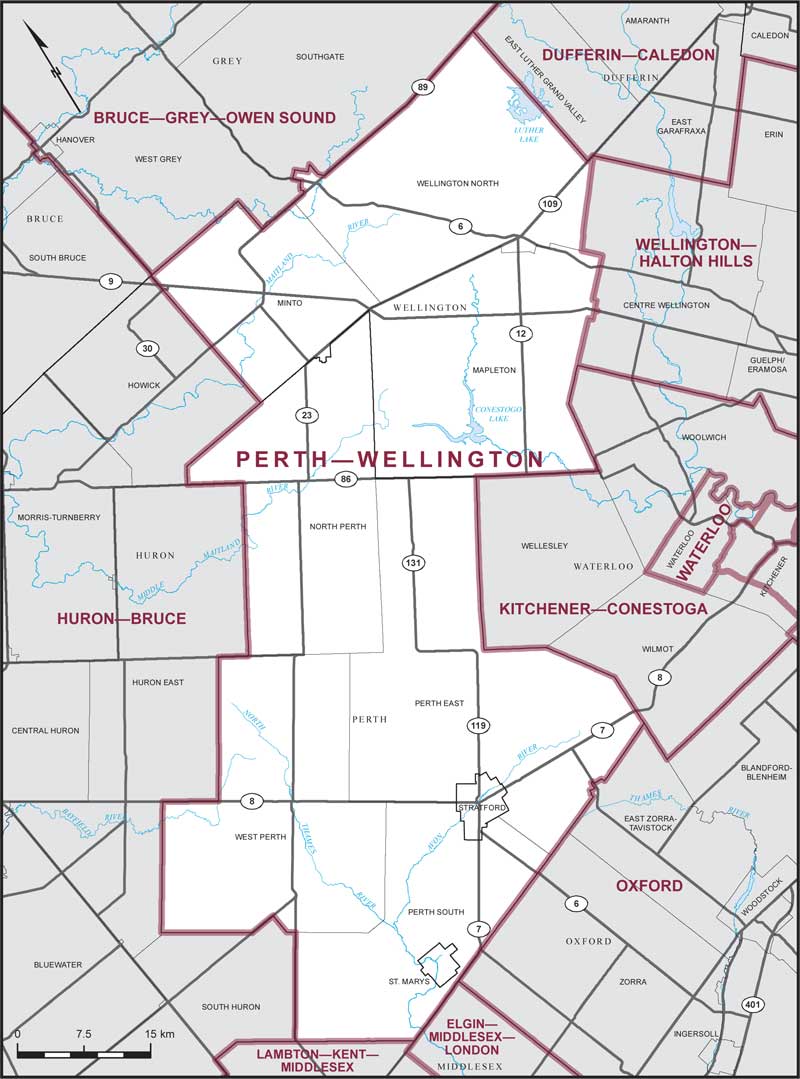
Perth—WellingtonProvince/Territory:
Ontario-
Population:
113,910 -
Area:
3,580 km² -
Population density:
32.00/km² -
Population change:
+5.6% -
Average age:
42 -
Average income:
$50,160 -
Voter turnout:
66%
Language spoken most often at home:
-
English:
103,620 -
French:
100 -
Indigenous language:
0 -
Most popular other language:
-
German & Pennsylvania German:
4,015
-
-
All others:
3,590
-
-
Electoral District:
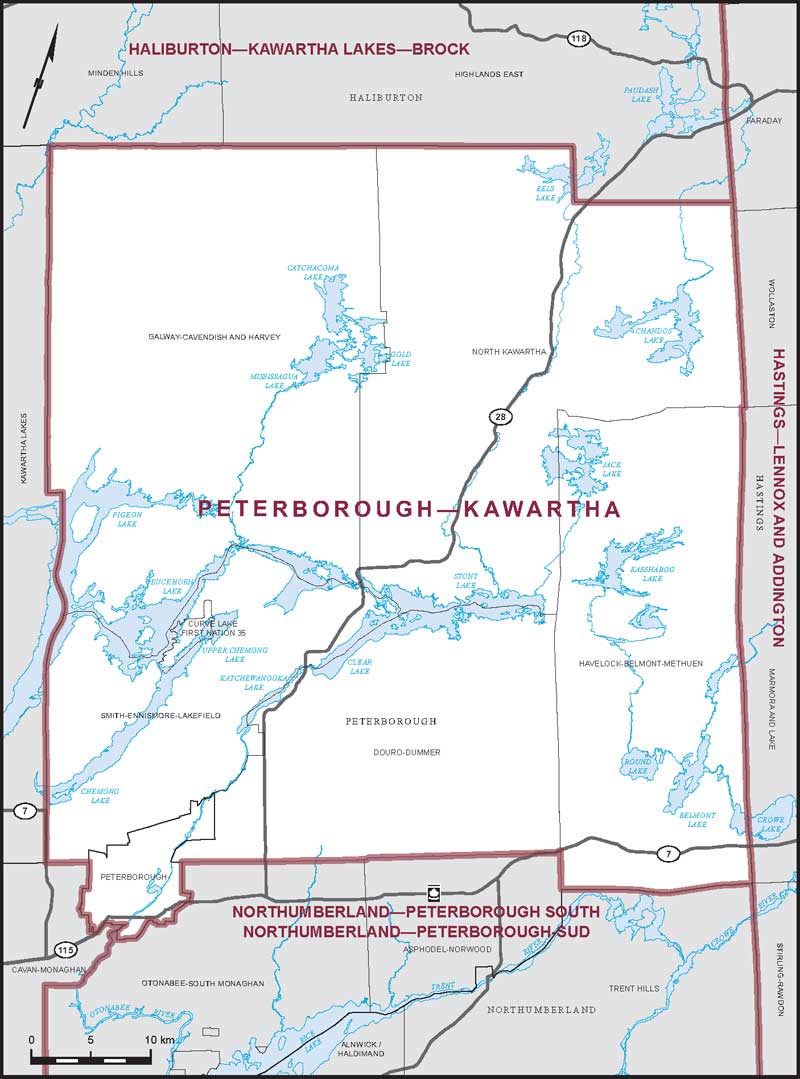
Peterborough—KawarthaProvince/Territory:
Ontario-
Population:
125,478 -
Area:
2,956 km² -
Population density:
42.00/km² -
Population change:
+6.2% -
Average age:
45 -
Average income:
$49,640 -
Voter turnout:
69%
Language spoken most often at home:
-
English:
119,660 -
French:
280 -
Indigenous language:
15 -
Most popular other language:
-
Mandarin & Yue (Cantonese):
370
-
-
All others:
2,650
-
-
Electoral District:
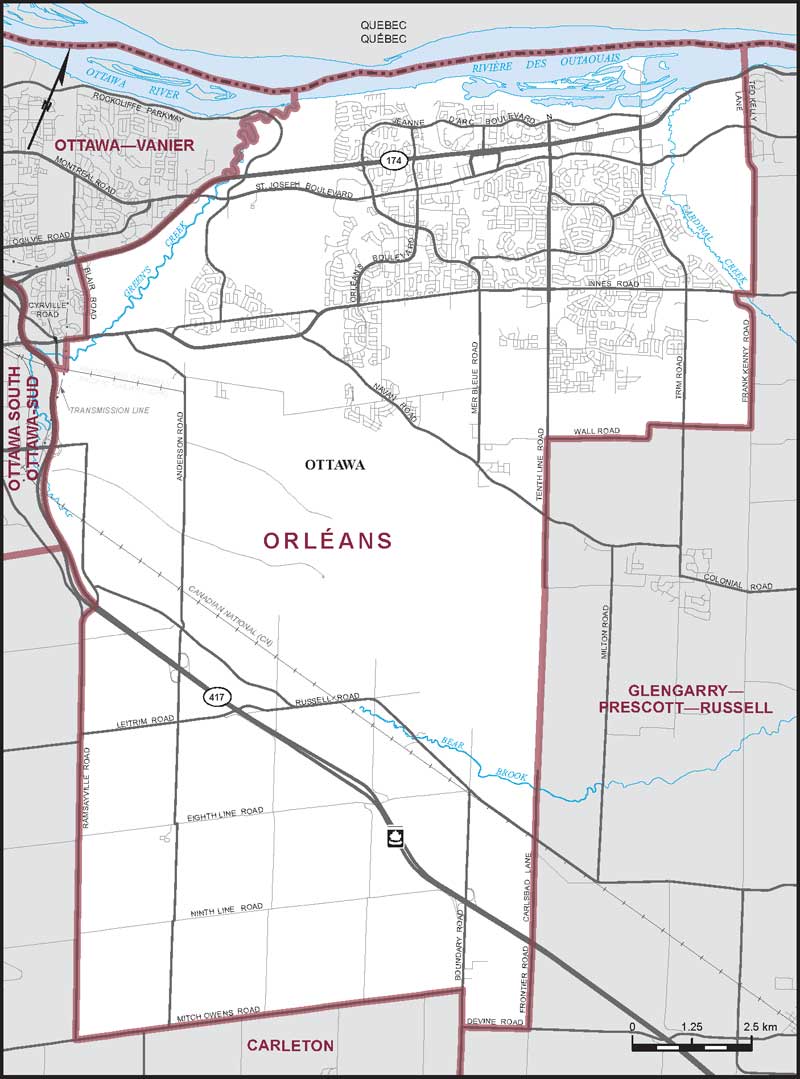
OrléansProvince/Territory:
Ontario-
Population:
139,309 -
Area:
206 km² -
Population density:
677.00/km² -
Population change:
+8.6% -
Average age:
41 -
Average income:
$64,500 -
Voter turnout:
71%
Language spoken most often at home:
-
English:
87,225 -
French:
29,235 -
Indigenous language:
5 -
Most popular other language:
-
Arabic:
2,740
-
-
All others:
8,310
-
-
Electoral District:
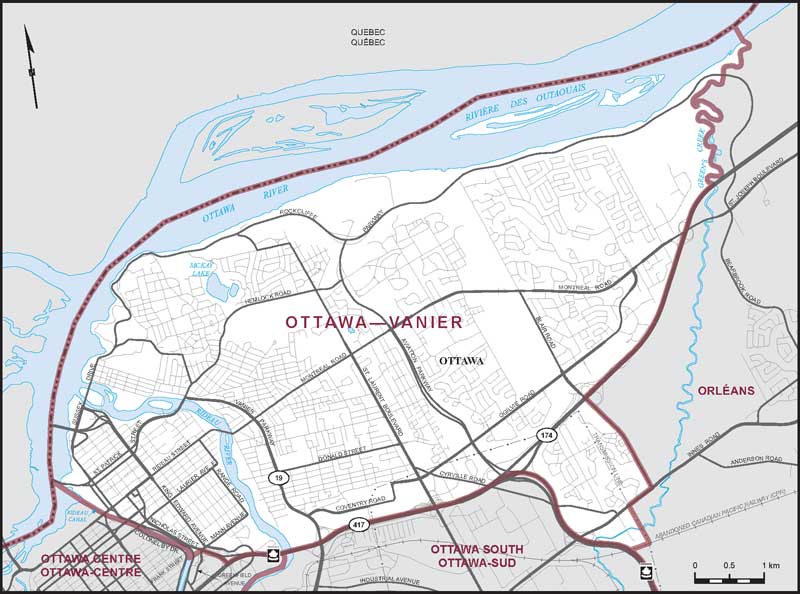
Ottawa—VanierProvince/Territory:
Ontario-
Population:
118,806 -
Area:
39 km² -
Population density:
3,032.00/km² -
Population change:
+6.5% -
Average age:
42 -
Average income:
$57,600 -
Voter turnout:
65%
Language spoken most often at home:
-
English:
73,360 -
French:
20,935 -
Indigenous language:
80 -
Most popular other language:
-
Arabic:
3,030
-
-
All others:
10,260
-
-
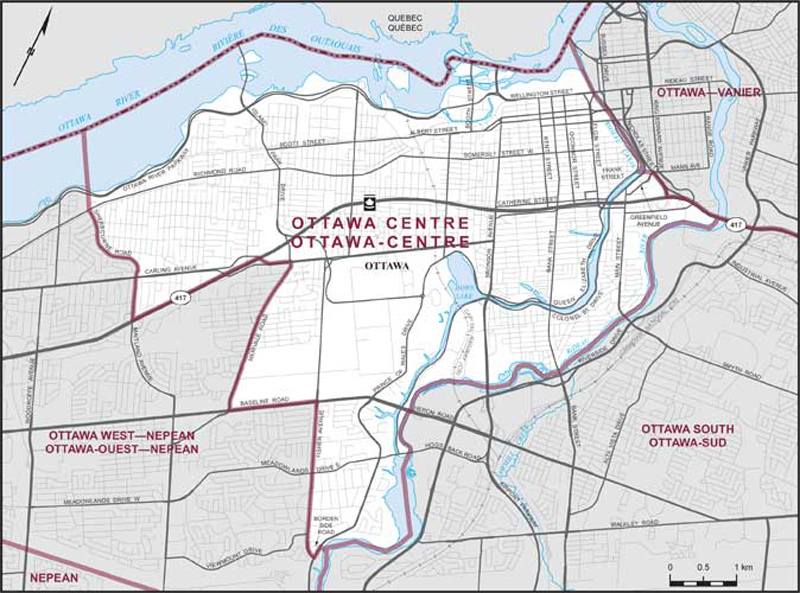
Electoral District:
Ottawa CentreProvince/Territory:
Ontario-
Population:
126,360 -
Area:
32 km² -
Population density:
3,896.00/km² -
Population change:
+7.1% -
Average age:
41 -
Average income:
$77,800 -
Voter turnout:
75%
Language spoken most often at home:
-
English:
102,735 -
French:
6,110 -
Indigenous language:
25 -
Most popular other language:
-
Mandarin & Yue (Cantonese):
2,250
-
-
All others:
8,315
-
-
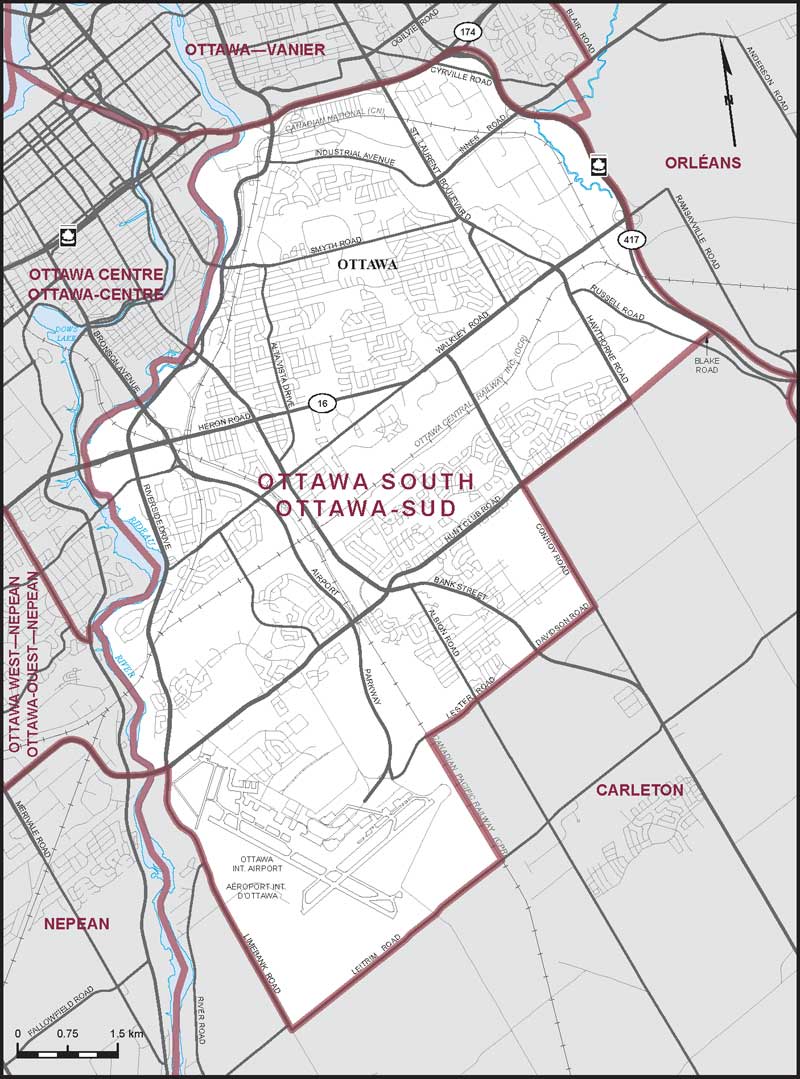
Electoral District:
Ottawa SouthProvince/Territory:
Ontario-
Population:
125,090 -
Area:
73 km² -
Population density:
1,713.00/km² -
Population change:
+3.3% -
Average age:
41 -
Average income:
$55,600 -
Voter turnout:
66%
Language spoken most often at home:
-
English:
83,675 -
French:
8,410 -
Indigenous language:
15 -
Most popular other language:
-
Arabic:
7,460
-
-
All others:
13,930
-
-
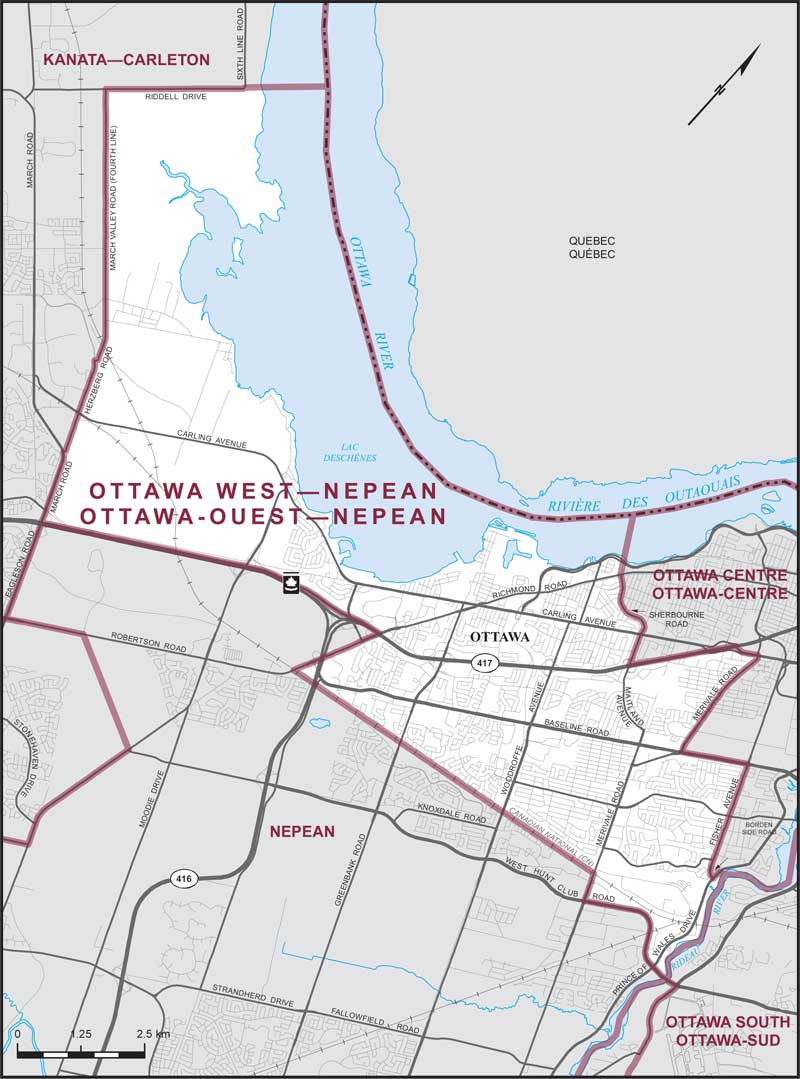
Electoral District:
Ottawa West—NepeanProvince/Territory:
Ontario-
Population:
116,409 -
Area:
66 km² -
Population density:
1,764.00/km² -
Population change:
+4.1% -
Average age:
43 -
Average income:
$55,900 -
Voter turnout:
68%
Language spoken most often at home:
-
English:
86,195 -
French:
3,800 -
Indigenous language:
30 -
Most popular other language:
-
Arabic:
2,960
-
-
All others:
14,680
-
-
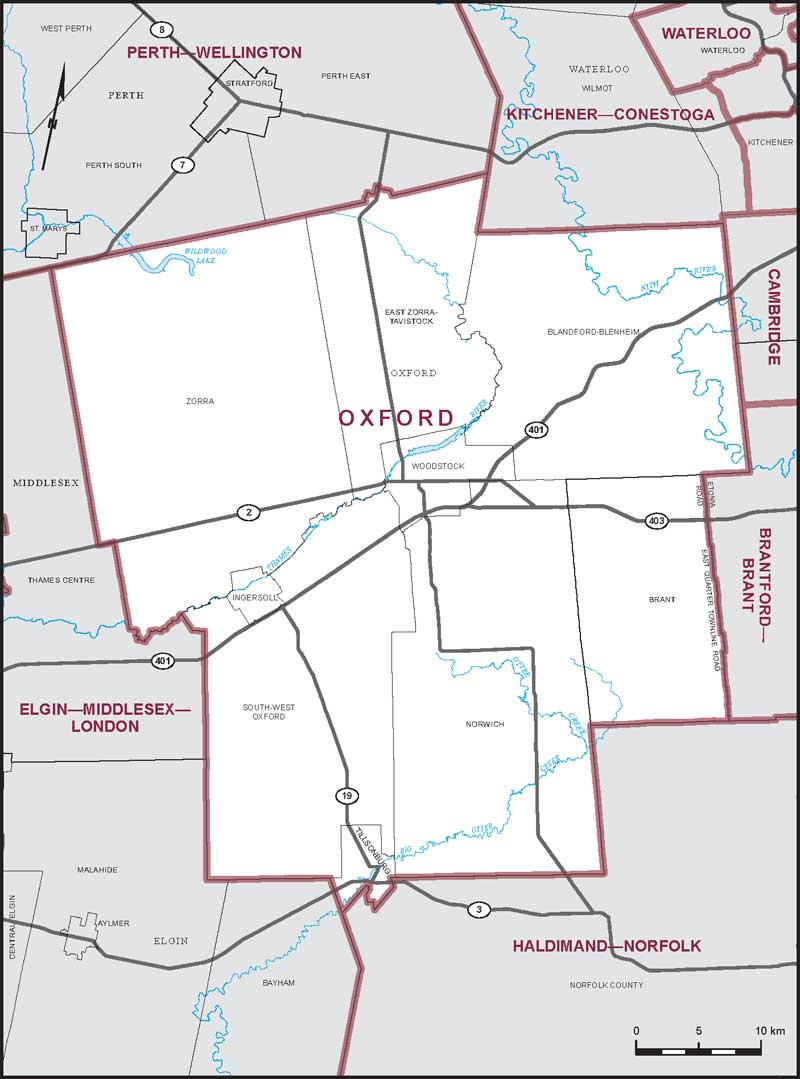
Electoral District:
OxfordProvince/Territory:
Ontario-
Population:
124,790 -
Area:
2,246 km² -
Population density:
56.00/km² -
Population change:
+9.7% -
Average age:
42 -
Average income:
$50,760 -
Voter turnout:
65%
Language spoken most often at home:
-
English:
116,830 -
French:
230 -
Indigenous language:
0 -
Most popular other language:
-
Punjabi (Panjabi):
1,620
-
-
All others:
3,705
-
-
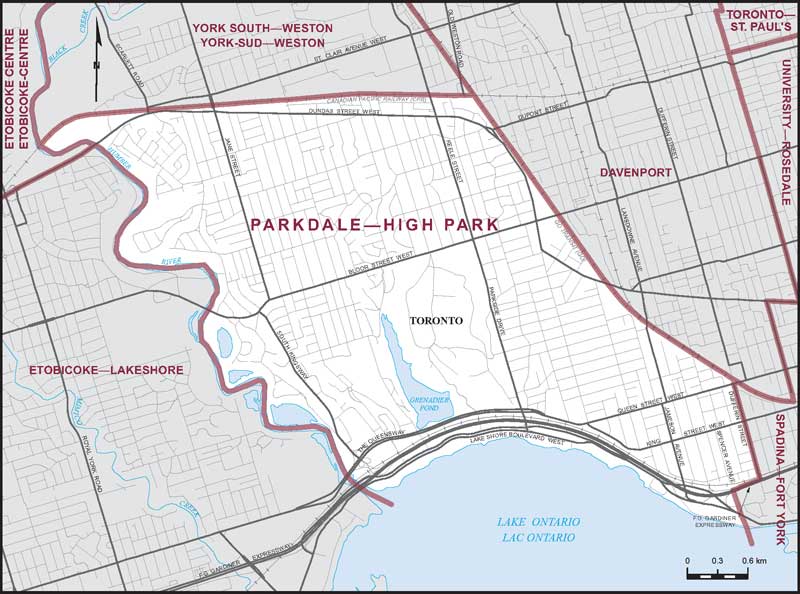
Electoral District:
Parkdale—High ParkProvince/Territory:
Ontario-
Population:
106,750 -
Area:
15 km² -
Population density:
7,198.00/km² -
Population change:
-1.9% -
Average age:
41 -
Average income:
$72,800 -
Voter turnout:
66%
Language spoken most often at home:
-
English:
86,125 -
French:
880 -
Indigenous language:
5 -
Most popular other language:
-
Tibetan:
1,400
-
-
All others:
12,490
-
-
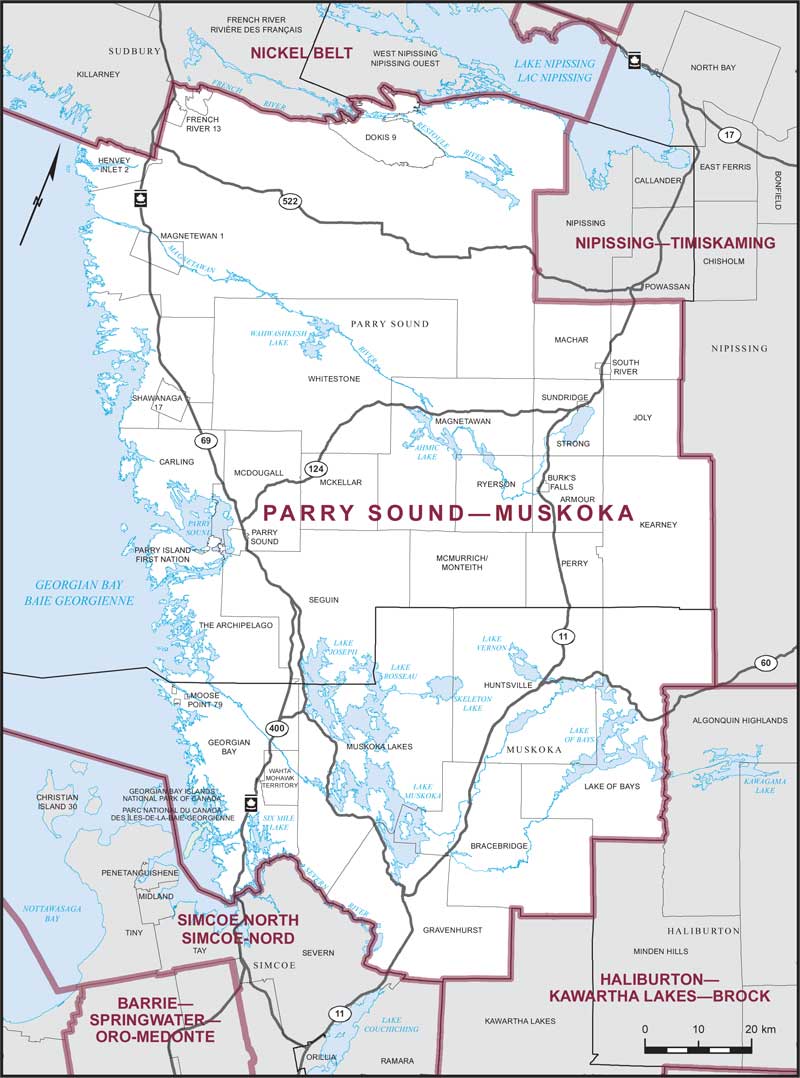
Electoral District:
Parry Sound—MuskokaProvince/Territory:
Ontario-
Population:
104,494 -
Area:
12,238 km² -
Population density:
9.00/km² -
Population change:
+10.7% -
Average age:
49 -
Average income:
$52,500 -
Voter turnout:
65%
Language spoken most often at home:
-
English:
100,955 -
French:
175 -
Indigenous language:
30 -
Most popular other language:
-
German:
145
-
-
All others:
965
-
-
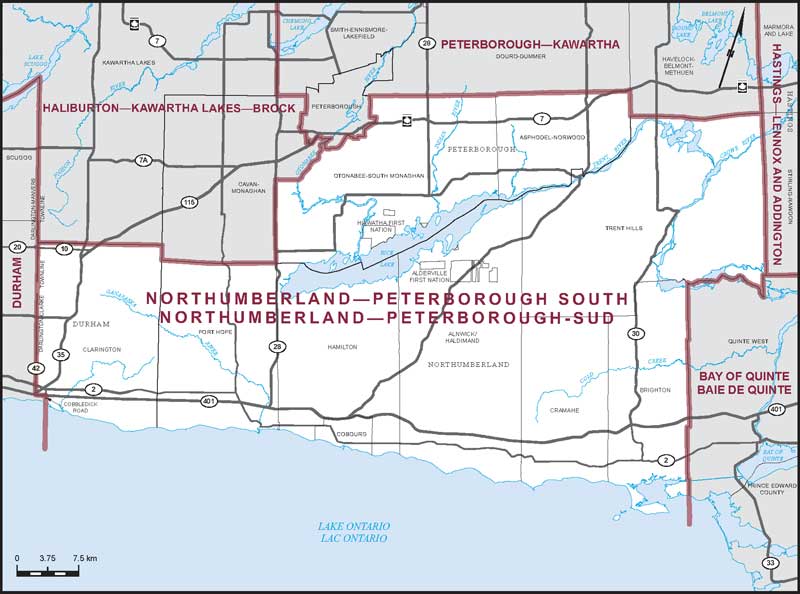
Electoral District:
Northumberland—Peterborough SouthProvince/Territory:
Ontario-
Population:
118,756 -
Area:
2,728 km² -
Population density:
44.00/km² -
Population change:
+5.6% -
Average age:
47 -
Average income:
$53,100 -
Voter turnout:
70%
Language spoken most often at home:
-
English:
114,530 -
French:
315 -
Indigenous language:
10 -
Most popular other language:
-
Tamil:
155
-
-
All others:
1,530
-
-
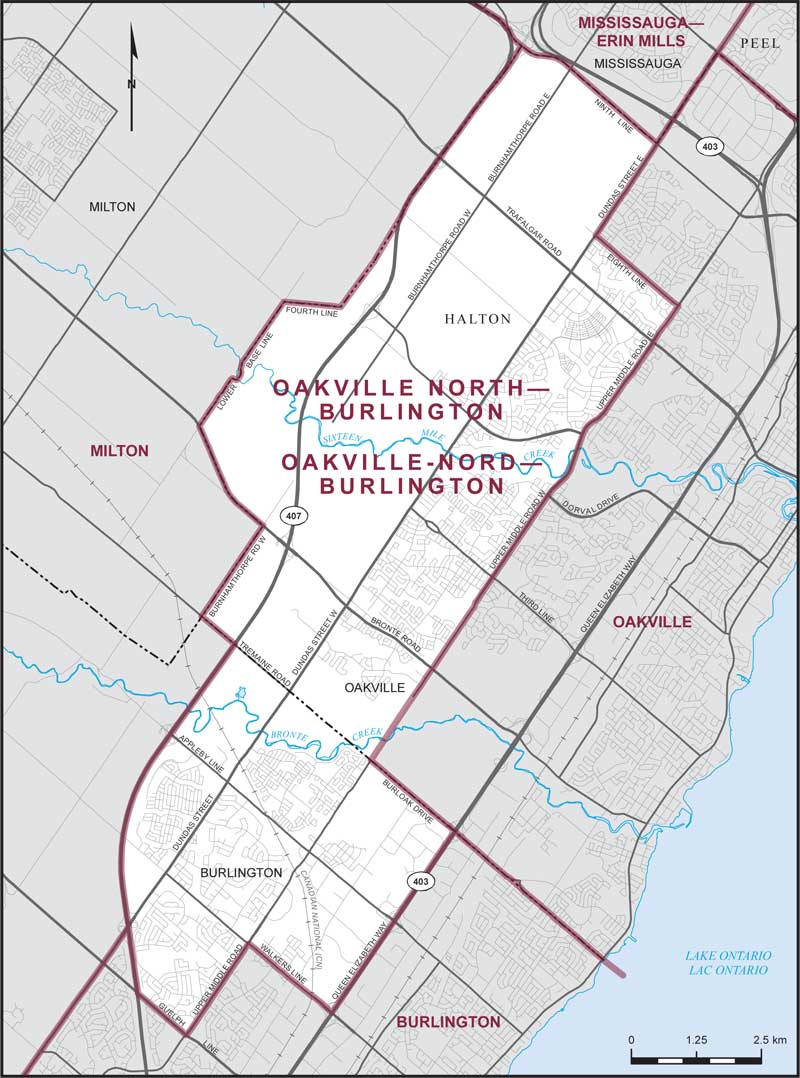
Electoral District:
Oakville North—BurlingtonProvince/Territory:
Ontario-
Population:
148,936 -
Area:
87 km² -
Population density:
1,708.00/km² -
Population change:
+15.4% -
Average age:
38 -
Average income:
$74,100 -
Voter turnout:
67%
Language spoken most often at home:
-
English:
108,610 -
French:
800 -
Indigenous language:
5 -
Most popular other language:
-
Mandarin:
6,050
-
-
All others:
21,800
-
-
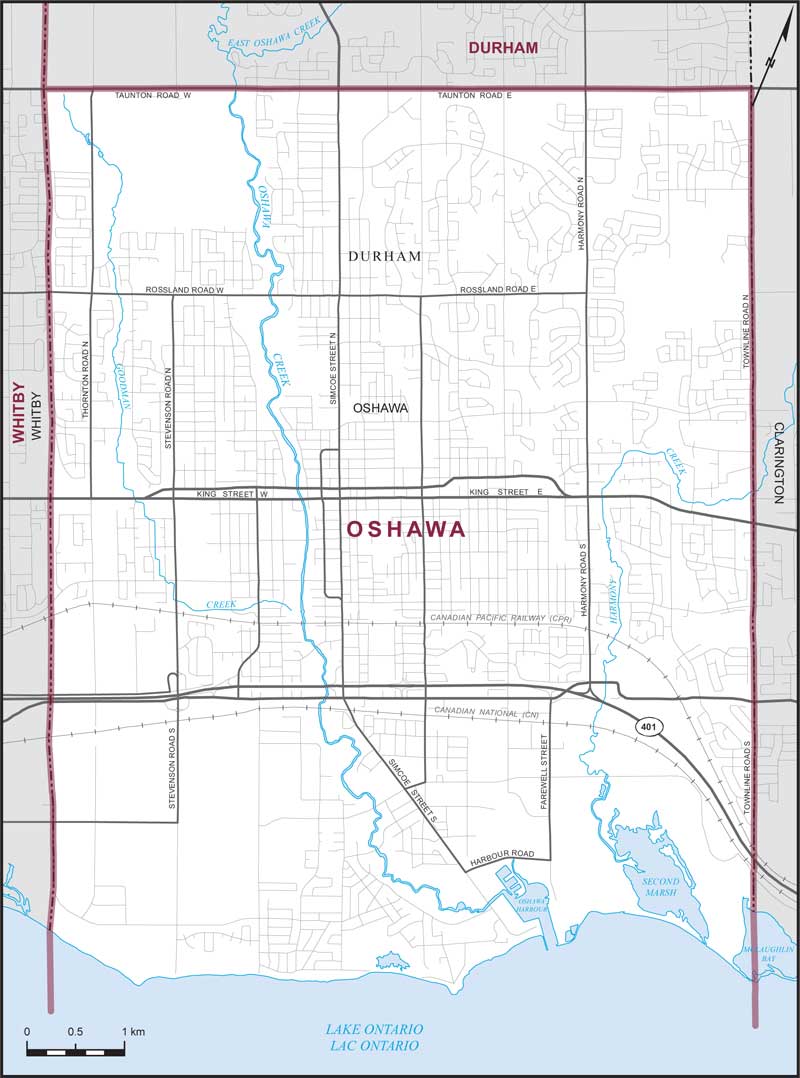
Electoral District:
OshawaProvince/Territory:
Ontario-
Population:
131,067 -
Area:
61 km² -
Population density:
2,161.00/km² -
Population change:
+3.4% -
Average age:
42 -
Average income:
$47,520 -
Voter turnout:
56%
Language spoken most often at home:
-
English:
118,560 -
French:
830 -
Indigenous language:
0 -
Most popular other language:
-
Urdu:
690
-
-
All others:
6,925
-
-
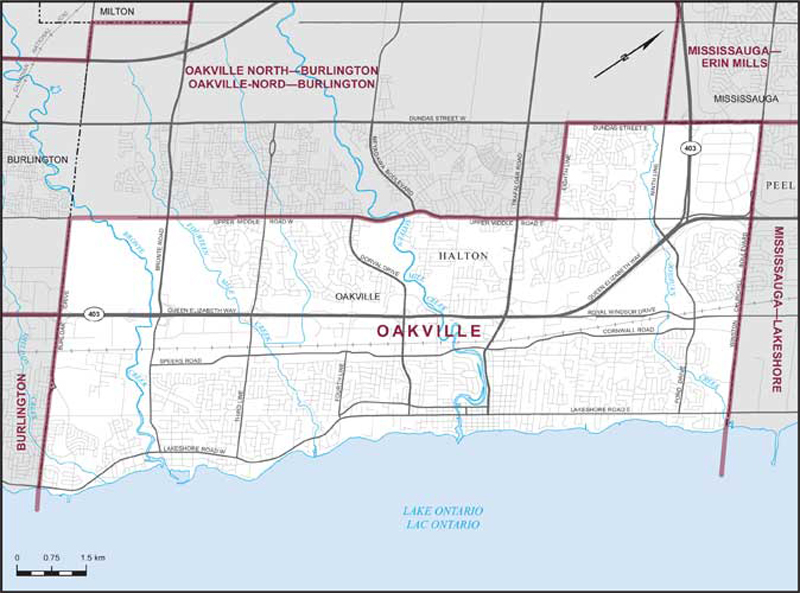
Electoral District:
OakvilleProvince/Territory:
Ontario-
Population:
122,322 -
Area:
78 km² -
Population density:
1,561.00/km² -
Population change:
+1.2% -
Average age:
43 -
Average income:
$86,600 -
Voter turnout:
69%
Language spoken most often at home:
-
English:
94,695 -
French:
705 -
Indigenous language:
0 -
Most popular other language:
-
Mandarin:
6,515
-
-
All others:
13,845
-
-
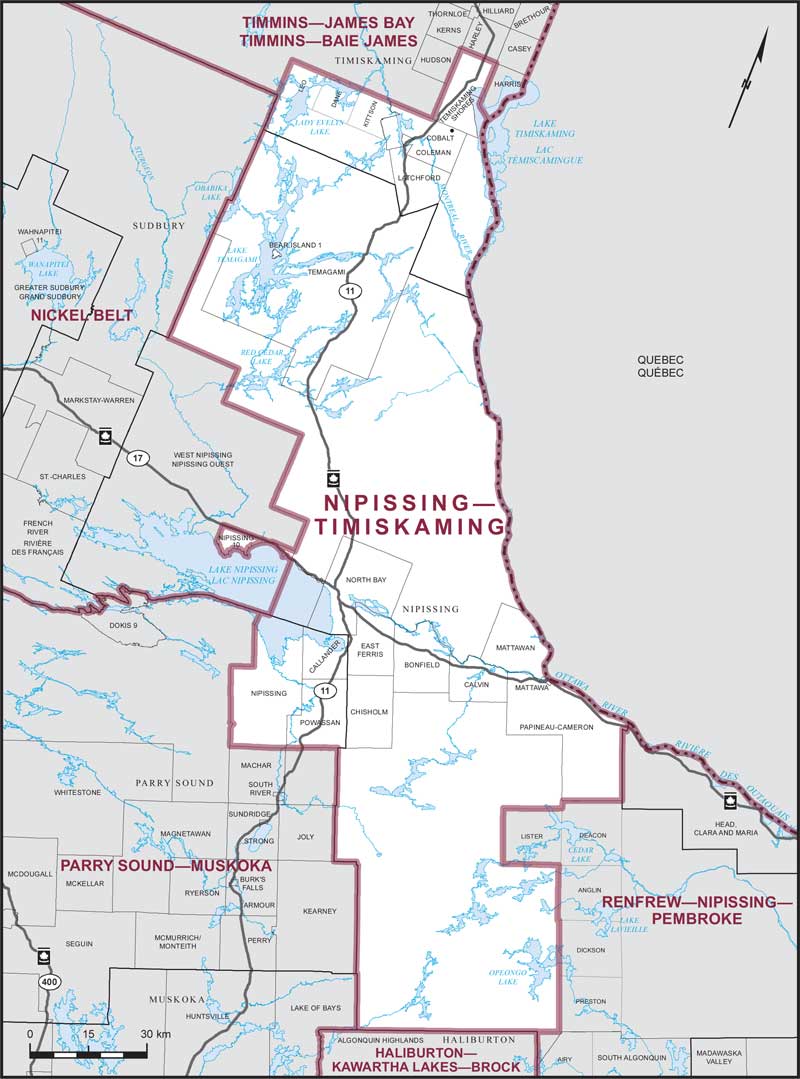
Electoral District:
Nipissing—TimiskamingProvince/Territory:
Ontario-
Population:
89,781 -
Area:
13,116 km² -
Population density:
7.00/km² -
Population change:
+1.1% -
Average age:
45 -
Average income:
$49,440 -
Voter turnout:
63%
Language spoken most often at home:
-
English:
80,885 -
French:
4,925 -
Indigenous language:
45 -
Most popular other language:
-
German:
125
-
-
All others:
1,025
-
-
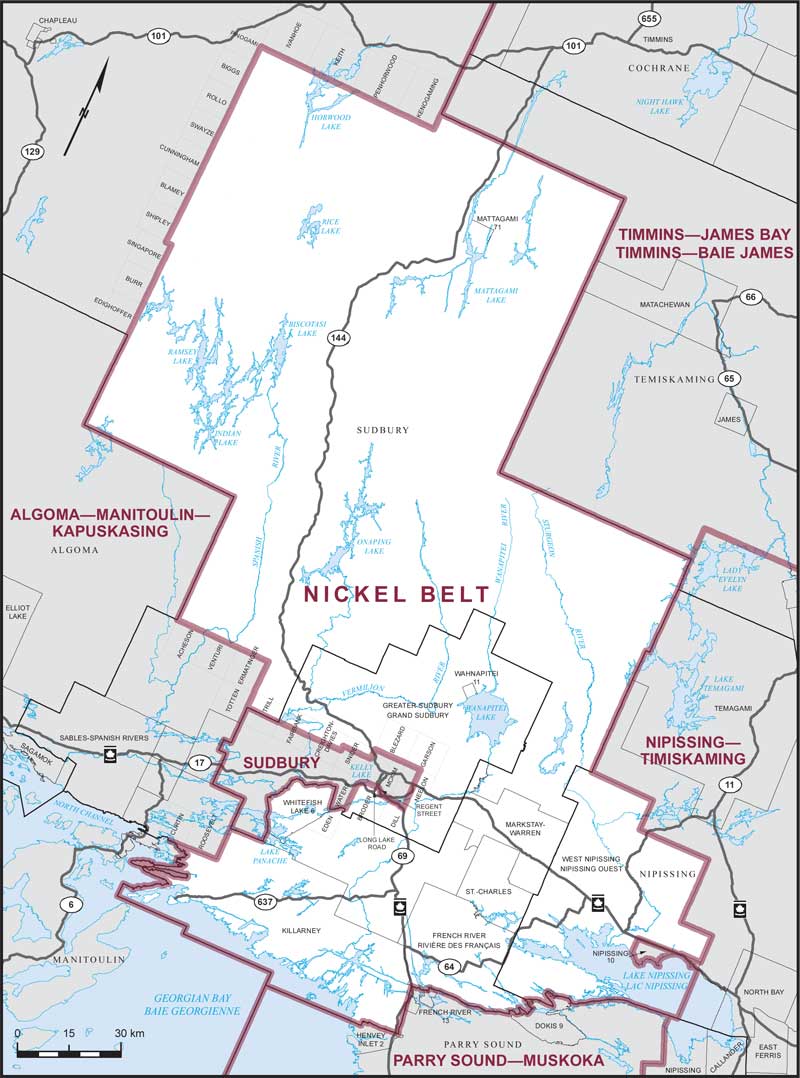
Electoral District:
Nickel BeltProvince/Territory:
Ontario-
Population:
94,947 -
Area:
26,564 km² -
Population density:
4.00/km² -
Population change:
+1.3% -
Average age:
44 -
Average income:
$55,100 -
Voter turnout:
64%
Language spoken most often at home:
-
English:
71,230 -
French:
19,325 -
Indigenous language:
10 -
Most popular other language:
-
Spanish:
90
-
-
All others:
710
-