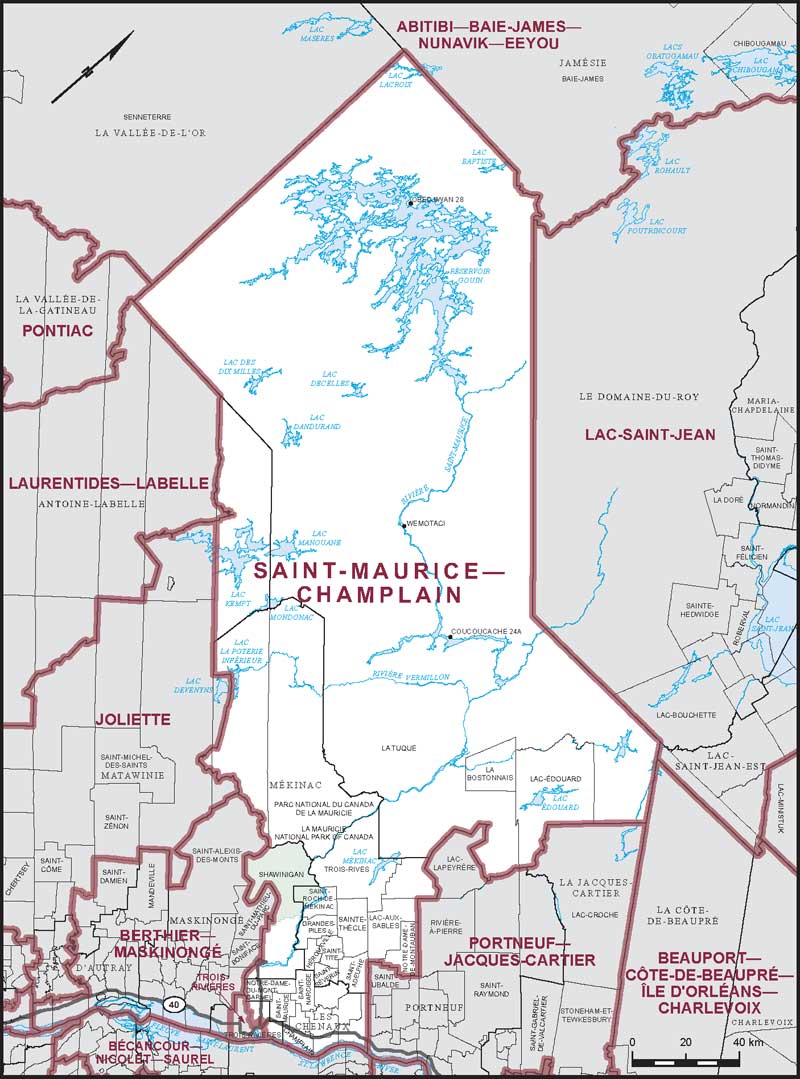
Electoral District:
Saint-Maurice—Champlain
Province/Territory:
Québec
-
Population:
111,997 -
Area:
34,187 km² -
Population density:
3.00/km² -
Population change:
n/a -
Average age:
47 -
Average income:
$43,040 -
Voter turnout:
66%
Language spoken most often at home:
-
English:
865 -
French:
105,350 -
Indigenous language:
2,320 -
Most popular other language:
-
Spanish:
230
-
-
All others:
330