Federal Electoral District Fact Sheets
-
Electoral District:
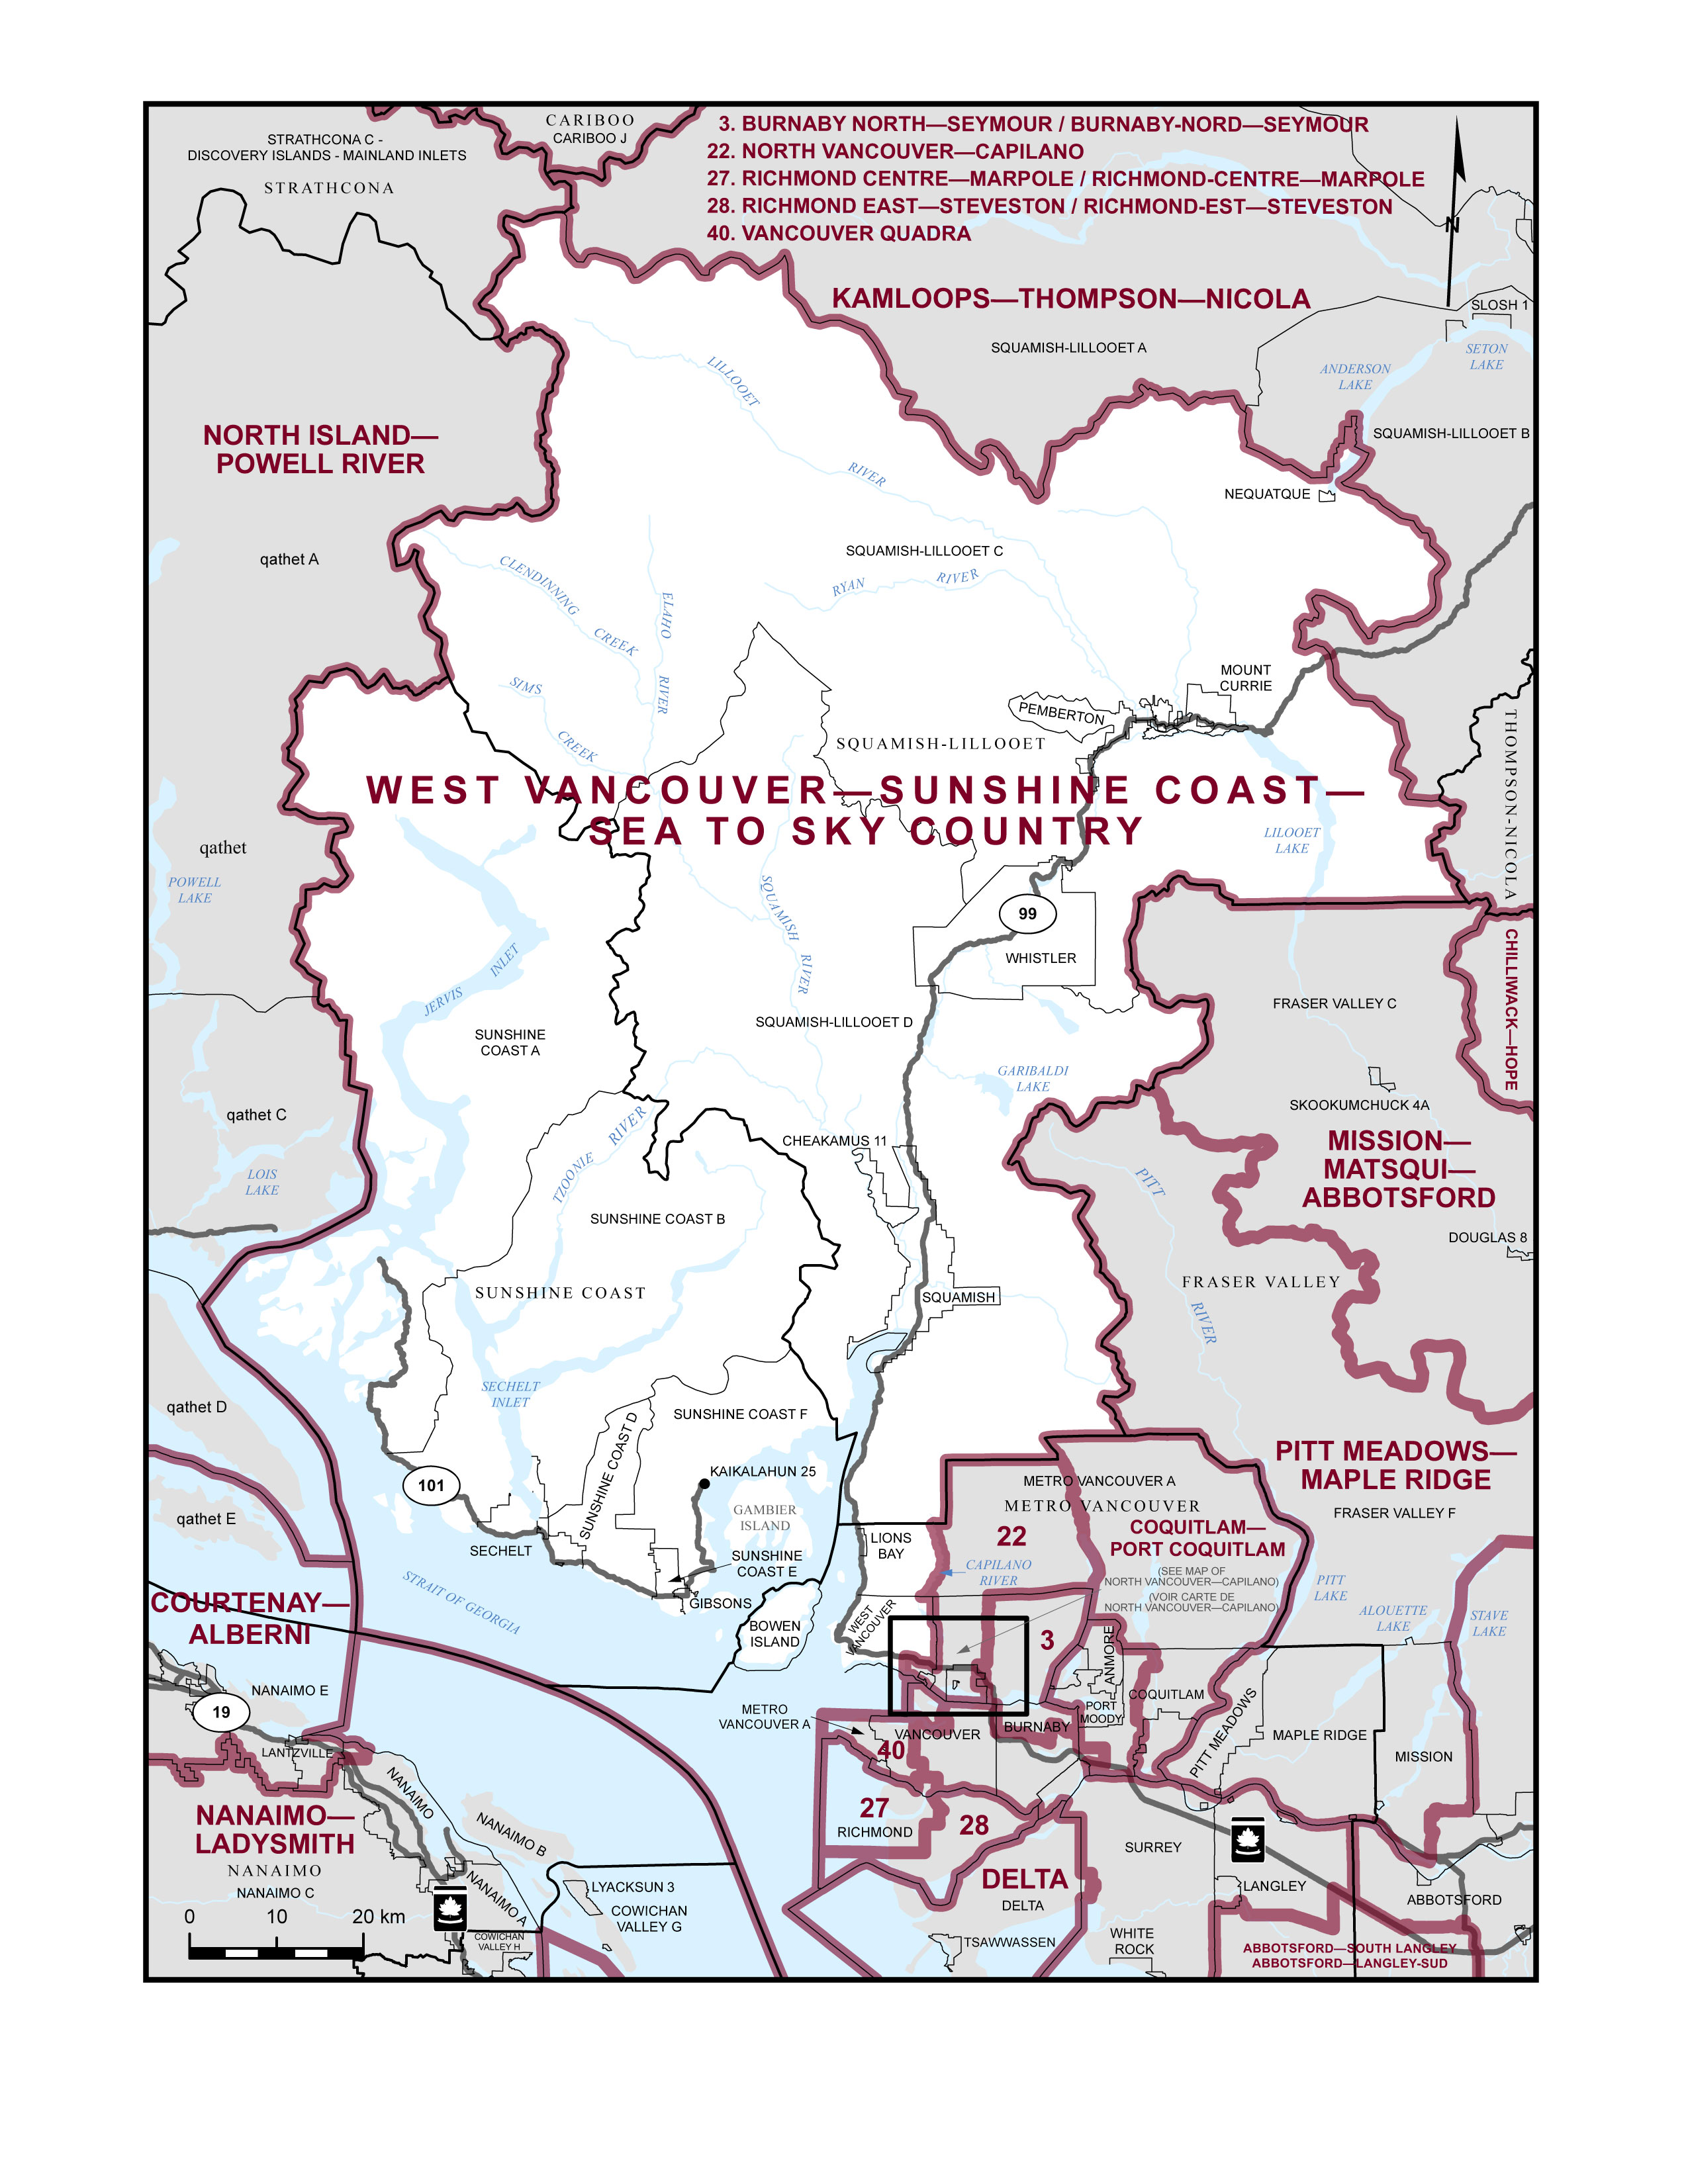
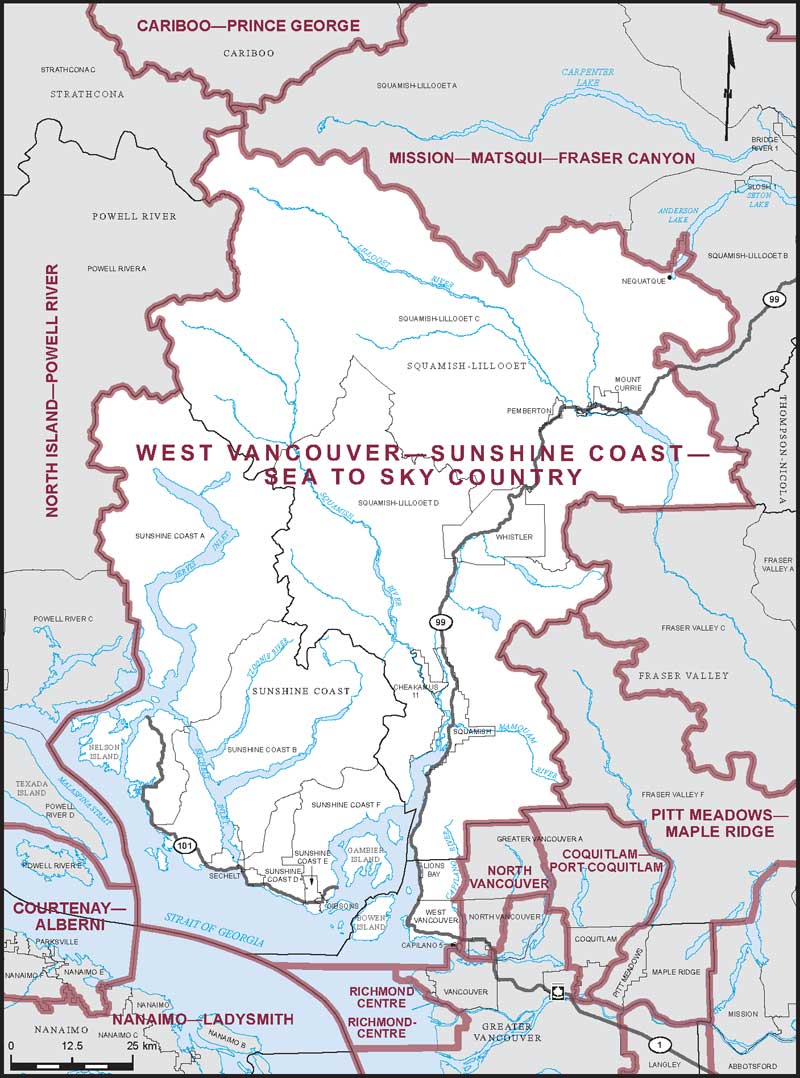
West Vancouver—Sunshine Coast—Sea to Sky CountryProvince/Territory:
British Columbia-
Population:
114,257 -
Area:
12,984 km² -
Population density:
9.00/km² -
Population change:
n/a -
Average age:
44 -
Average income:
$73,200 -
Voter turnout:
71%
Language spoken most often at home:
-
English:
98,945 -
French:
970 -
Indigenous language:
15 -
Most popular other language:
-
Mandarin:
3,635
-
-
All others:
7,650
-
-
Electoral District:
YellowheadProvince/Territory:
Alberta-
Population:
115,086 -
Area:
83,610 km² -
Population density:
1.00/km² -
Population change:
n/a -
Average age:
41 -
Average income:
$70,700 -
Voter turnout:
74%
Language spoken most often at home:
-
English:
106,335 -
French:
1,100 -
Indigenous language:
150 -
Most popular other language:
-
Tagalog (Pilipino, Filipino):
1,100
-
-
All others:
3,605

-
-
Electoral District:
St. Albert—Sturgeon RiverProvince/Territory:
Alberta-
Population:
121,306 -
Area:
4,392 km² -
Population density:
28.00/km² -
Population change:
n/a -
Average age:
41 -
Average income:
$65,600 -
Voter turnout:
77%
Language spoken most often at home:
-
English:
114,665 -
French:
1,010 -
Indigenous language:
80 -
Most popular other language:
-
Tagalog (Pilipino, Filipino):
705
-
-
All others:
2,255

-
-
Electoral District:
Sherwood Park—Fort SaskatchewanProvince/Territory:
Alberta-
Population:
126,313 -
Area:
1,227 km² -
Population density:
103.00/km² -
Population change:
n/a -
Average age:
41 -
Average income:
$70,700 -
Voter turnout:
78%
Language spoken most often at home:
-
English:
118,605 -
French:
635 -
Indigenous language:
5 -
Most popular other language:
-
Tagalog (Pilipino, Filipino):
1,070
-
-
All others:
3,045

-
-
Electoral District:
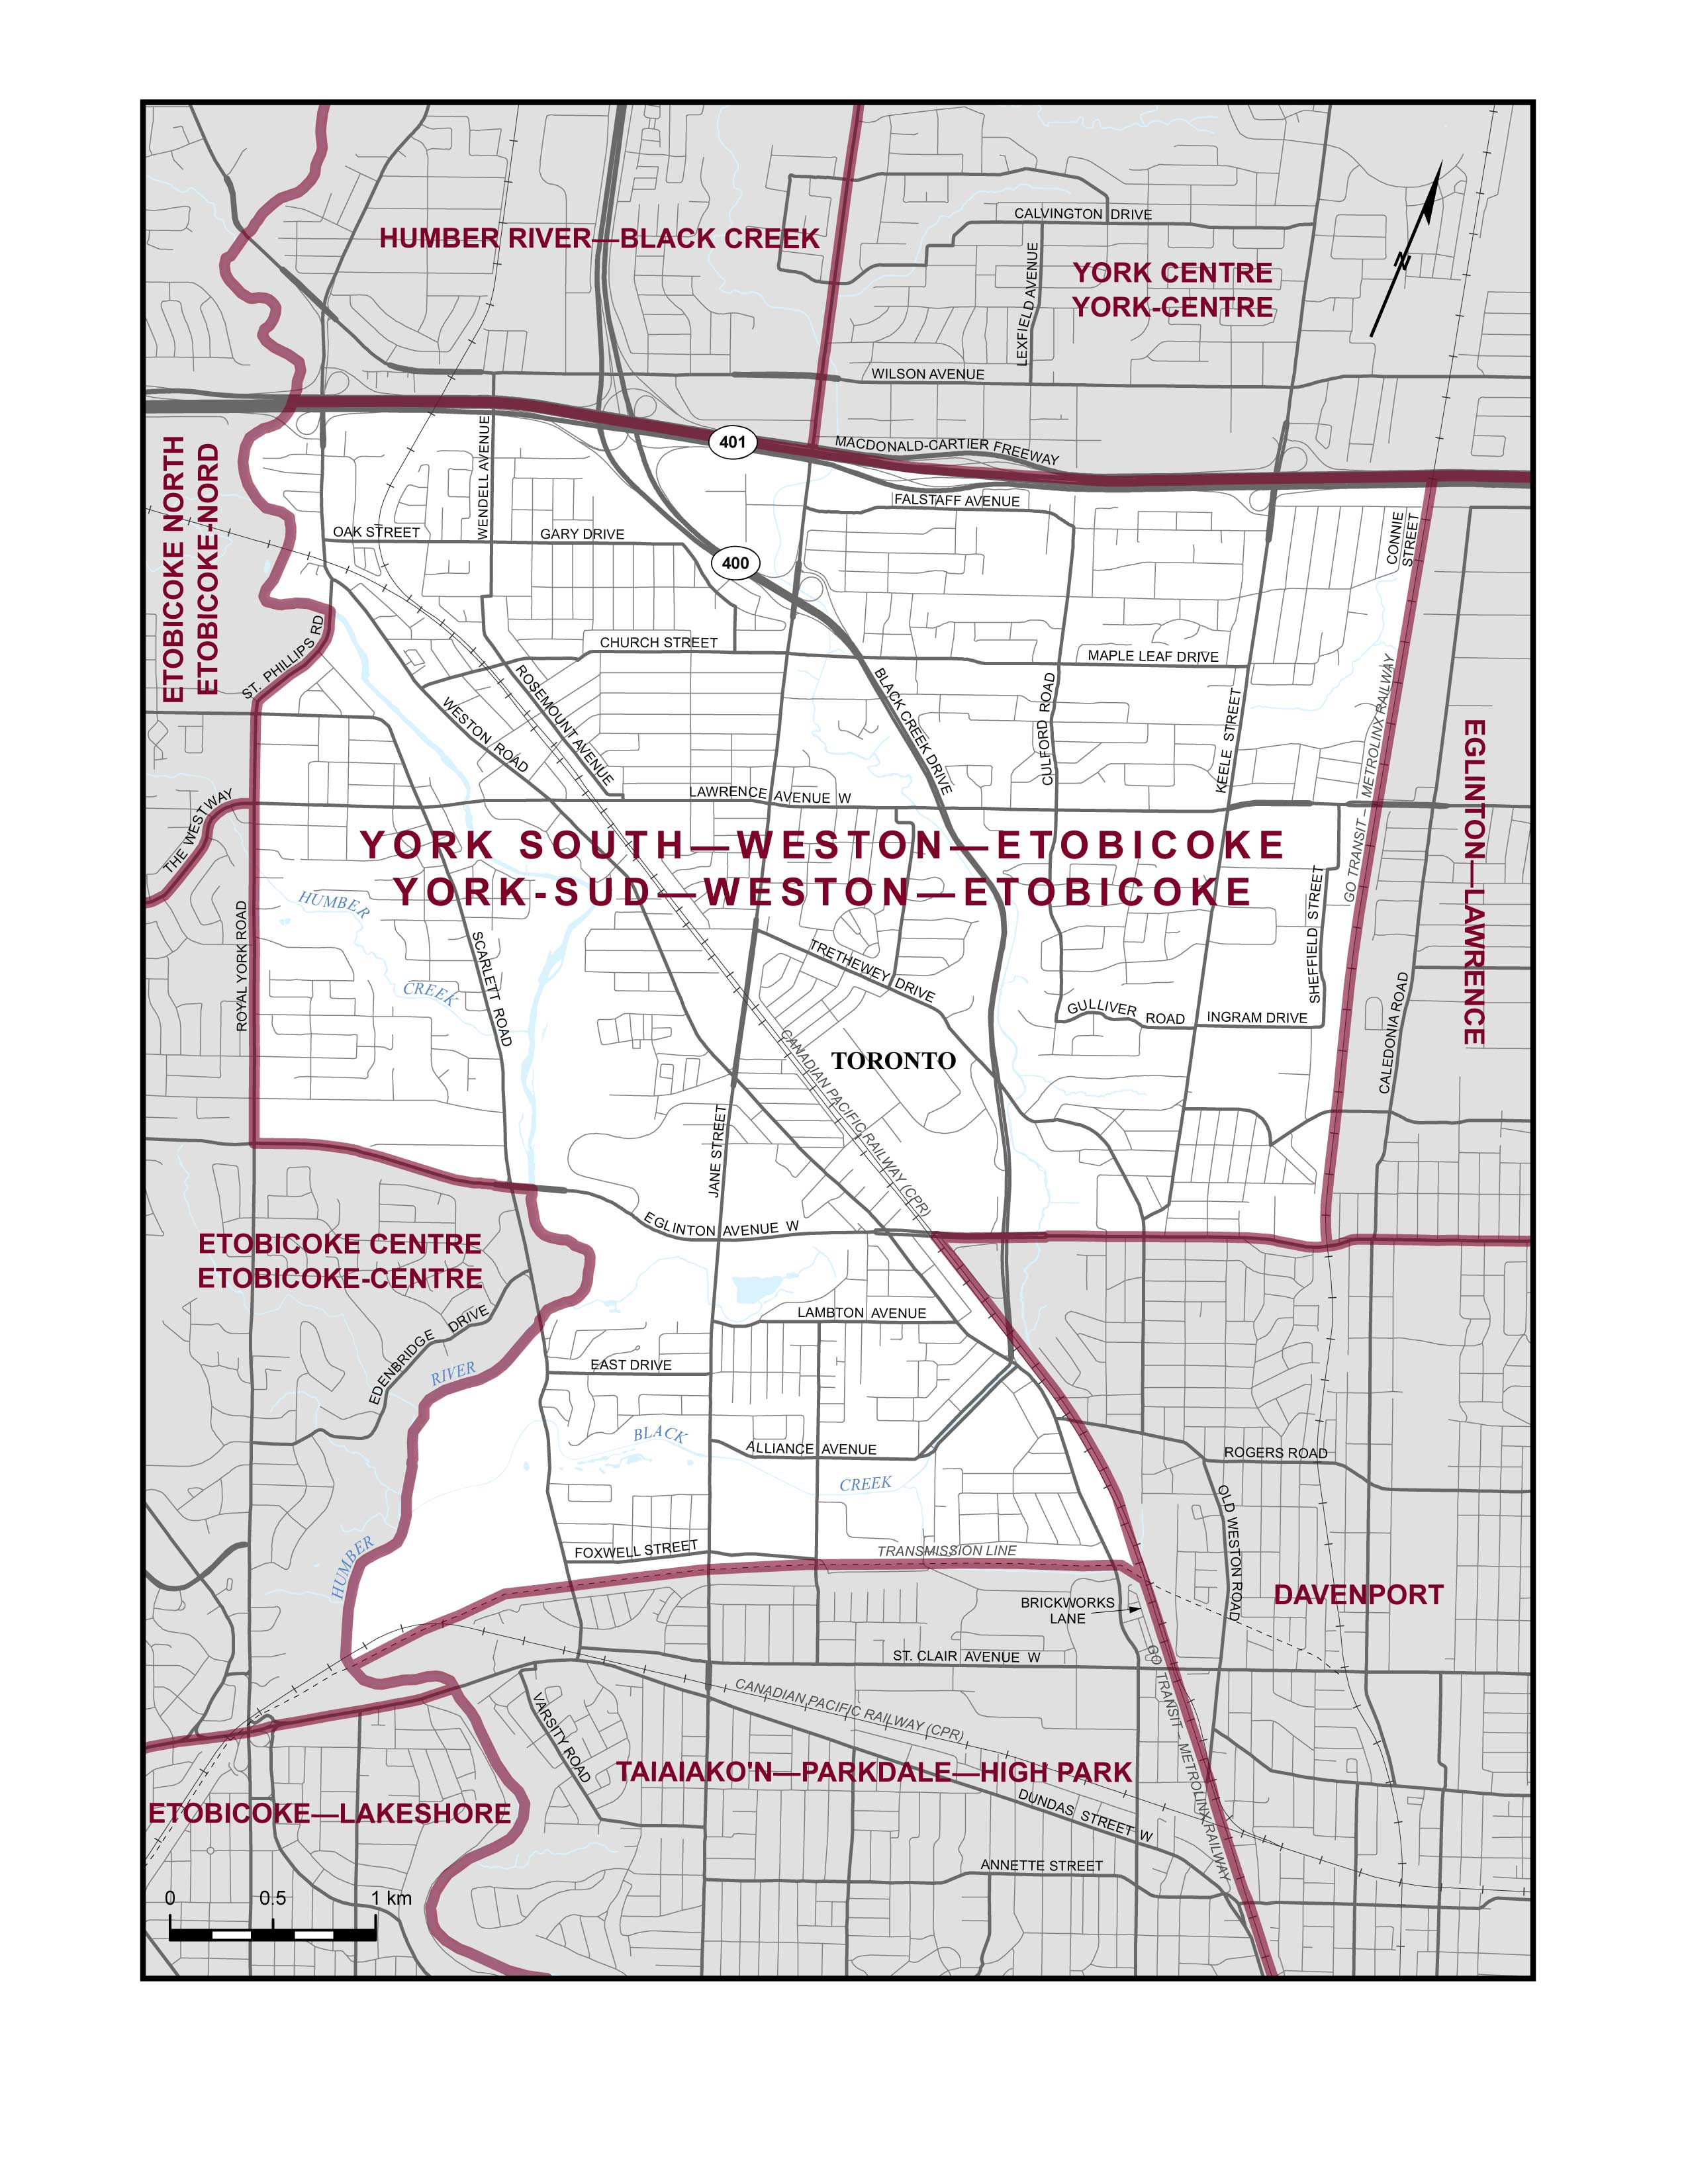
York South—Weston—EtobicokeProvince/Territory:
Ontario-
Population:
111,369 -
Area:
24 km² -
Population density:
4,640.00/km² -
Population change:
n/a -
Average age:
42 -
Average income:
$44,880 -
Voter turnout:
58%
Language spoken most often at home:
-
English:
72,815 -
French:
350 -
Indigenous language:
0 -
Most popular other language:
-
Spanish:
5,385
-
-
All others:
23,600
-
-
Electoral District:
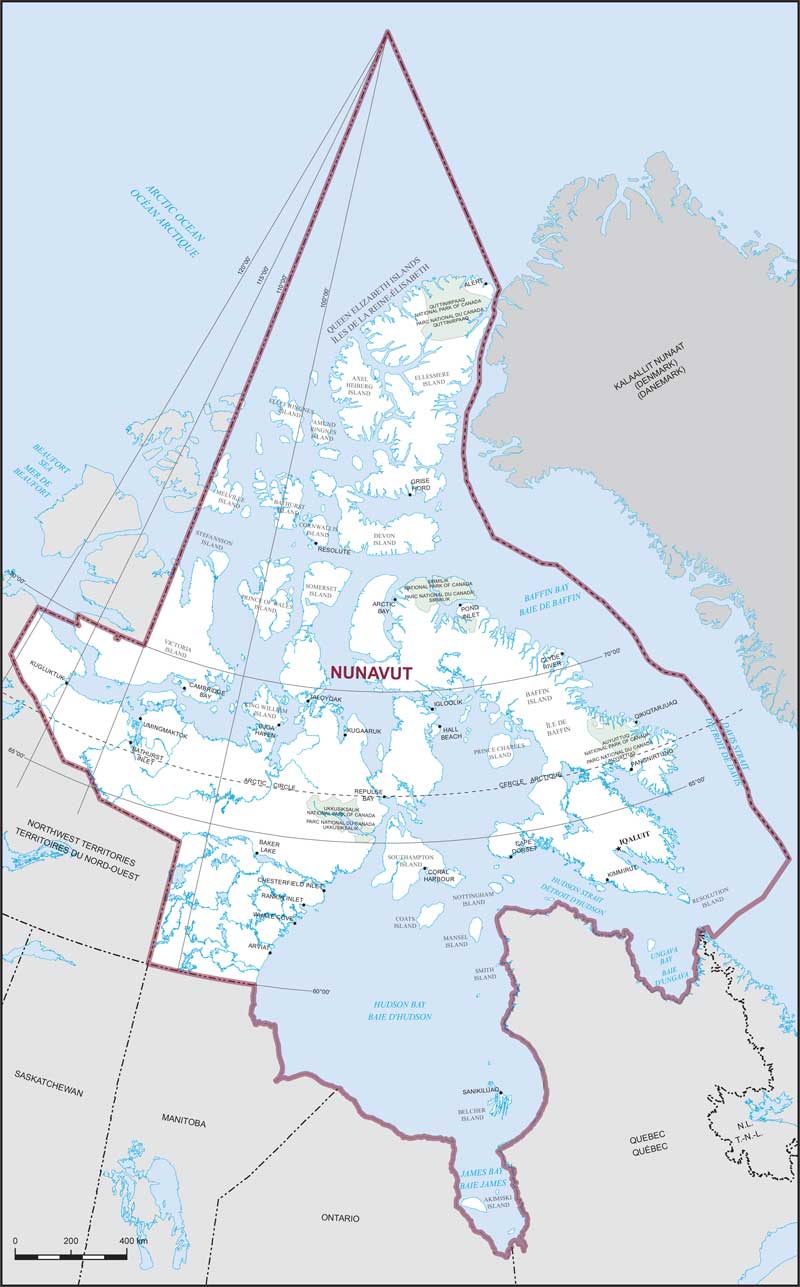
NunavutProvince/Territory:
Nunavut-
Population:
36,858 -
Area:
1,836,994 km² -
Population density:
0.02/km² -
Population change:
+2.5% -
Average age:
28 -
Average income:
$57,200 -
Voter turnout:
35%
Language spoken most often at home:
-
English:
17,055 -
French:
340 -
Indigenous language:
15,190 -
Most popular other language:
-
Tagalog (Pilipino, Filipino):
100
-
-
All others:
190
-
-
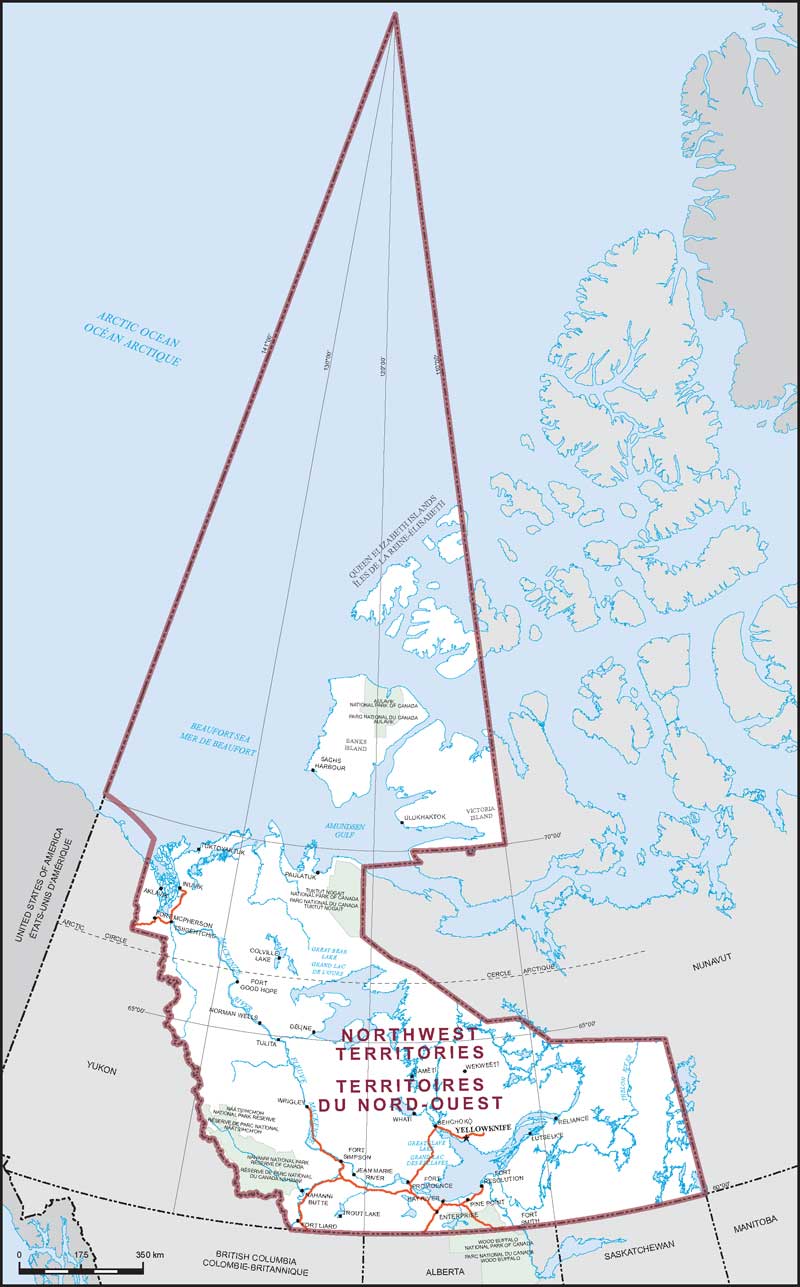
Electoral District:
Northwest TerritoriesProvince/Territory:
Northwest Territories-
Population:
41,070 -
Area:
1,127,712 km² -
Population density:
0.04/km² -
Population change:
-2% -
Average age:
36 -
Average income:
$69,400 -
Voter turnout:
55%
Language spoken most often at home:
-
English:
35,340 -
French:
620 -
Indigenous language:
1,665 -
Most popular other language:
-
Tagalog (Pilipino, Filipino):
465
-
-
All others:
1,215
-
-
Electoral District:
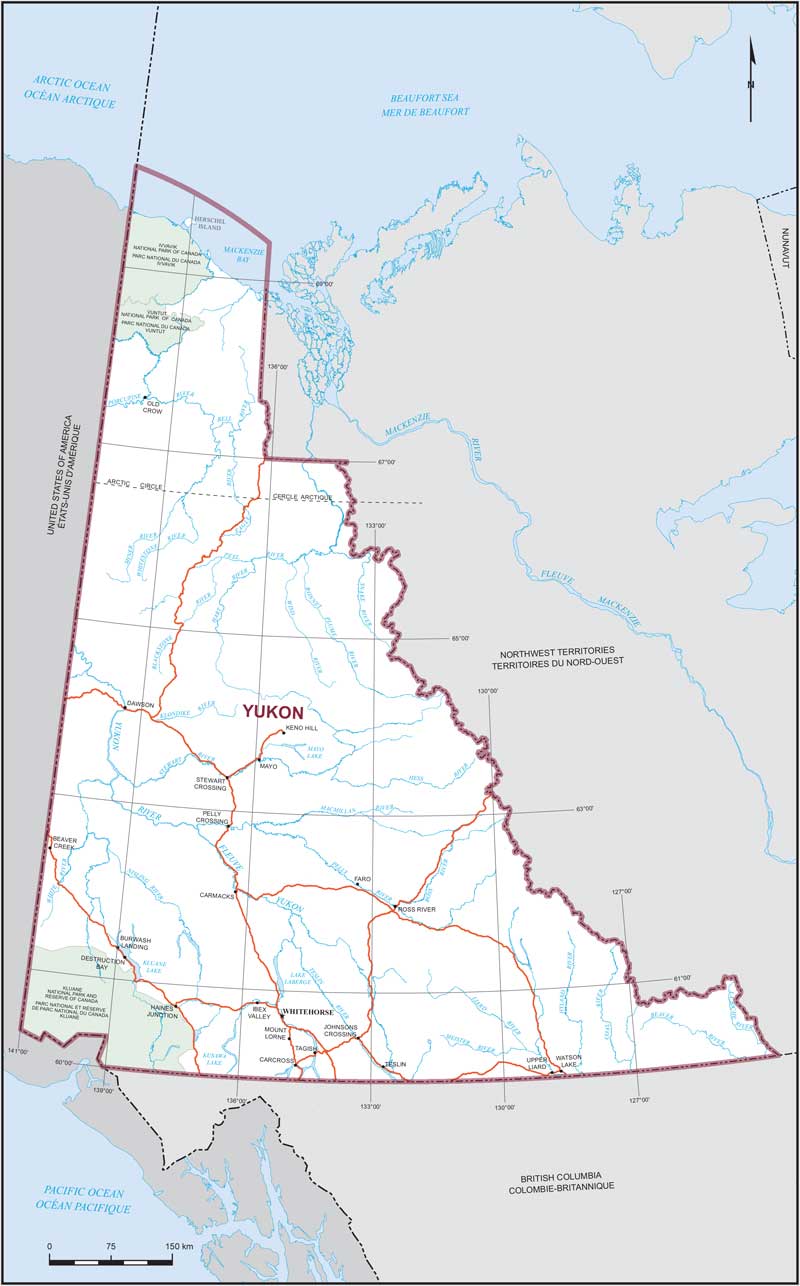
YukonProvince/Territory:
Yukon-
Population:
40,232 -
Area:
472,345 km² -
Population density:
0.10/km² -
Population change:
12% -
Average age:
40 -
Average income:
$64,200 -
Voter turnout:
73%
Language spoken most often at home:
-
English:
35,685 -
French:
1,035 -
Indigenous language:
30 -
Most popular other language:
-
Tagalog (Pilipino, Filipino):
645
-
-
All others:
1,555
-
-
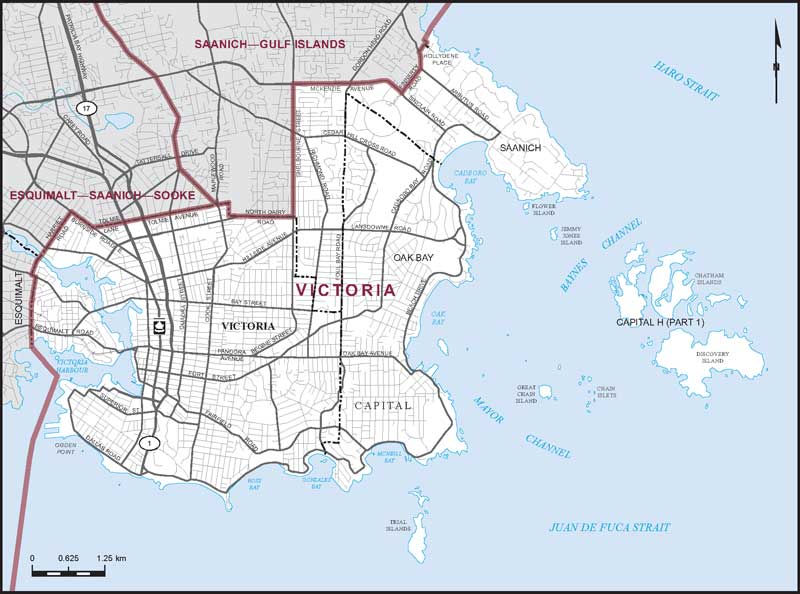
Electoral District:
VictoriaProvince/Territory:
British Columbia-
Population:
123,482 -
Area:
40 km² -
Population density:
3,087.00/km² -
Population change:
n/a -
Average age:
46 -
Average income:
$59,850 -
Voter turnout:
74%
Language spoken most often at home:
-
English:
109,890 -
French:
615 -
Indigenous language:
10 -
Most popular other language:
-
Mandarin:
1,370
-
-
All others:
6,200
-
-
Electoral District:
Vernon—Lake Country—MonasheeProvince/Territory:
British Columbia-
Population:
108,606 -
Area:
14,658 km² -
Population density:
7.00/km² -
Population change:
n/a -
Average age:
47 -
Average income:
$50,760 -
Voter turnout:
73%
Language spoken most often at home:
-
English:
103,225 -
French:
260 -
Indigenous language:
5 -
Most popular other language:
-
Punjabi (Panjabi):
610
-
-
All others:
2,330
-
-
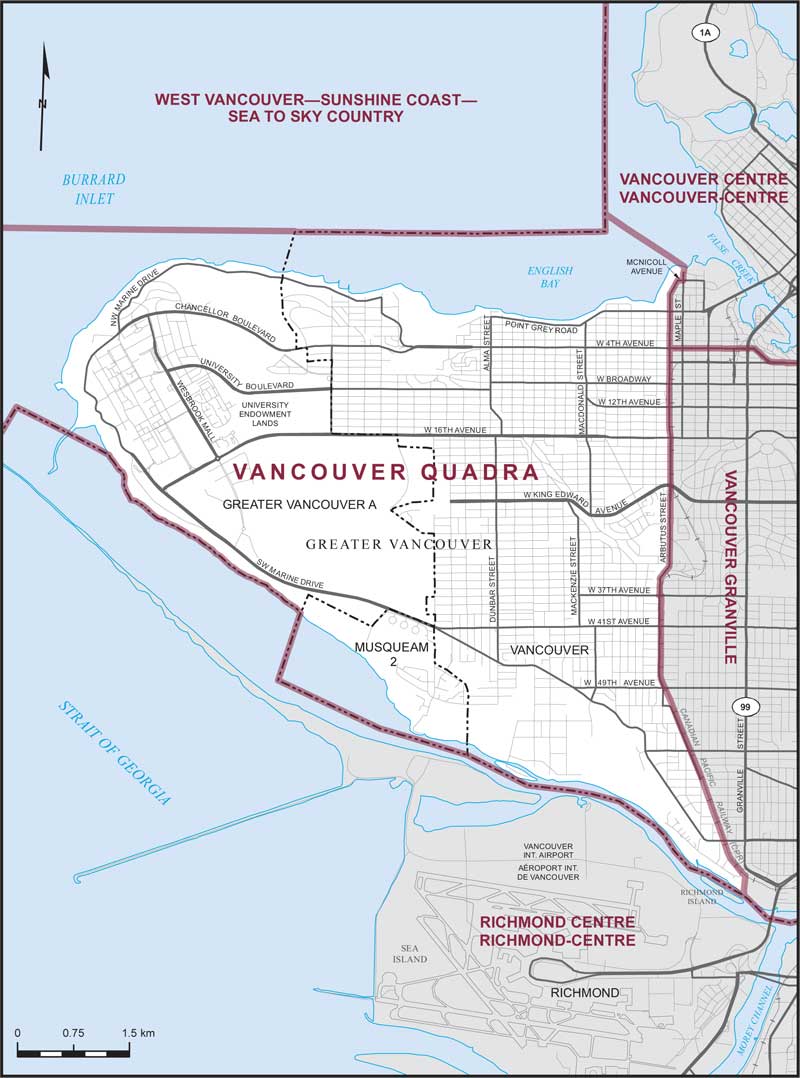
Electoral District:
Vancouver QuadraProvince/Territory:
British Columbia-
Population:
114,779 -
Area:
42 km² -
Population density:
2,733.00/km² -
Population change:
n/a -
Average age:
42 -
Average income:
$79,100 -
Voter turnout:
69%
Language spoken most often at home:
-
English:
82,085 -
French:
785 -
Indigenous language:
0 -
Most popular other language:
-
Mandarin:
13,690
-
-
All others:
12,185
-
-
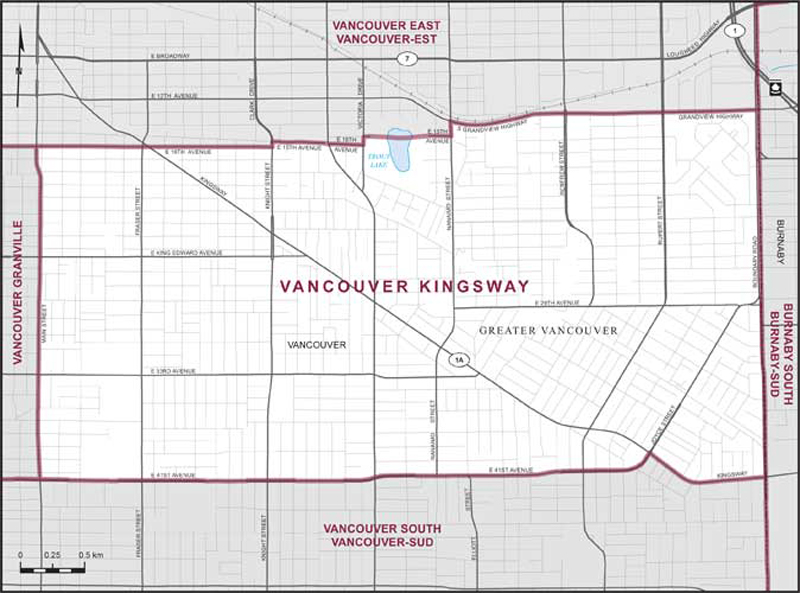
Electoral District:
Vancouver KingswayProvince/Territory:
British Columbia-
Population:
116,499 -
Area:
17 km² -
Population density:
6,853.00/km² -
Population change:
n/a -
Average age:
42 -
Average income:
$48,560 -
Voter turnout:
63%
Language spoken most often at home:
-
English:
67,525 -
French:
390 -
Indigenous language:
5 -
Most popular other language:
-
Yue (Cantonese):
16,715
-
-
All others:
22,190
-
-
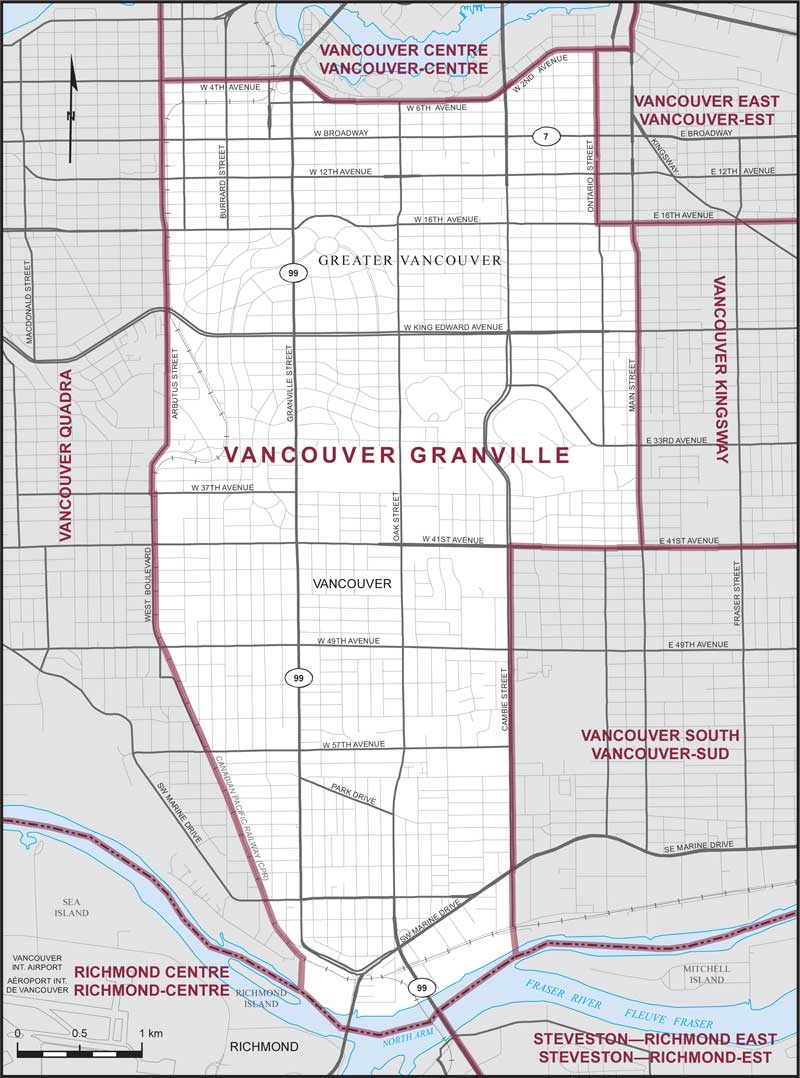
Electoral District:
Vancouver GranvilleProvince/Territory:
British Columbia-
Population:
116,798 -
Area:
24 km² -
Population density:
4,867.00/km² -
Population change:
n/a -
Average age:
43 -
Average income:
$70,700 -
Voter turnout:
69%
Language spoken most often at home:
-
English:
82,705 -
French:
745 -
Indigenous language:
0 -
Most popular other language:
-
Mandarin:
7,205
-
-
All others:
18,900
-
-
Electoral District:
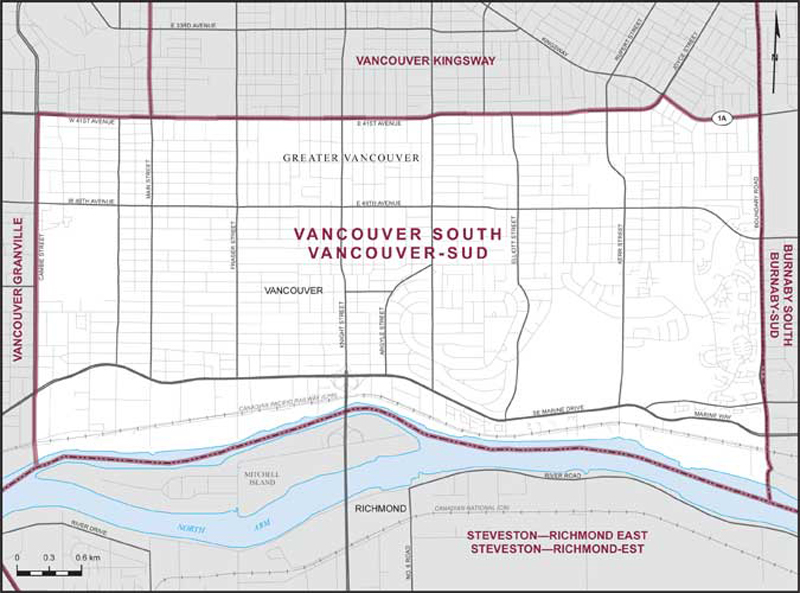
Vancouver Fraserview—South BurnabyProvince/Territory:
British Columbia-
Population:
117,482 -
Area:
32 km² -
Population density:
3,671.00/km² -
Population change:
n/a -
Average age:
43 -
Average income:
$47,320 -
Voter turnout:
62%
Language spoken most often at home:
-
English:
60,185 -
French:
245 -
Indigenous language:
0 -
Most popular other language:
-
Yue (Cantonese):
16,850
-
-
All others:
29,105
-
-
Electoral District:
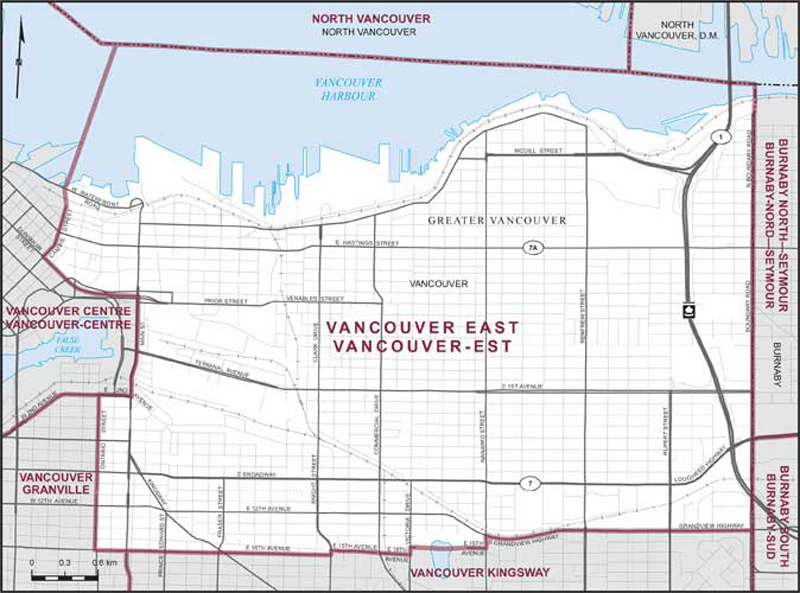
Vancouver EastProvince/Territory:
British Columbia-
Population:
118,675 -
Area:
22 km² -
Population density:
5,394.00/km² -
Population change:
n/a -
Average age:
42 -
Average income:
$55,100 -
Voter turnout:
63%
Language spoken most often at home:
-
English:
88,815 -
French:
685 -
Indigenous language:
40 -
Most popular other language:
-
Yue (Cantonese):
9,985
-
-
All others:
11,500
-
-
Electoral District:
Vancouver CentreProvince/Territory:
British Columbia-
Population:
115,964 -
Area:
10 km² -
Population density:
11,596.00/km² -
Population change:
n/a -
Average age:
42 -
Average income:
$69,800 -
Voter turnout:
63%
Language spoken most often at home:
-
English:
85,875 -
French:
1,155 -
Indigenous language:
5 -
Most popular other language:
-
Iranian Persian:
3,795
-
-
All others:
18,610
-