Federal Electoral District Fact Sheets
-
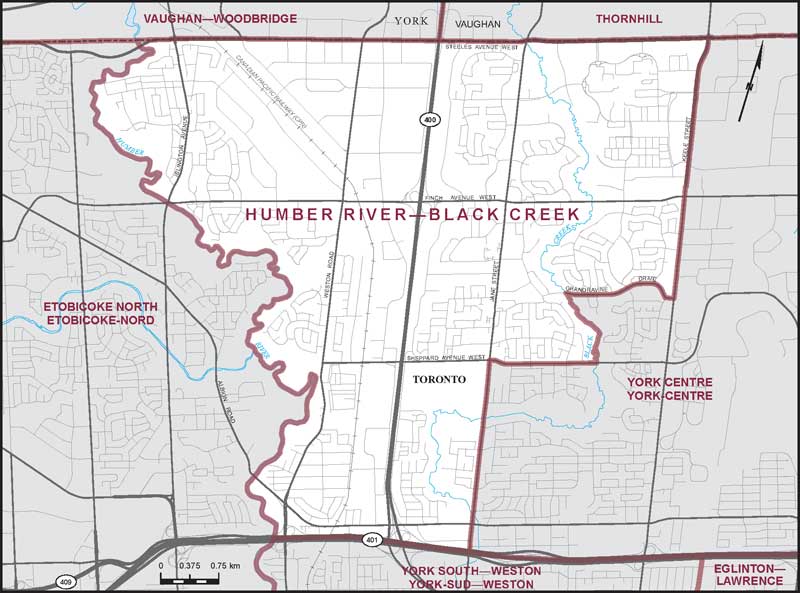
Electoral District:
York—DurhamProvince/Territory:
Ontario-
Population:
116,560 -
Area:
1,812 km² -
Population density:
64.00/km² -
Population change:
n/a -
Average age:
44 -
Average income:
$59,300 -
Voter turnout:
73%
Language spoken most often at home:
-
English:
107,725 -
French:
225 -
Indigenous language:
0 -
Most popular other language:
-
Mandarin:
1,115
-
-
All others:
4,600
-
-
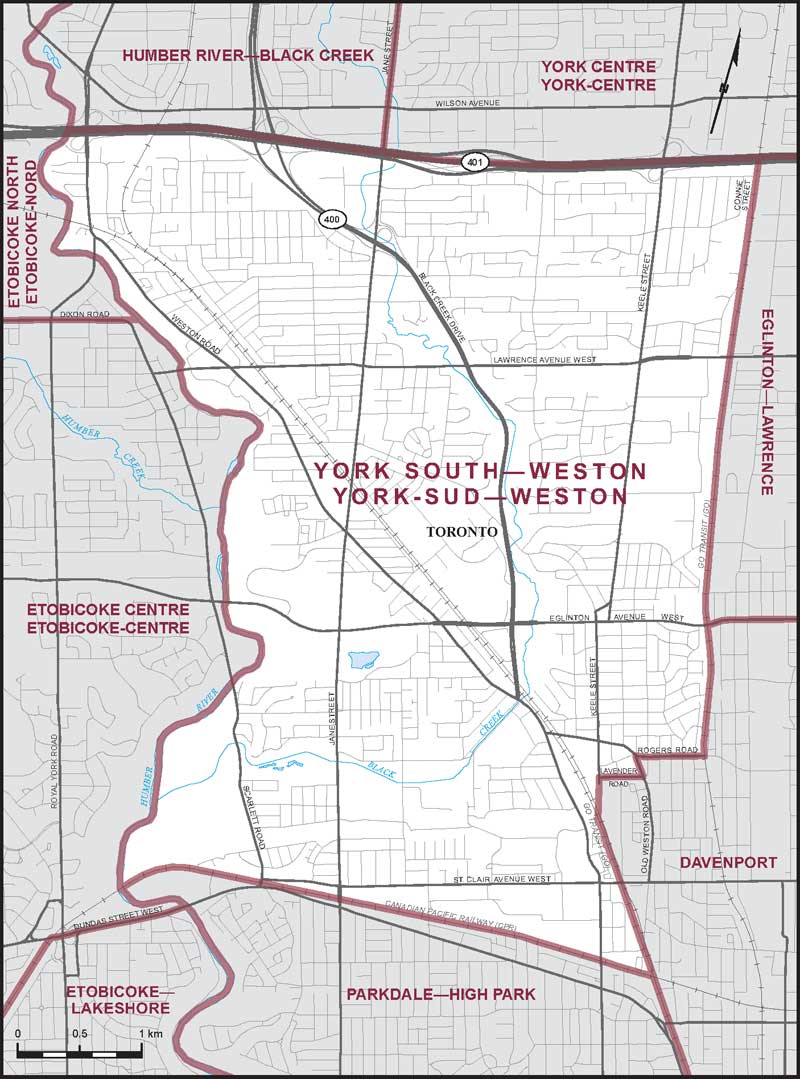
Electoral District:
York CentreProvince/Territory:
Ontario-
Population:
108,307 -
Area:
35 km² -
Population density:
3,094.00/km² -
Population change:
n/a -
Average age:
42 -
Average income:
$50,440 -
Voter turnout:
64%
Language spoken most often at home:
-
English:
62,985 -
French:
300 -
Indigenous language:
0 -
Most popular other language:
-
Tagalog (Pilipino, Filipino):
7,600
-
-
All others:
27,515
-
-
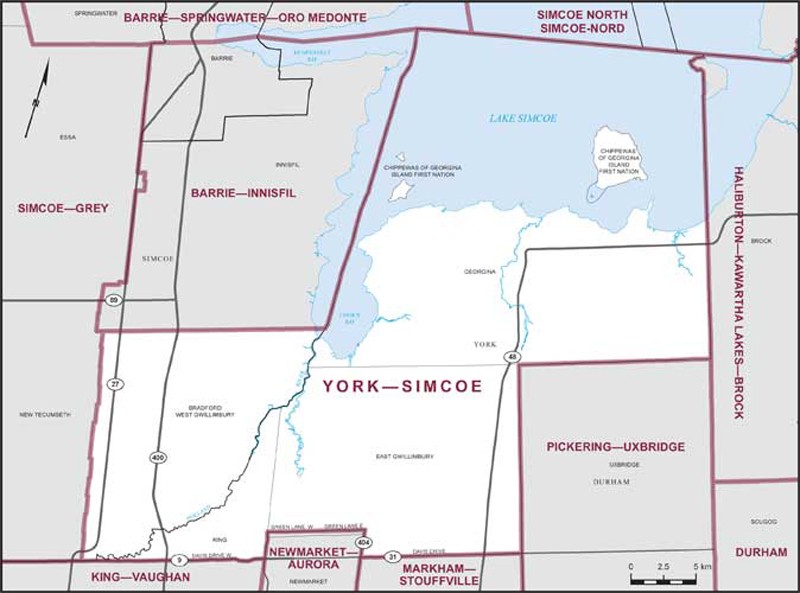
Electoral District:
Windsor WestProvince/Territory:
Ontario-
Population:
130,162 -
Area:
78 km² -
Population density:
1,669.00/km² -
Population change:
n/a -
Average age:
40 -
Average income:
$44,080 -
Voter turnout:
58%
Language spoken most often at home:
-
English:
94,405 -
French:
660 -
Indigenous language:
0 -
Most popular other language:
-
Arabic:
7,015
-
-
All others:
18,765
-
-
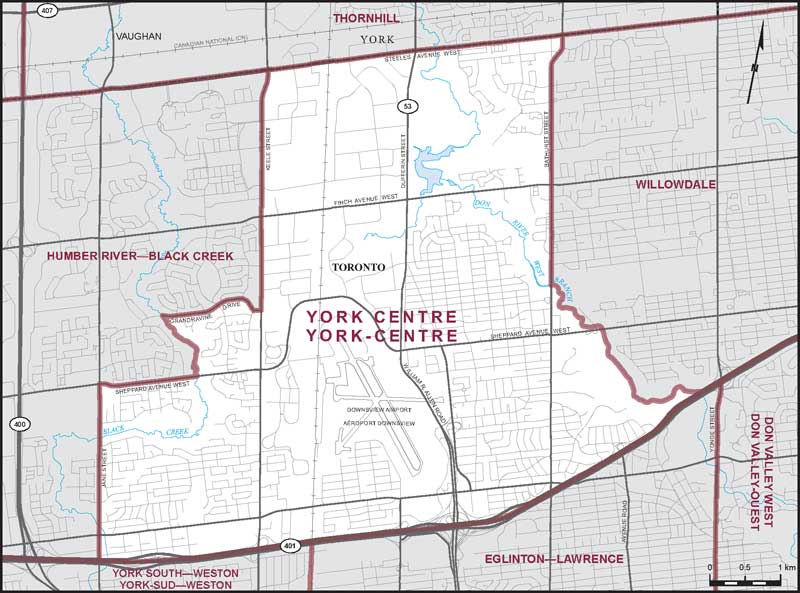
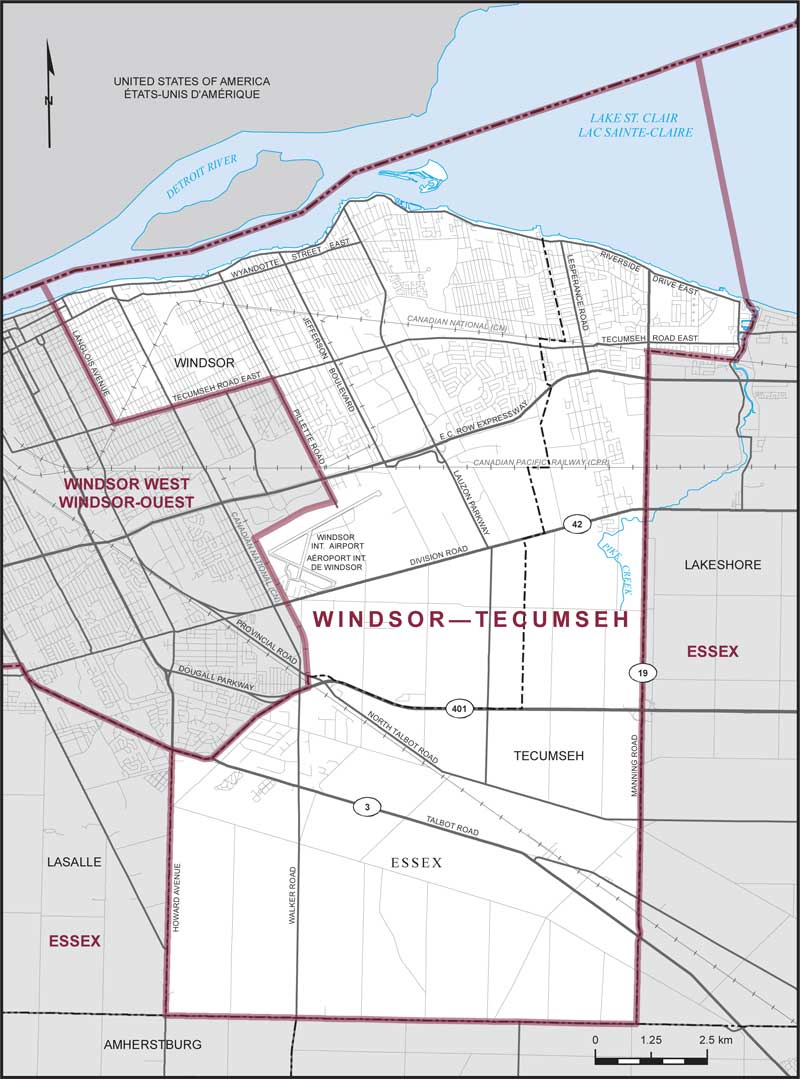
Electoral District:
Windsor—Tecumseh—LakeshoreProvince/Territory:
Ontario-
Population:
131,097 -
Area:
218 km² -
Population density:
601.00/km² -
Population change:
n/a -
Average age:
43 -
Average income:
$51,300 -
Voter turnout:
67%
Language spoken most often at home:
-
English:
108,740 -
French:
1,015 -
Indigenous language:
0 -
Most popular other language:
-
Arabic:
3,130
-
-
All others:
11,700
-
-
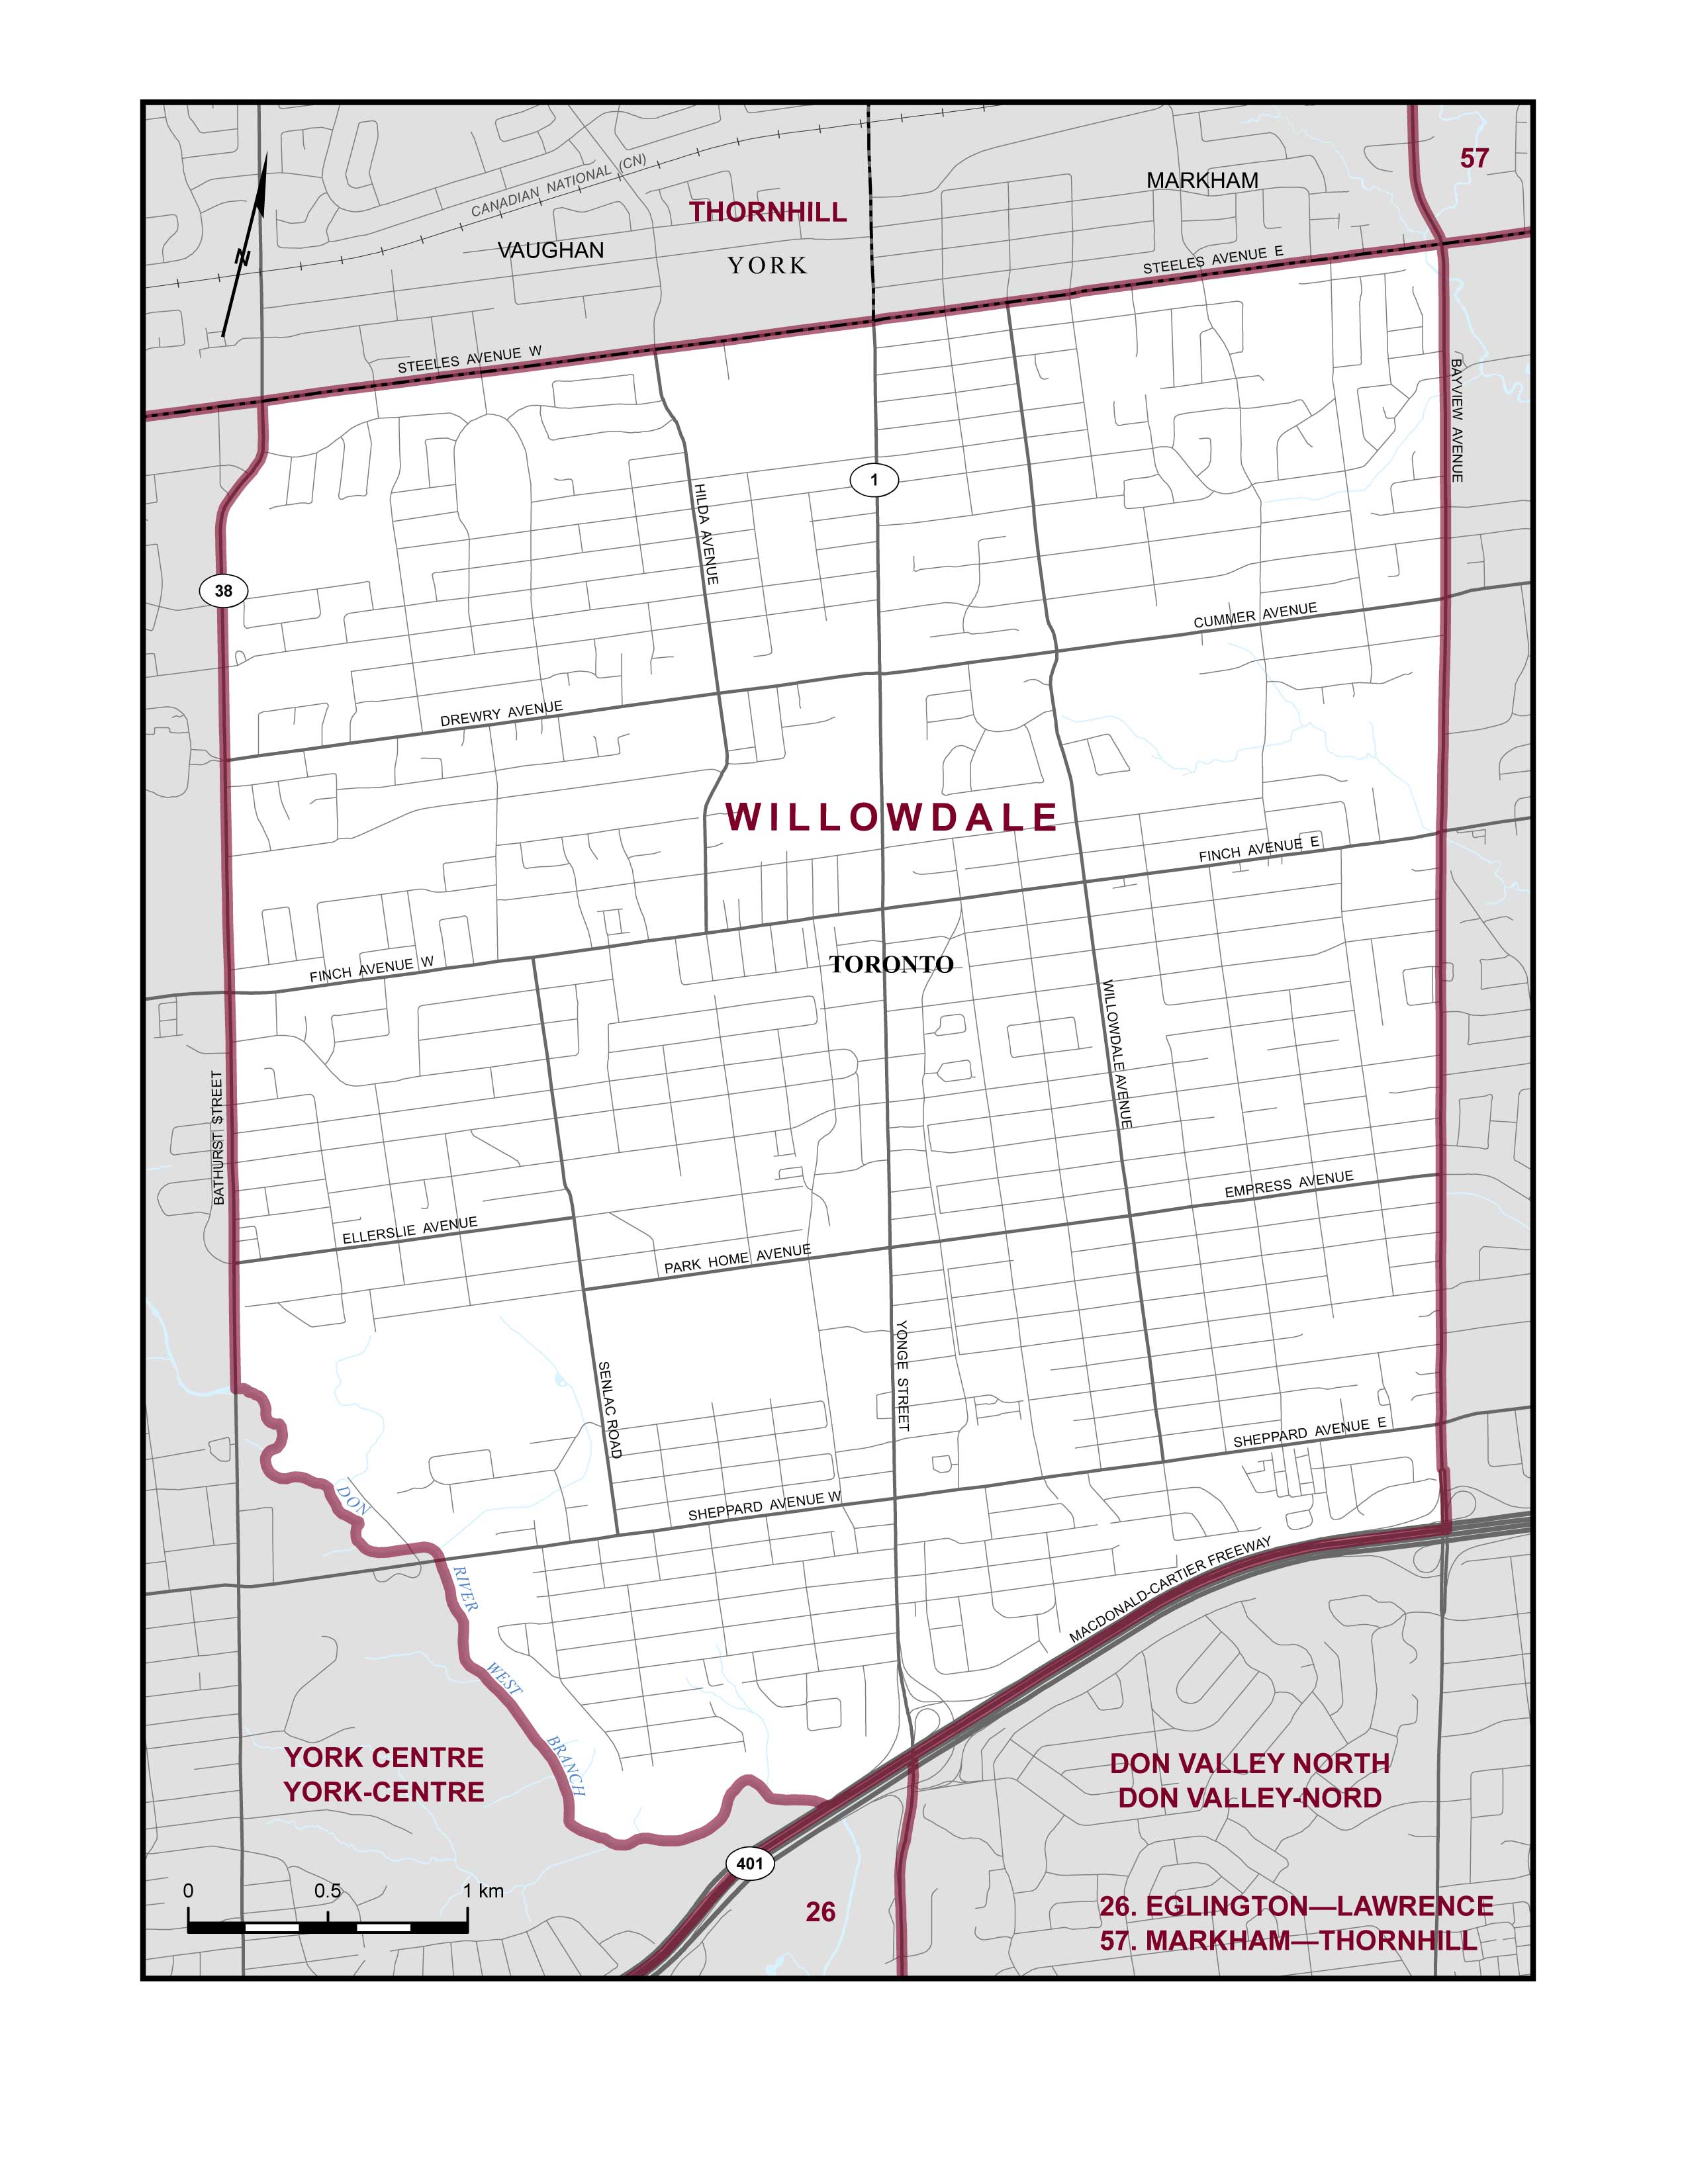
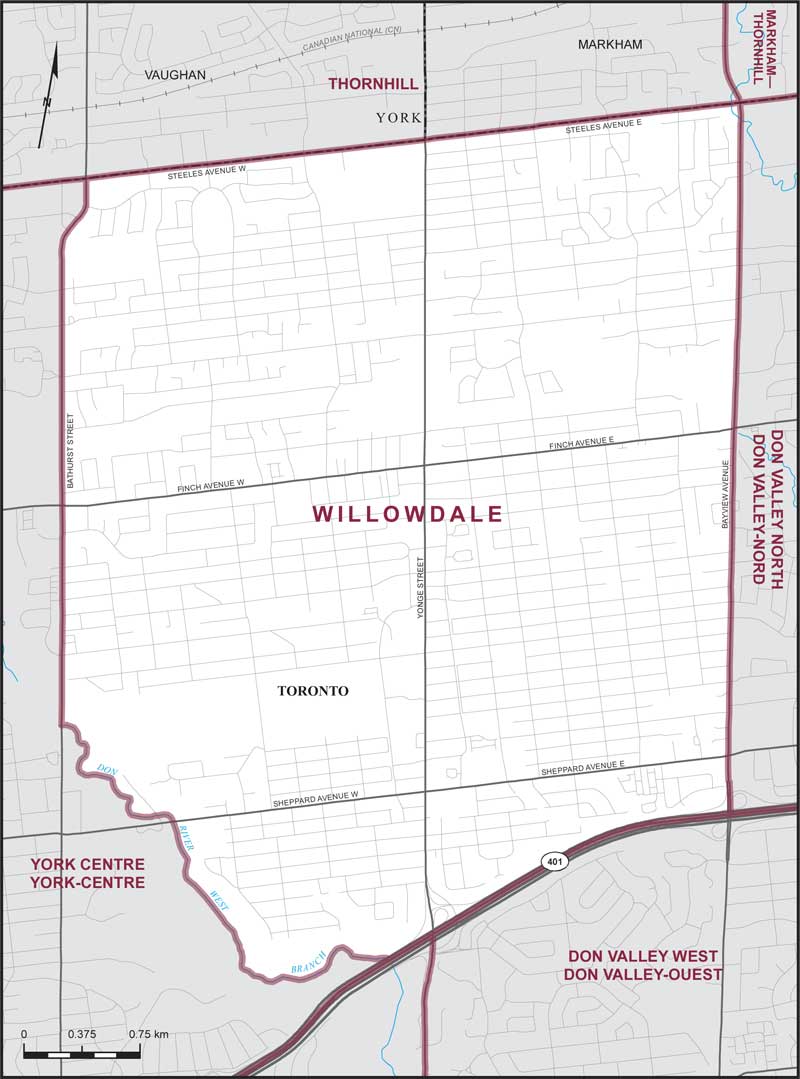
Electoral District:
WillowdaleProvince/Territory:
Ontario-
Population:
118,218 -
Area:
20 km² -
Population density:
5,911.00/km² -
Population change:
n/a -
Average age:
42 -
Average income:
$55,050 -
Voter turnout:
61%
Language spoken most often at home:
-
English:
56,100 -
French:
370 -
Indigenous language:
0 -
Most popular other language:
-
Mandarin:
11,425
-
-
All others:
39,430
-
-
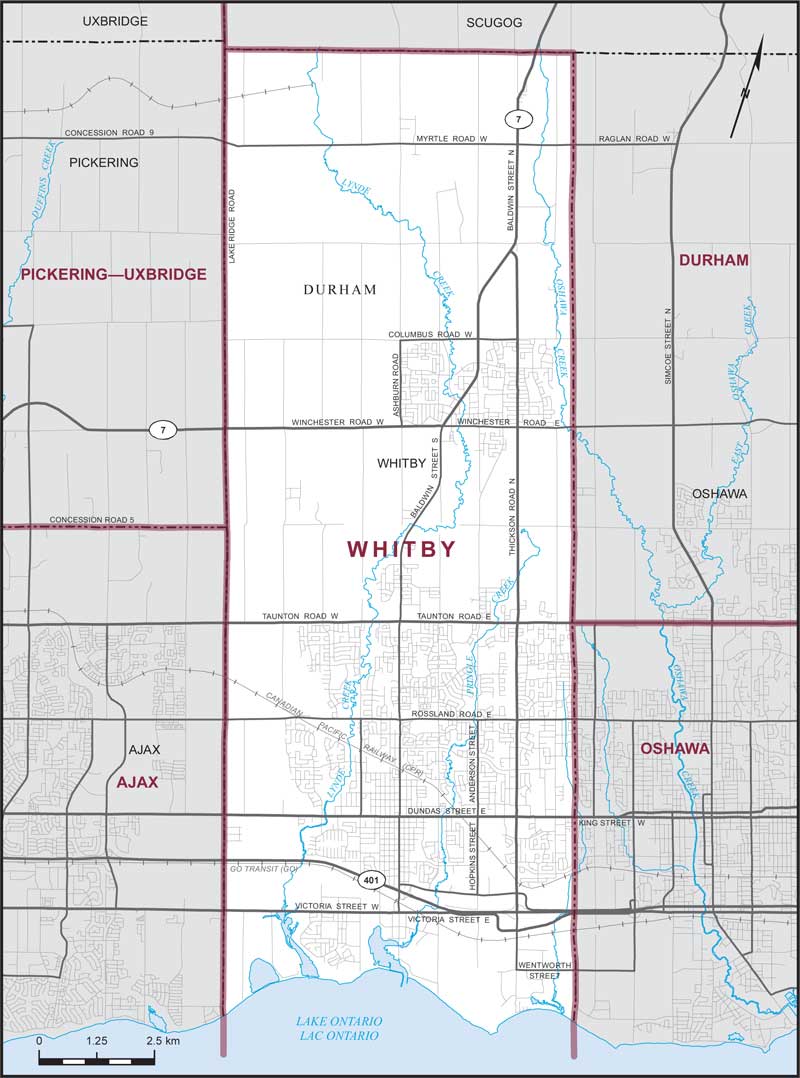
Electoral District:
WhitbyProvince/Territory:
Ontario-
Population:
115,257 -
Area:
88 km² -
Population density:
1,310.00/km² -
Population change:
n/a -
Average age:
40 -
Average income:
$60,700 -
Voter turnout:
72%
Language spoken most often at home:
-
English:
95,885 -
French:
610 -
Indigenous language:
0 -
Most popular other language:
-
Tamil:
1,575
-
-
All others:
10,625
-
-
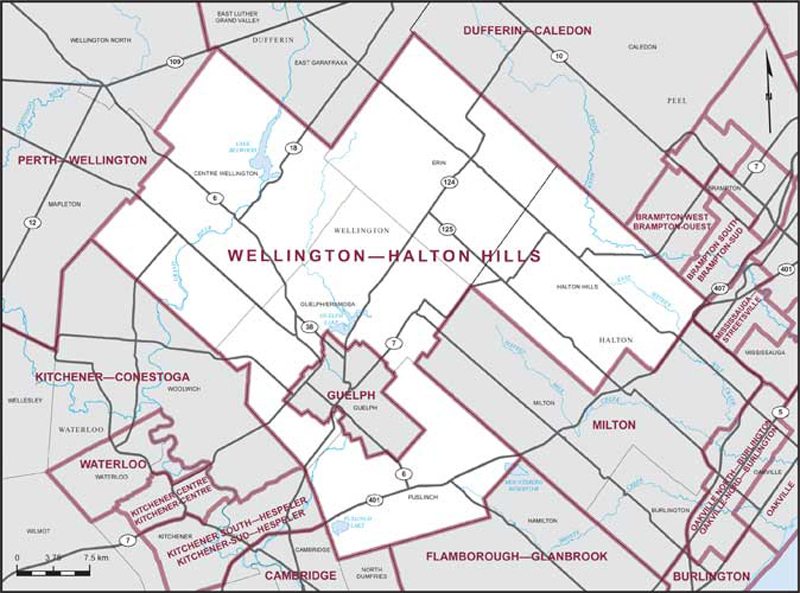
Electoral District:
Wellington—Halton Hills NorthProvince/Territory:
Ontario-
Population:
105,468 -
Area:
1,370 km² -
Population density:
77.00/km² -
Population change:
n/a -
Average age:
42 -
Average income:
$64,700 -
Voter turnout:
76%
Language spoken most often at home:
-
English:
95,900 -
French:
255 -
Indigenous language:
0 -
Most popular other language:
-
Punjabi (Panjabi):
1,010
-
-
All others:
5,315
-
-
Electoral District:
WaterlooProvince/Territory:
Ontario-
Population:
121,436 -
Area:
64 km² -
Population density:
1,897.00/km² -
Population change:
n/a -
Average age:
39 -
Average income:
$60,250 -
Voter turnout:
73%
Language spoken most often at home:
-
English:
92,950 -
French:
325 -
Indigenous language:
0 -
Most popular other language:
-
Mandarin:
5,555
-
-
All others:
15,210
-
-
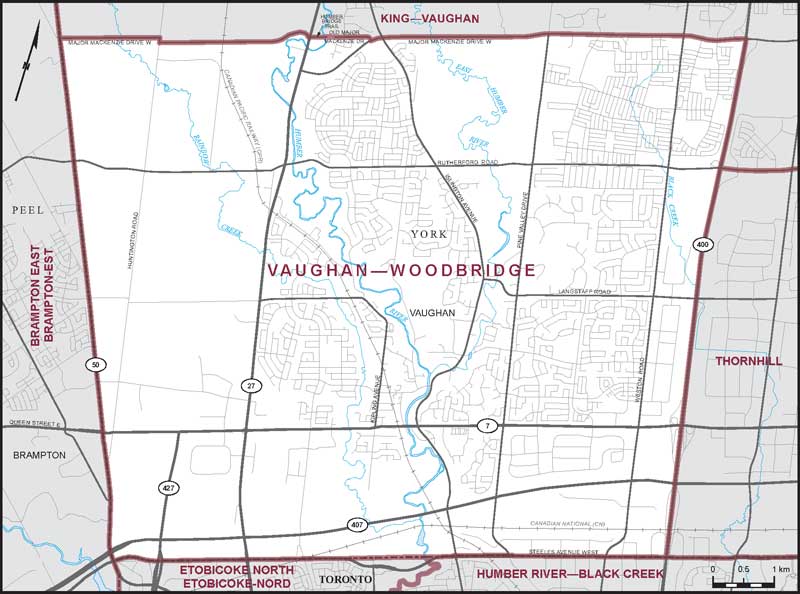
Electoral District:
Vaughan—WoodbridgeProvince/Territory:
Ontario-
Population:
121,705 -
Area:
87 km² -
Population density:
1,399.00/km² -
Population change:
n/a -
Average age:
42 -
Average income:
$60,900 -
Voter turnout:
71%
Language spoken most often at home:
-
English:
84,450 -
French:
180 -
Indigenous language:
0 -
Most popular other language:
-
Italian:
7,665
-
-
All others:
20,985
-
-
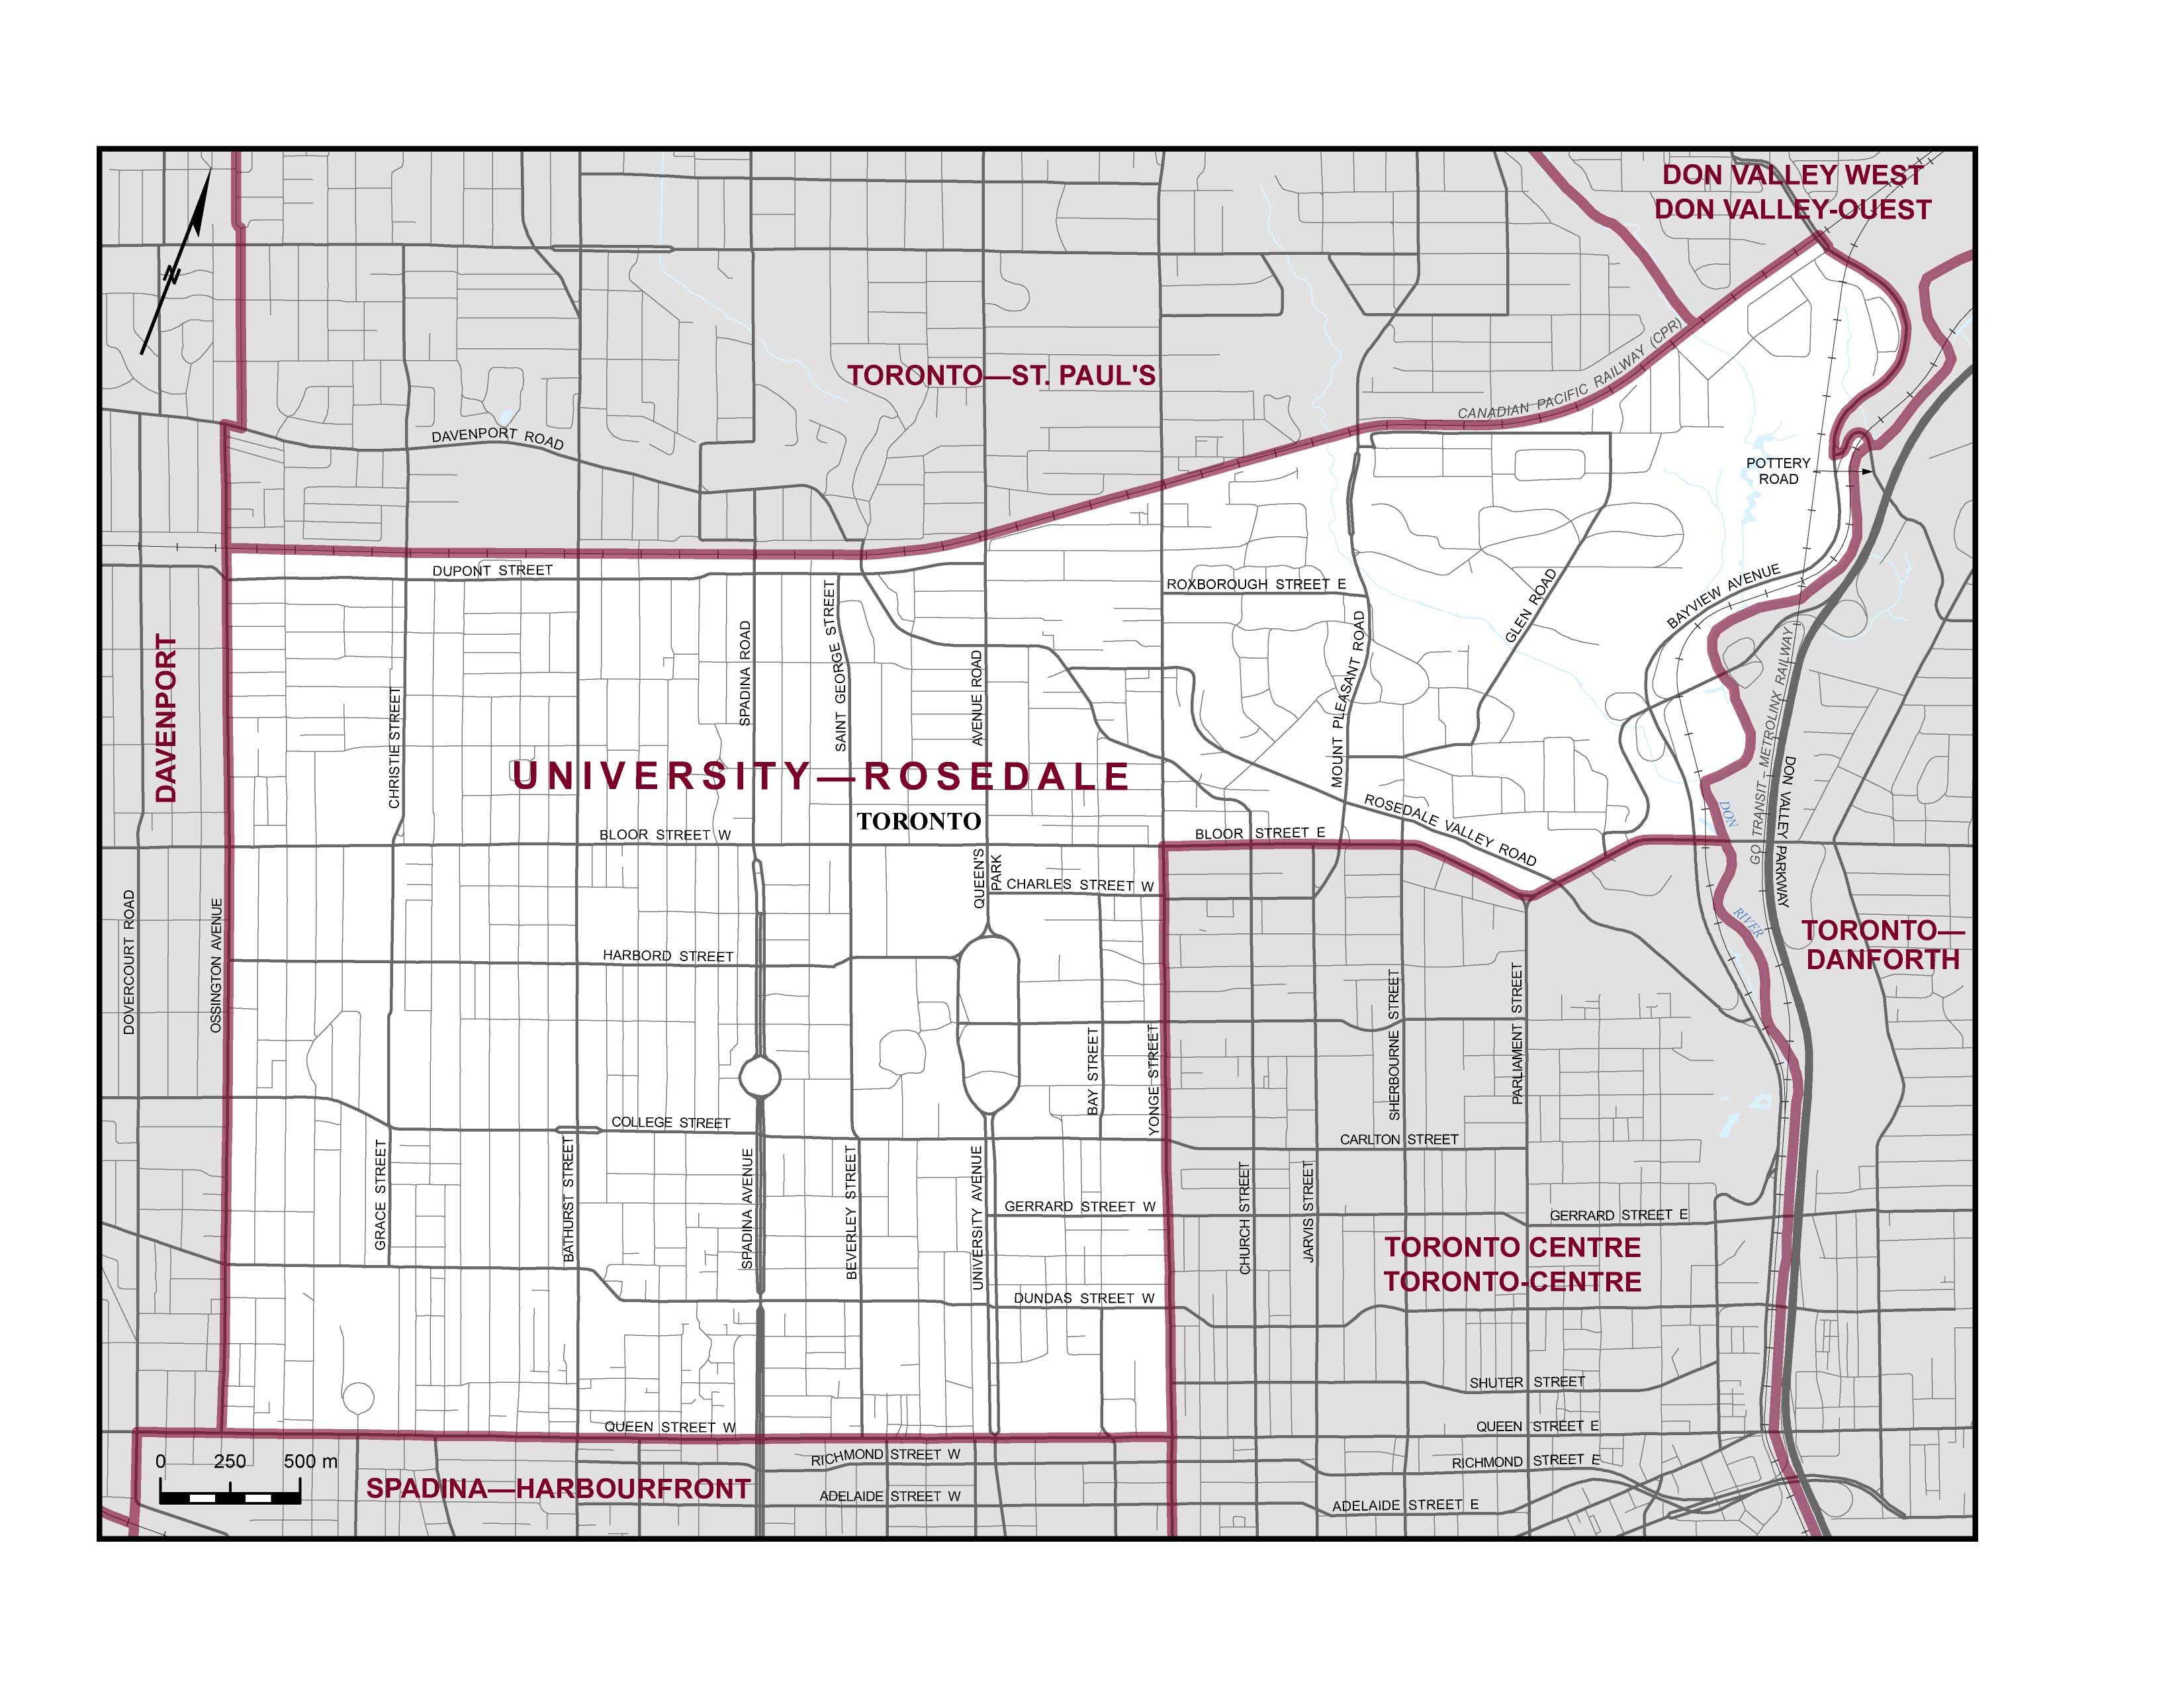
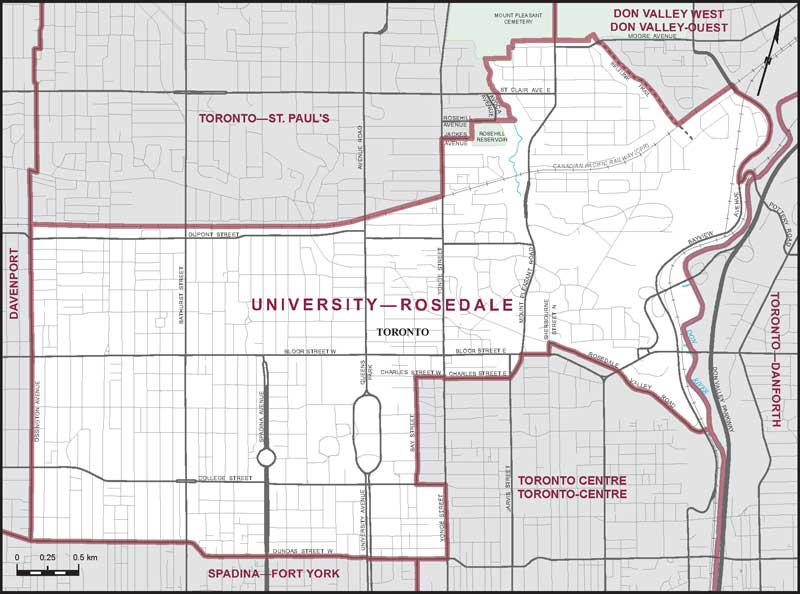
Electoral District:
University—RosedaleProvince/Territory:
Ontario-
Population:
123,812 -
Area:
14 km² -
Population density:
8,844.00/km² -
Population change:
n/a -
Average age:
42 -
Average income:
$89,300 -
Voter turnout:
65%
Language spoken most often at home:
-
English:
92,585 -
French:
1,020 -
Indigenous language:
10 -
Most popular other language:
-
Mandarin:
7,250
-
-
All others:
15,260
-
-
Electoral District:
Toronto—St. Paul'sProvince/Territory:
Ontario-
Population:
125,438 -
Area:
16 km² -
Population density:
7,840.00/km² -
Population change:
n/a -
Average age:
43 -
Average income:
$105,400 -
Voter turnout:
74%
Language spoken most often at home:
-
English:
100,520 -
French:
985 -
Indigenous language:
10 -
Most popular other language:
-
Spanish:
2,245
-
-
All others:
14,715
-
-
Electoral District:
Toronto—DanforthProvince/Territory:
Ontario-
Population:
105,472 -
Area:
21 km² -
Population density:
5,022.00/km² -
Population change:
n/a -
Average age:
41 -
Average income:
$70,800 -
Voter turnout:
72%
Language spoken most often at home:
-
English:
84,380 -
French:
910 -
Indigenous language:
5 -
Most popular other language:
-
Yue (Cantonese):
3,845
-
-
All others:
11,140
-
-
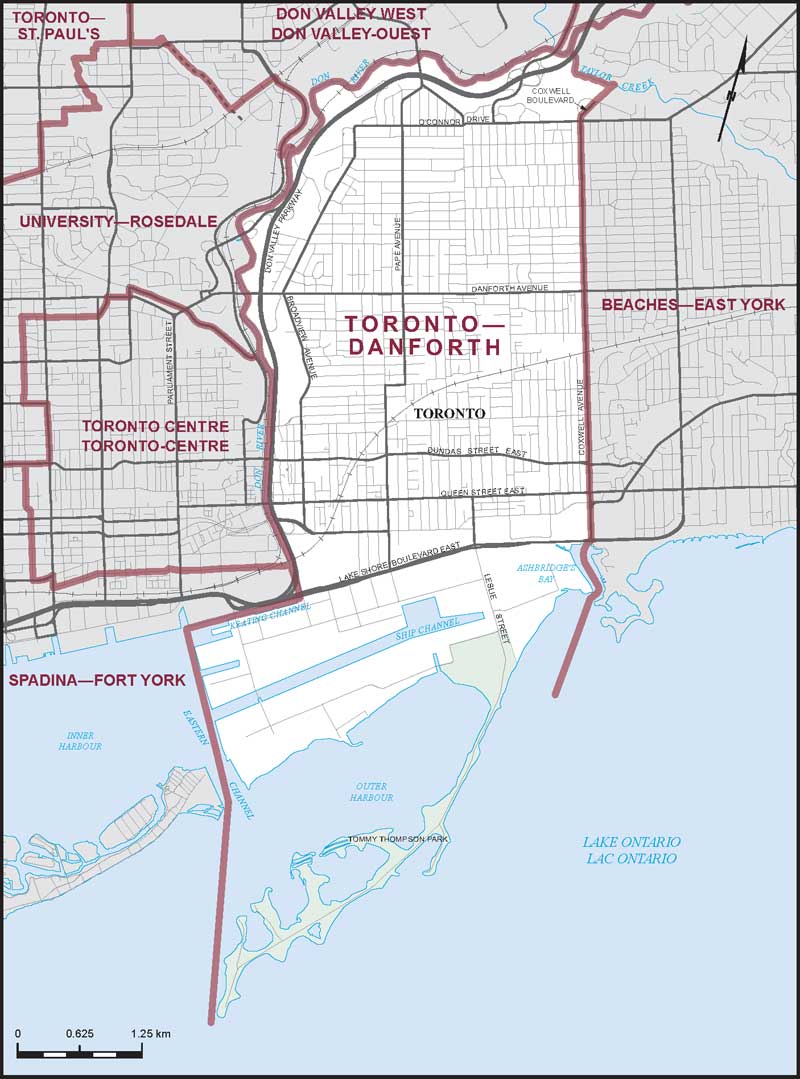
Electoral District:
Toronto CentreProvince/Territory:
Ontario-
Population:
121,703 -
Area:
6 km² -
Population density:
20,284.00/km² -
Population change:
n/a -
Average age:
40 -
Average income:
$61,700 -
Voter turnout:
64%
Language spoken most often at home:
-
English:
87,435 -
French:
1,495 -
Indigenous language:
10 -
Most popular other language:
-
Mandarin:
3,600
-
-
All others:
19,035
-
-
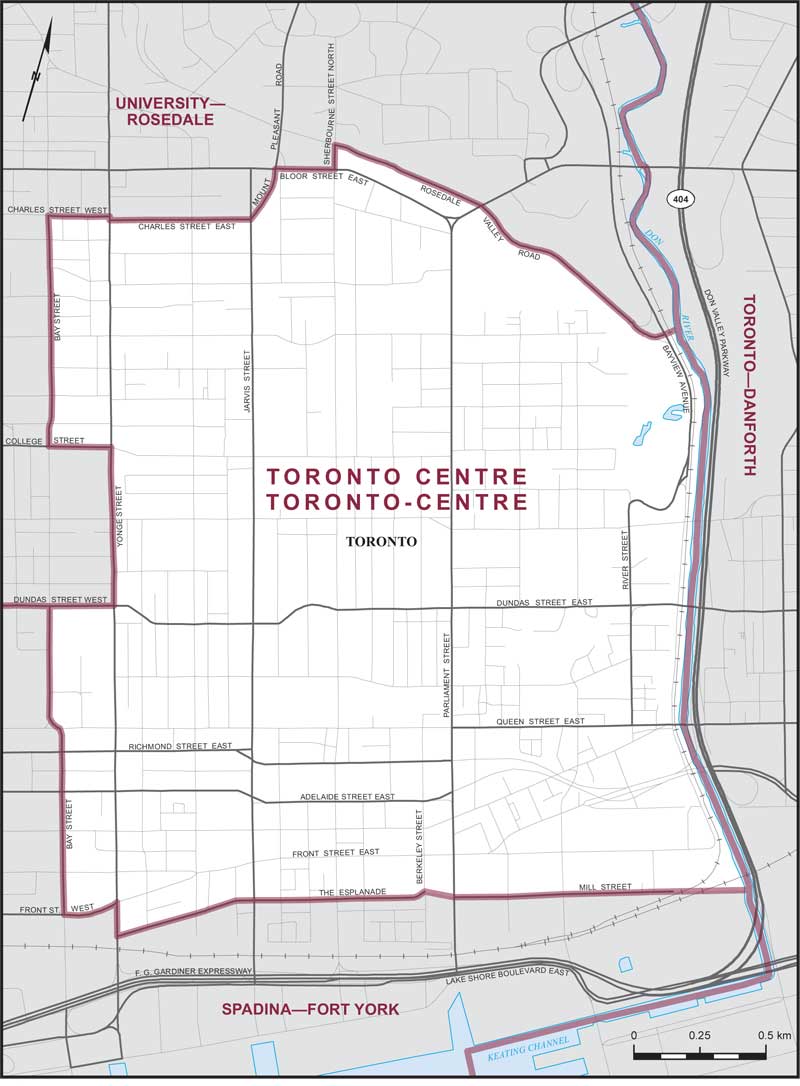
Electoral District:
Thunder Bay—Superior NorthProvince/Territory:
Ontario-
Population:
86,147 -
Area:
131,632 km² -
Population density:
1.00/km² -
Population change:
n/a -
Average age:
43 -
Average income:
$52,450 -
Voter turnout:
68%
Language spoken most often at home:
-
English:
79,395 -
French:
1,055 -
Indigenous language:
690 -
Most popular other language:
-
Italian:
385
-
-
All others:
2,250
-
-
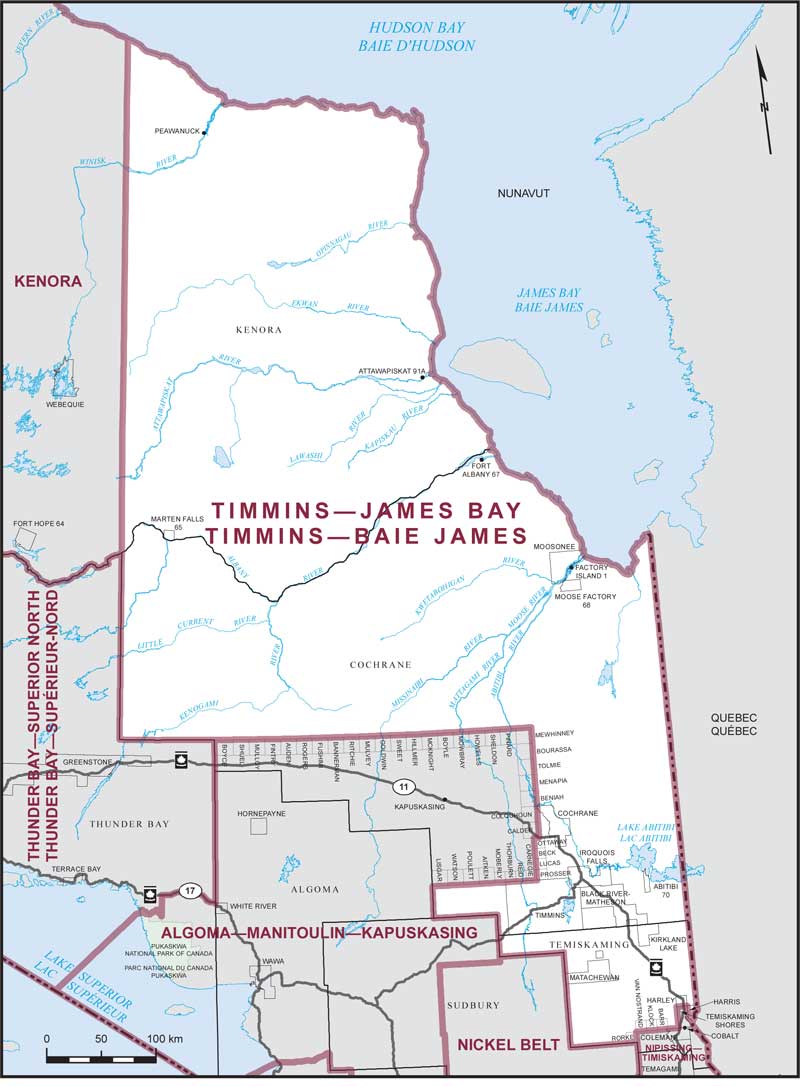
Electoral District:
Thunder Bay—Rainy RiverProvince/Territory:
Ontario-
Population:
82,357 -
Area:
32,537 km² -
Population density:
3.00/km² -
Population change:
n/a -
Average age:
44 -
Average income:
$50,520 -
Voter turnout:
66%
Language spoken most often at home:
-
English:
78,295 -
French:
340 -
Indigenous language:
225 -
Most popular other language:
-
Italian:
210
-
-
All others:
1,425
-
-
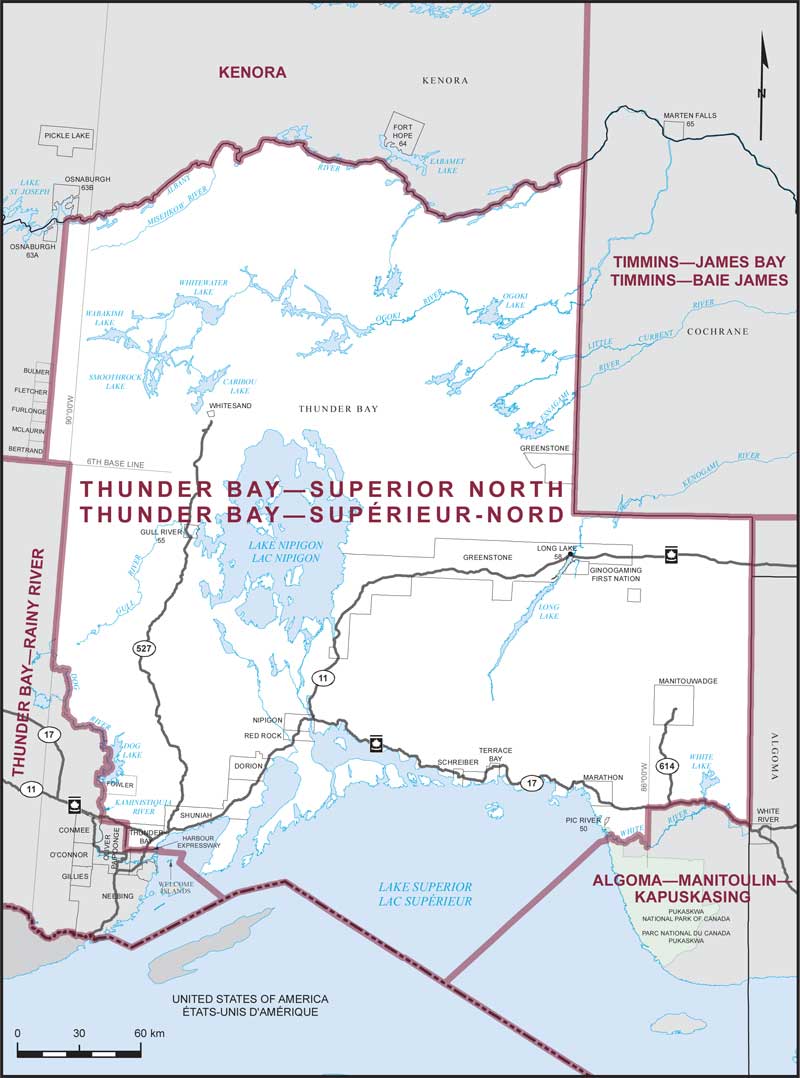
Electoral District:
ThornhillProvince/Territory:
Ontario-
Population:
124,866 -
Area:
67 km² -
Population density:
1,864.00/km² -
Population change:
n/a -
Average age:
42 -
Average income:
$62,400 -
Voter turnout:
69%
Language spoken most often at home:
-
English:
76,690 -
French:
310 -
Indigenous language:
0 -
Most popular other language:
-
Russian:
9,050
-
-
All others:
29,345
-

