Federal Electoral District Fact Sheets
-
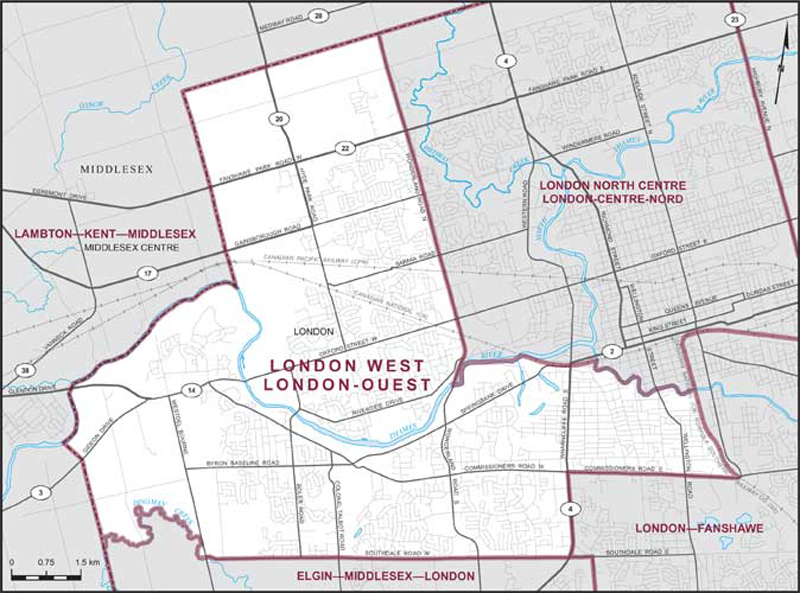
Electoral District:
London WestProvince/Territory:
Ontario-
Population:
114,374 -
Area:
62 km² -
Population density:
1,845.00/km² -
Population change:
n/a -
Average age:
42 -
Average income:
$55,250 -
Voter turnout:
73%
Language spoken most often at home:
-
English:
93,375 -
French:
505 -
Indigenous language:
5 -
Most popular other language:
-
Arabic:
3,240
-
-
All others:
11,680
-
-
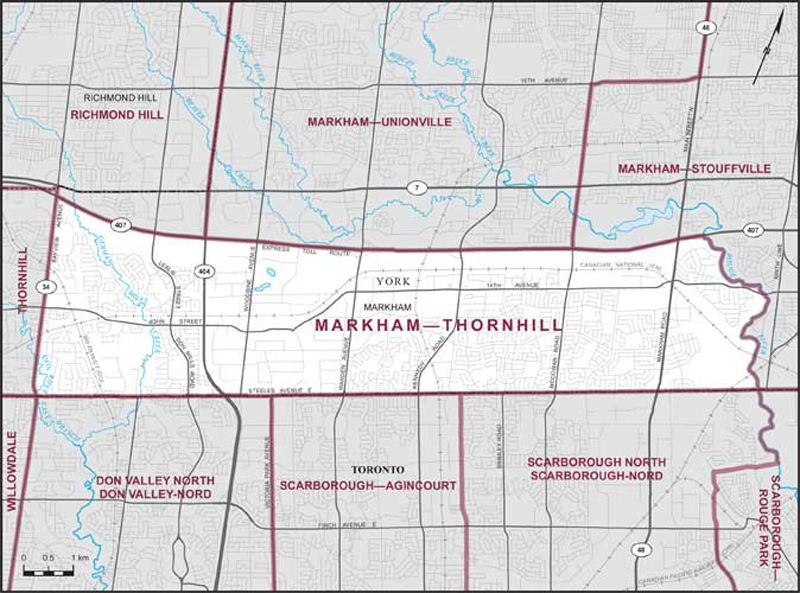
Electoral District:
Markham—ThornhillProvince/Territory:
Ontario-
Population:
111,087 -
Area:
58 km² -
Population density:
1,915.00/km² -
Population change:
n/a -
Average age:
43 -
Average income:
$48,360 -
Voter turnout:
64%
Language spoken most often at home:
-
English:
48,915 -
French:
135 -
Indigenous language:
0 -
Most popular other language:
-
Yue (Cantonese):
16,010
-
-
All others:
34,485
-
-
Electoral District:
Markham—UnionvilleProvince/Territory:
Ontario-
Population:
116,972 -
Area:
82 km² -
Population density:
1,426.00/km² -
Population change:
n/a -
Average age:
41 -
Average income:
$56,400 -
Voter turnout:
64%
Language spoken most often at home:
-
English:
51,325 -
French:
220 -
Indigenous language:
0 -
Most popular other language:
-
Yue (Cantonese):
27,295
-
-
All others:
27,830
-
-
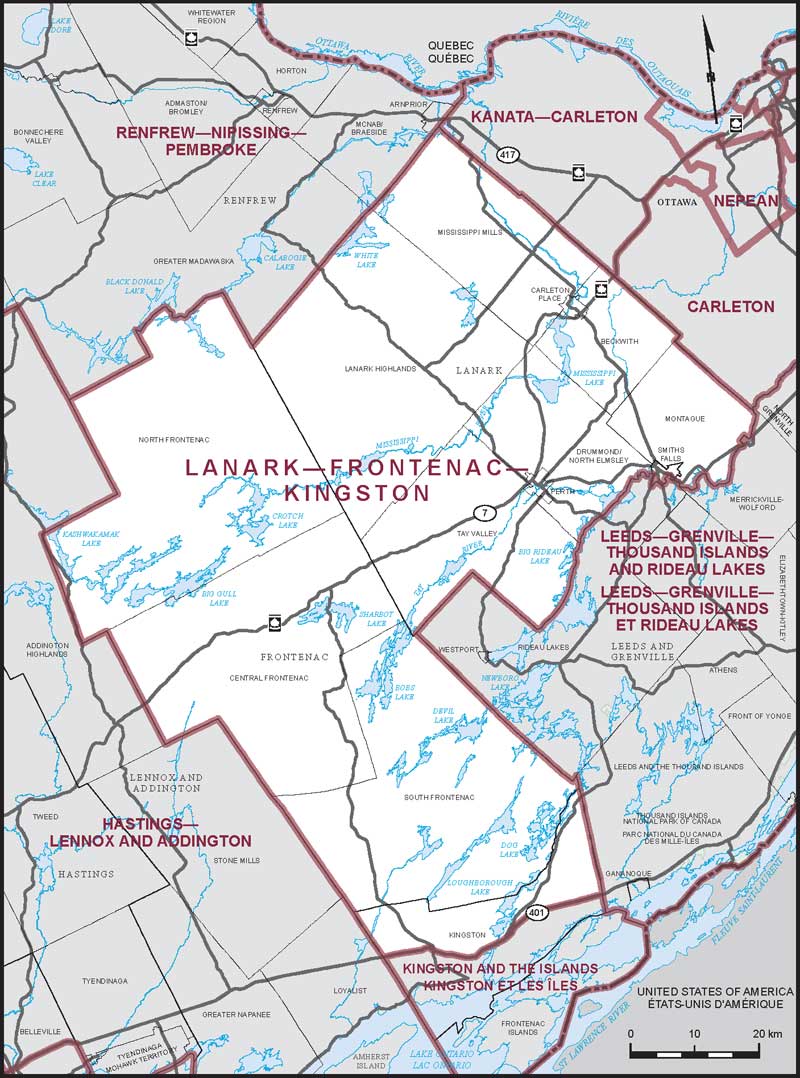
Electoral District:
Lanark—FrontenacProvince/Territory:
Ontario-
Population:
103,120 -
Area:
6,084 km² -
Population density:
17.00/km² -
Population change:
n/a -
Average age:
46 -
Average income:
$53,950 -
Voter turnout:
76%
Language spoken most often at home:
-
English:
99,790 -
French:
915 -
Indigenous language:
10 -
Most popular other language:
-
Arabic:
75
-
-
All others:
745
-
-
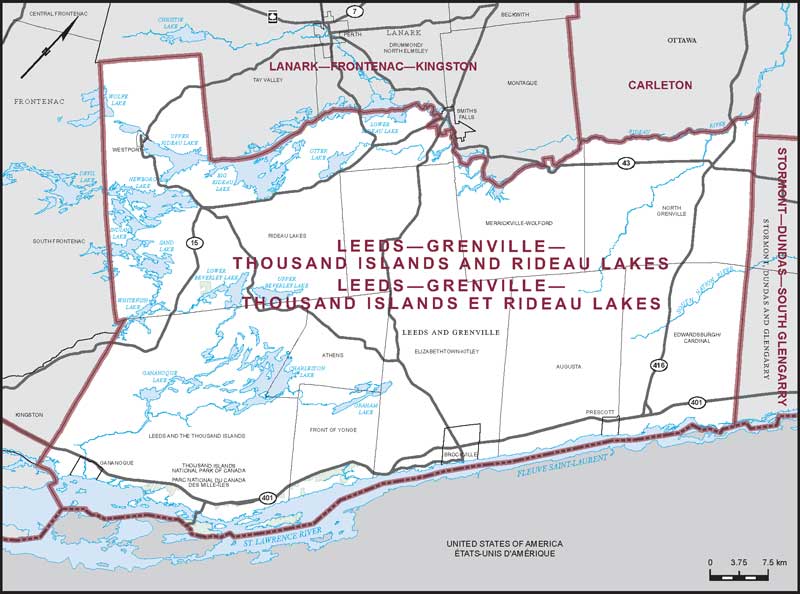
Electoral District:
Leeds—Grenville—Thousand Islands—Rideau LakesProvince/Territory:
Ontario-
Population:
104,075 -
Area:
3,356 km² -
Population density:
31.00/km² -
Population change:
n/a -
Average age:
47 -
Average income:
$51,040 -
Voter turnout:
74%
Language spoken most often at home:
-
English:
100,200 -
French:
905 -
Indigenous language:
0 -
Most popular other language:
-
Punjabi (Panjabi):
110
-
-
All others:
1,005
-
-
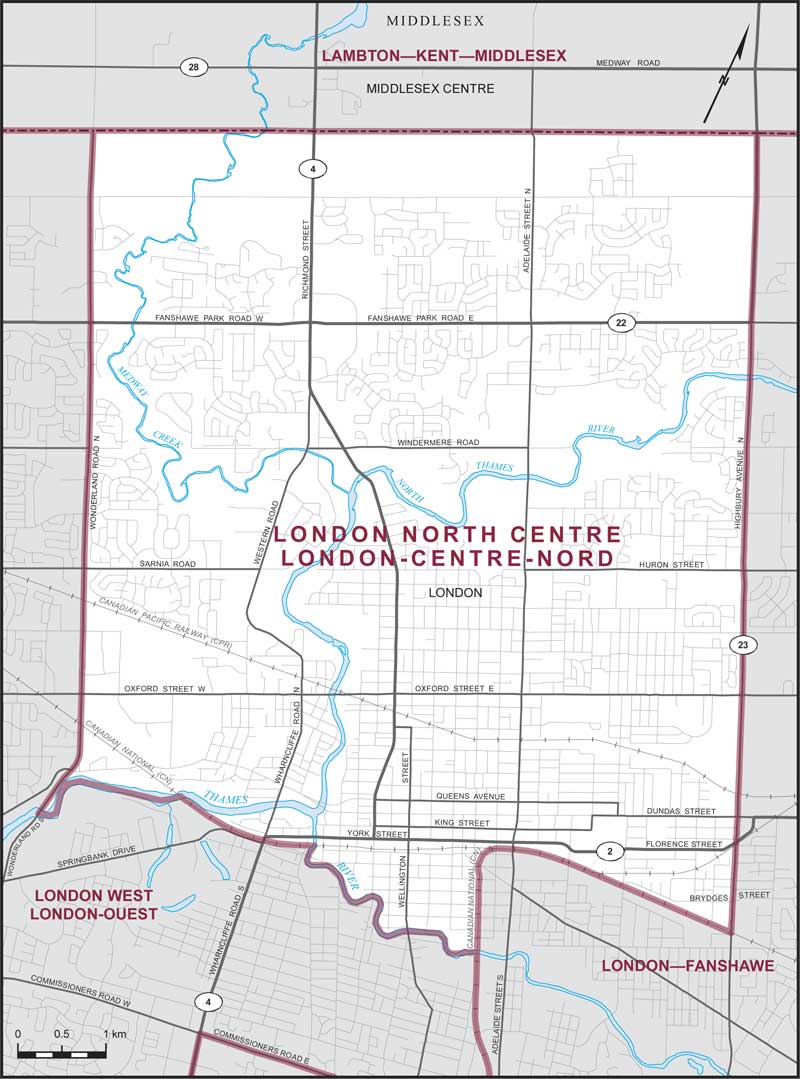
Electoral District:
London CentreProvince/Territory:
Ontario-
Population:
126,597 -
Area:
49 km² -
Population density:
2,584.00/km² -
Population change:
n/a -
Average age:
41 -
Average income:
$49,120 -
Voter turnout:
67%
Language spoken most often at home:
-
English:
104,520 -
French:
390 -
Indigenous language:
5 -
Most popular other language:
-
Spanish:
1,800
-
-
All others:
13,680
-
-
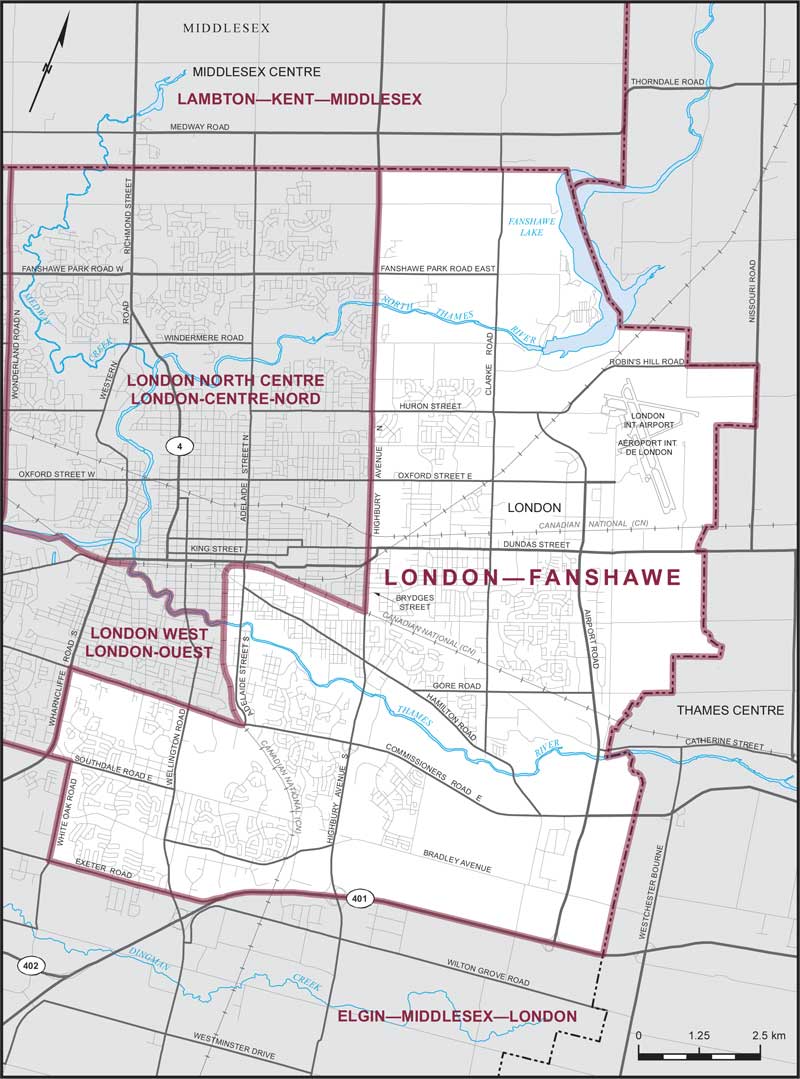
Electoral District:
London—FanshaweProvince/Territory:
Ontario-
Population:
126,286 -
Area:
107 km² -
Population density:
1,180.00/km² -
Population change:
n/a -
Average age:
40 -
Average income:
$43,000 -
Voter turnout:
63%
Language spoken most often at home:
-
English:
103,010 -
French:
520 -
Indigenous language:
15 -
Most popular other language:
-
Arabic:
3,495
-
-
All others:
12,810
-
-
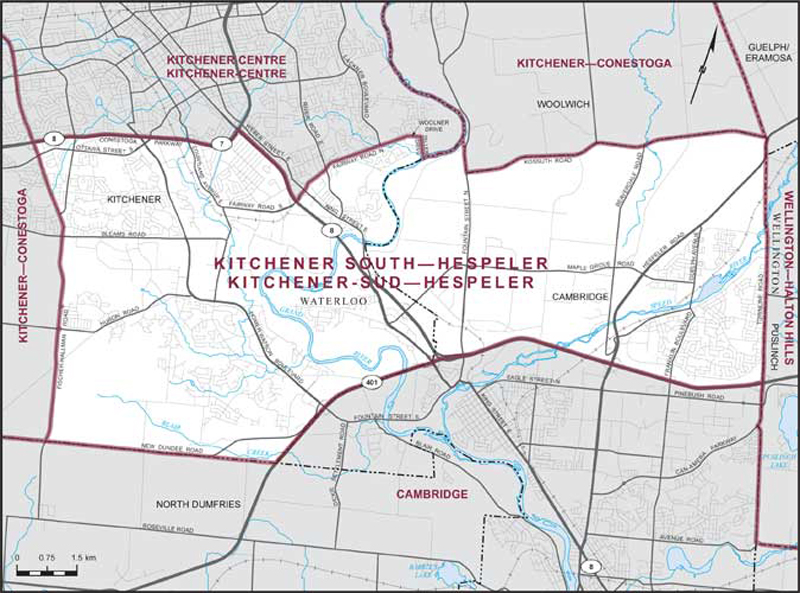
Electoral District:
Kitchener South—HespelerProvince/Territory:
Ontario-
Population:
119,851 -
Area:
104 km² -
Population density:
1,152.00/km² -
Population change:
n/a -
Average age:
38 -
Average income:
$53,600 -
Voter turnout:
70%
Language spoken most often at home:
-
English:
91,465 -
French:
365 -
Indigenous language:
0 -
Most popular other language:
-
Punjabi (Panjabi):
3,075
-
-
All others:
17,505
-
-
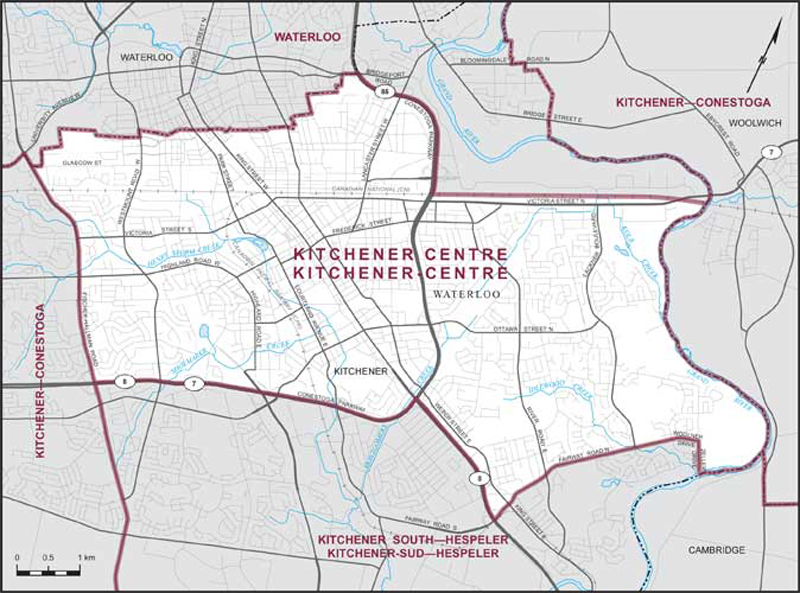
Electoral District:
Kitchener CentreProvince/Territory:
Ontario-
Population:
113,404 -
Area:
48 km² -
Population density:
2,363.00/km² -
Population change:
n/a -
Average age:
41 -
Average income:
$51,400 -
Voter turnout:
69%
Language spoken most often at home:
-
English:
91,325 -
French:
365 -
Indigenous language:
5 -
Most popular other language:
-
Tigrigna:
1,465
-
-
All others:
14,950
-
-
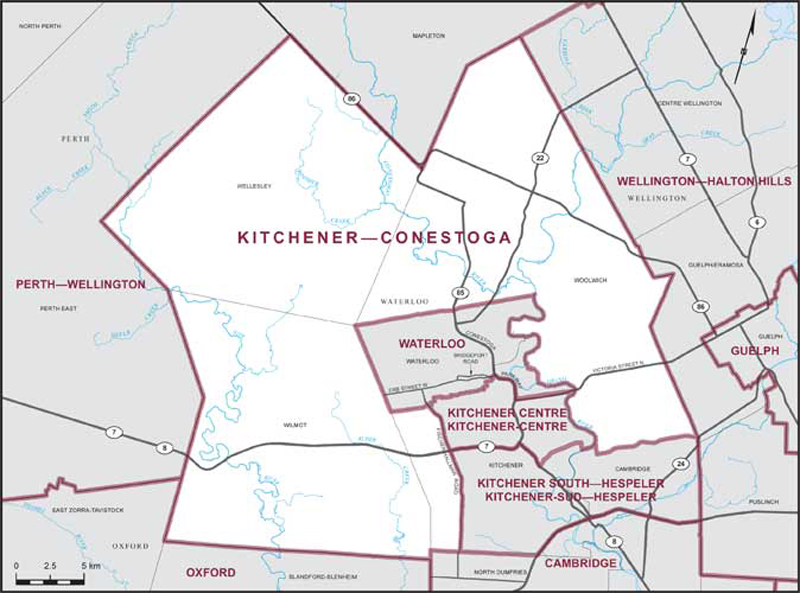
Electoral District:
Kitchener—ConestogaProvince/Territory:
Ontario-
Population:
112,953 -
Area:
898 km² -
Population density:
126.00/km² -
Population change:
n/a -
Average age:
39 -
Average income:
$57,150 -
Voter turnout:
74%
Language spoken most often at home:
-
English:
90,390 -
French:
230 -
Indigenous language:
0 -
Most popular other language:
-
Pennsylvania German:
2,270
-
-
All others:
15,300
-
-
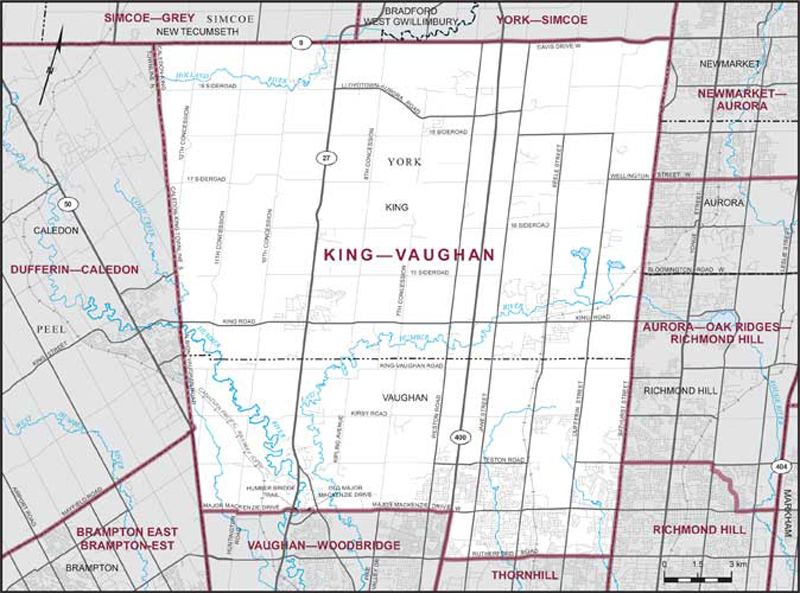
Electoral District:
King—VaughanProvince/Territory:
Ontario-
Population:
124,401 -
Area:
458 km² -
Population density:
272.00/km² -
Population change:
n/a -
Average age:
39 -
Average income:
$66,600 -
Voter turnout:
71%
Language spoken most often at home:
-
English:
85,710 -
French:
275 -
Indigenous language:
0 -
Most popular other language:
-
Mandarin:
4,125
-
-
All others:
25,120
-
-
Electoral District:
Huron—BruceProvince/Territory:
Ontario-
Population:
112,929 -
Area:
5,599 km² -
Population density:
20.00/km² -
Population change:
n/a -
Average age:
44 -
Average income:
$55,700 -
Voter turnout:
76%
Language spoken most often at home:
-
English:
105,970 -
French:
125 -
Indigenous language:
5 -
Most popular other language:
-
German:
1,705
-
-
All others:
3,180
-
-
Electoral District:
KanataProvince/Territory:
Ontario-
Population:
121,458 -
Area:
211 km² -
Population density:
576.00/km² -
Population change:
n/a -
Average age:
40 -
Average income:
$67,900 -
Voter turnout:
78%
Language spoken most often at home:
-
English:
92,540 -
French:
3,390 -
Indigenous language:
5 -
Most popular other language:
-
Mandarin:
4,340
-
-
All others:
13,315
-
-
Electoral District:
Kapuskasing—Timmins—MushkegowukProvince/Territory:
Ontario-
Population:
93,948 -
Area:
264,451 km² -
Population density:
0.40/km² -
Population change:
n/a -
Average age:
43 -
Average income:
$52,100 -
Voter turnout:
63%
Language spoken most often at home:
-
English:
65,095 -
French:
21,730 -
Indigenous language:
930 -
Most popular other language:
-
Punjabi (Panjabi):
390
-
-
All others:
1,090
-
-
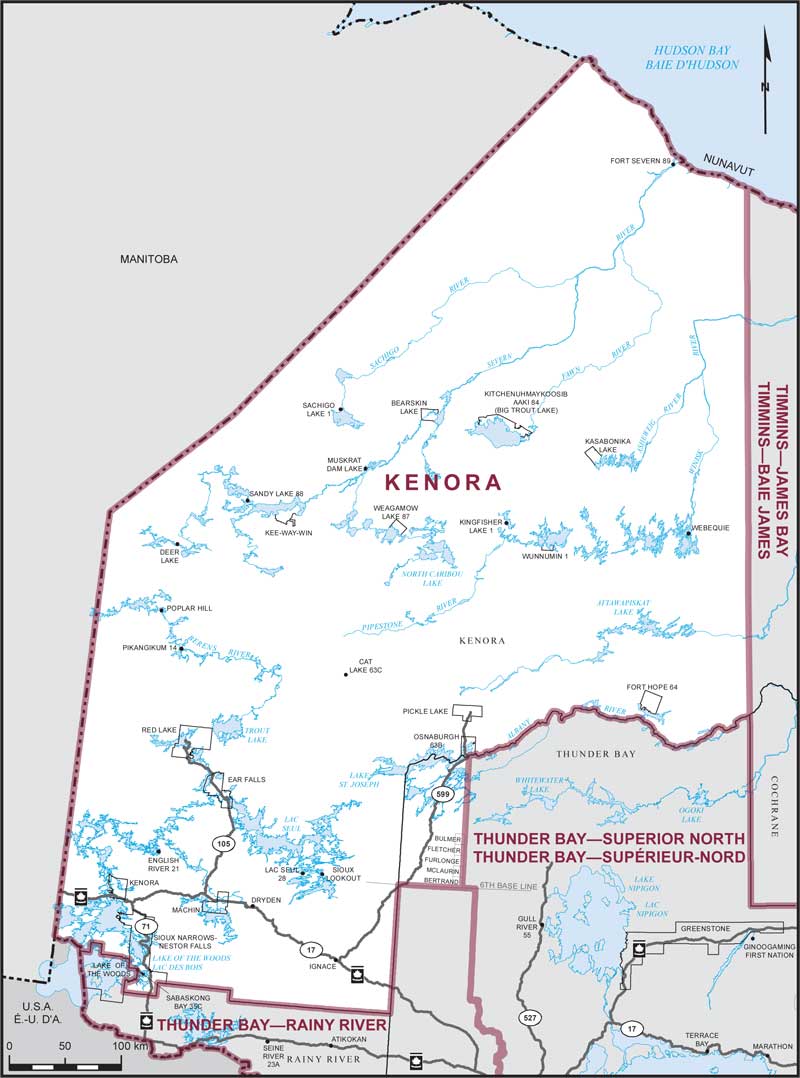
Electoral District:
Kenora—KiiwetinoongProvince/Territory:
Ontario-
Population:
61,962 -
Area:
256,882 km² -
Population density:
0.20/km² -
Population change:
n/a -
Average age:
40 -
Average income:
$50,240 -
Voter turnout:
60%
Language spoken most often at home:
-
English:
56,810 -
French:
225 -
Indigenous language:
2,660 -
Most popular other language:
-
Tagalog (Pilipino, Filipino):
90
-
-
All others:
325
-
-
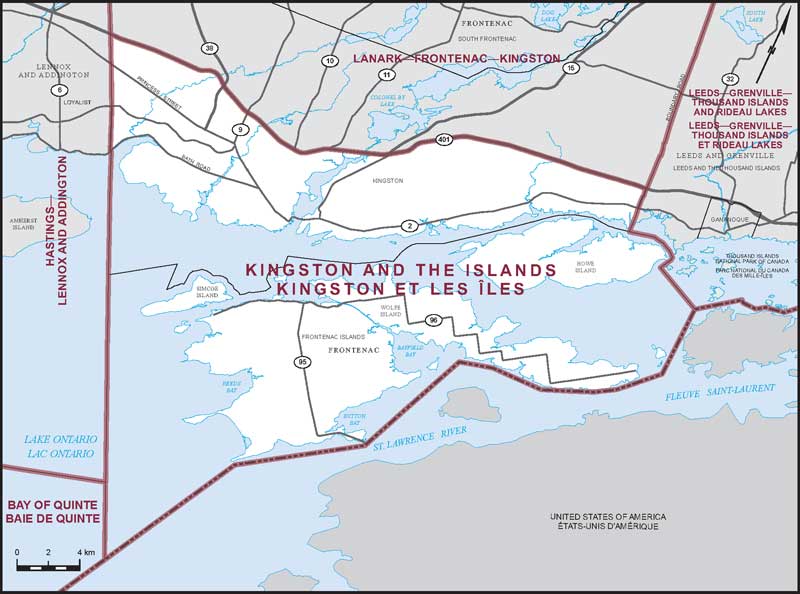
Electoral District:
Kingston and the IslandsProvince/Territory:
Ontario-
Population:
134,415 -
Area:
628 km² -
Population density:
214.00/km² -
Population change:
n/a -
Average age:
43 -
Average income:
$54,250 -
Voter turnout:
72%
Language spoken most often at home:
-
English:
120,240 -
French:
1,810 -
Indigenous language:
5 -
Most popular other language:
-
Mandarin:
1,070
-
-
All others:
6,110
-