Federal Electoral District Fact Sheets
-
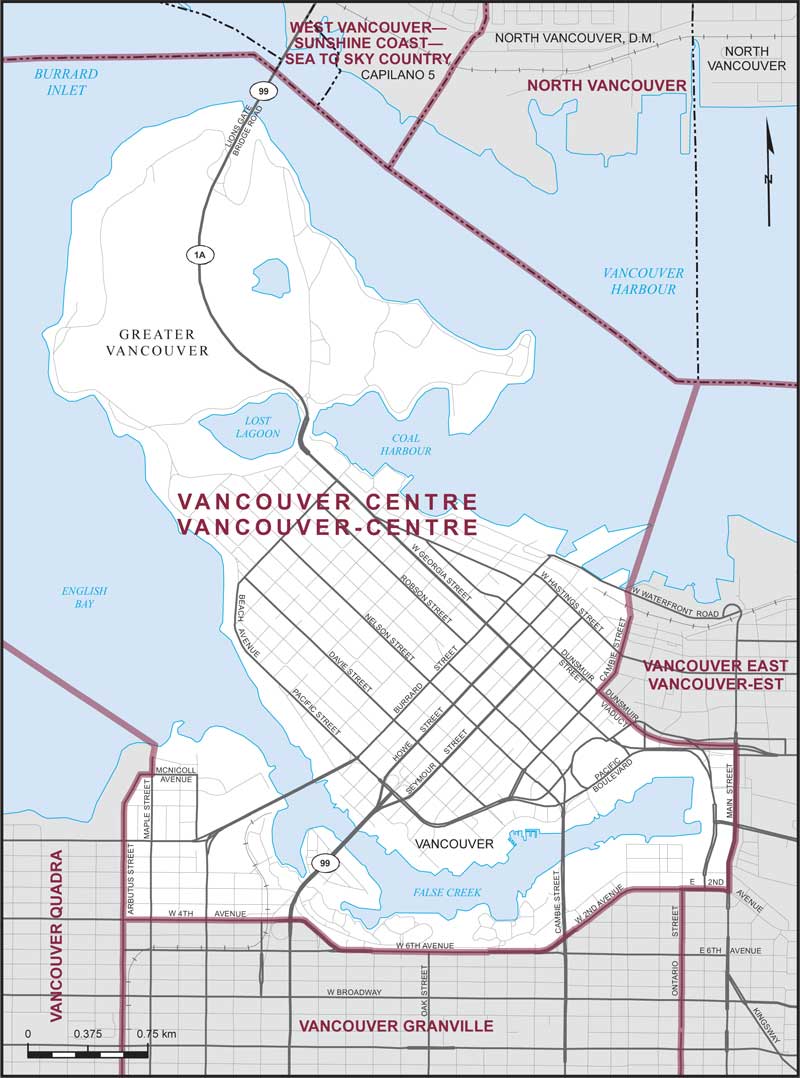
Electoral District:
Surrey NewtonProvince/Territory:
British Columbia-
Population:
119,560 -
Area:
29 km² -
Population density:
4,123.00/km² -
Population change:
n/a -
Average age:
38 -
Average income:
$40,960 -
Voter turnout:
64%
Language spoken most often at home:
-
English:
47,840 -
French:
160 -
Indigenous language:
10 -
Most popular other language:
-
Punjabi (Panjabi):
43,645
-
-
All others:
13,720
-
-
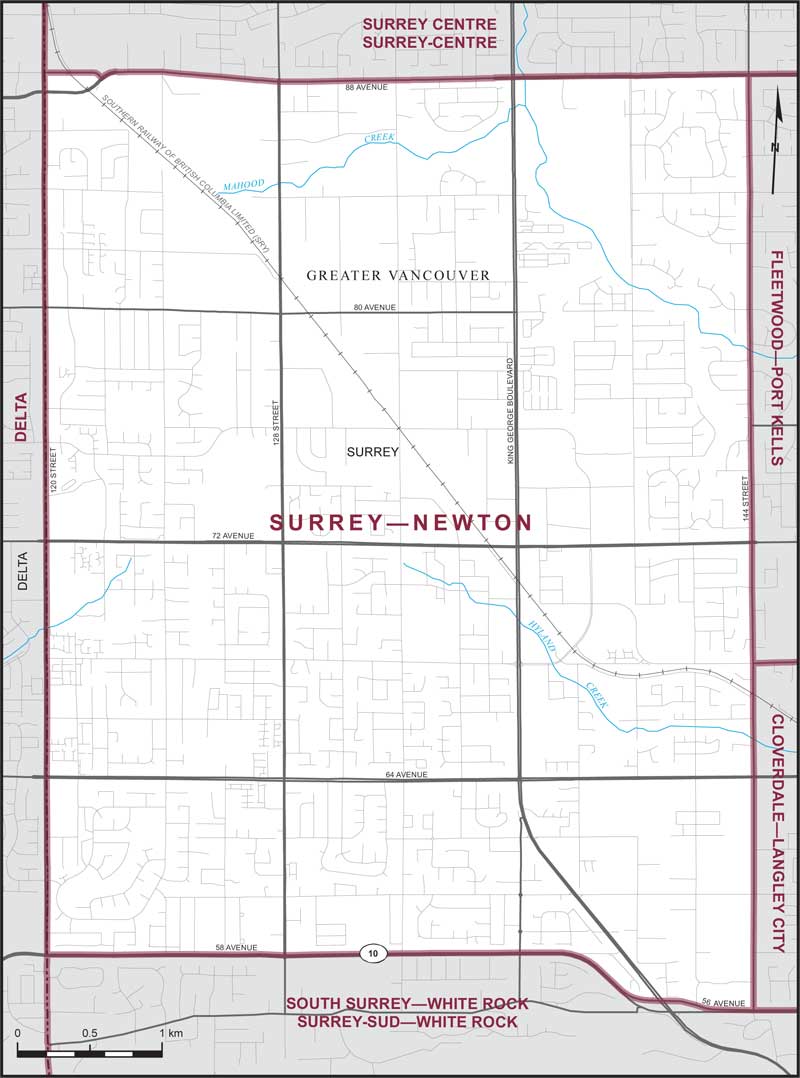
Electoral District:
Surrey CentreProvince/Territory:
British Columbia-
Population:
119,724 -
Area:
39 km² -
Population density:
3,070.00/km² -
Population change:
n/a -
Average age:
38 -
Average income:
$40,600 -
Voter turnout:
59%
Language spoken most often at home:
-
English:
57,255 -
French:
195 -
Indigenous language:
0 -
Most popular other language:
-
Punjabi (Panjabi):
25,915
-
-
All others:
23,065
-
-
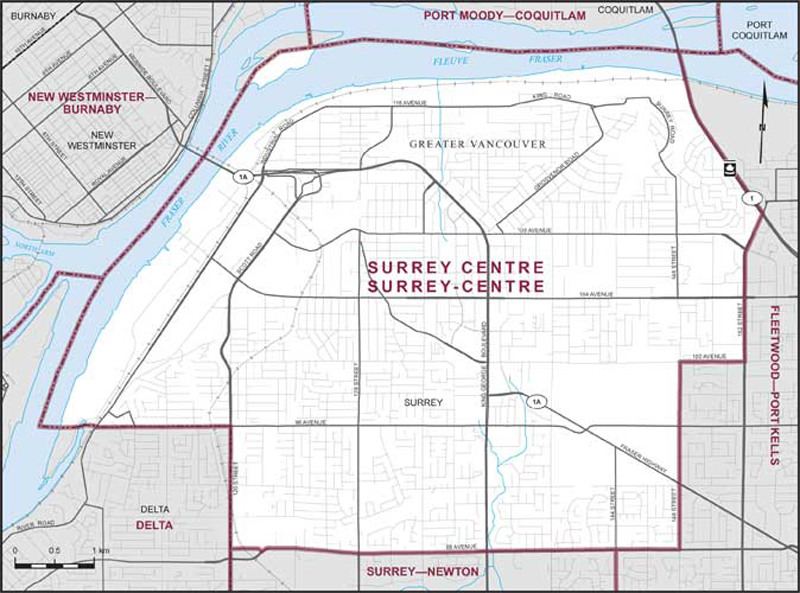
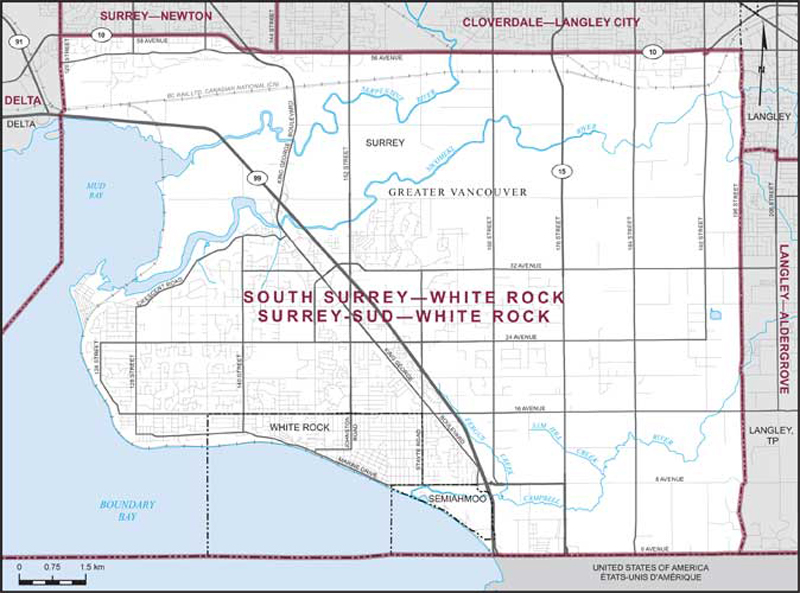
Electoral District:
South Surrey—White RockProvince/Territory:
British Columbia-
Population:
118,278 -
Area:
142 km² -
Population density:
833.00/km² -
Population change:
n/a -
Average age:
46 -
Average income:
$63,550 -
Voter turnout:
72%
Language spoken most often at home:
-
English:
89,700 -
French:
255 -
Indigenous language:
0 -
Most popular other language:
-
Mandarin:
11,205
-
-
All others:
10,420
-
-
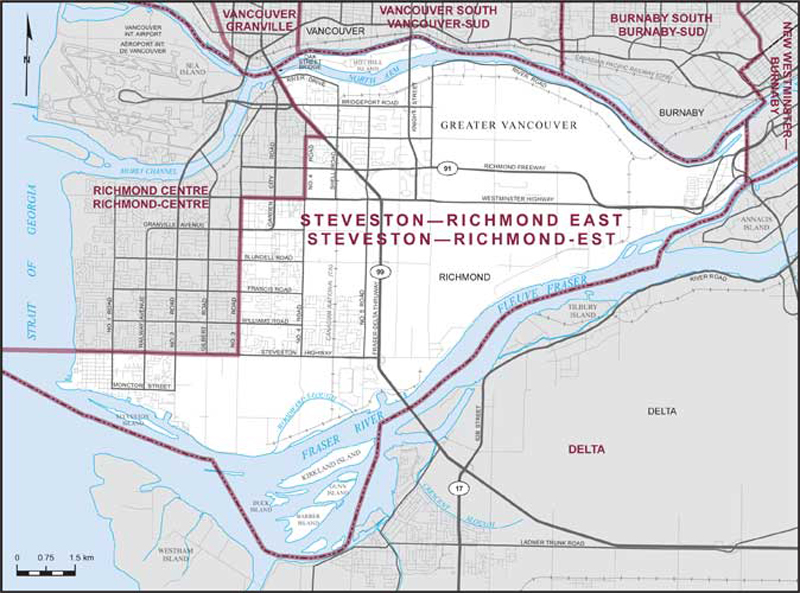
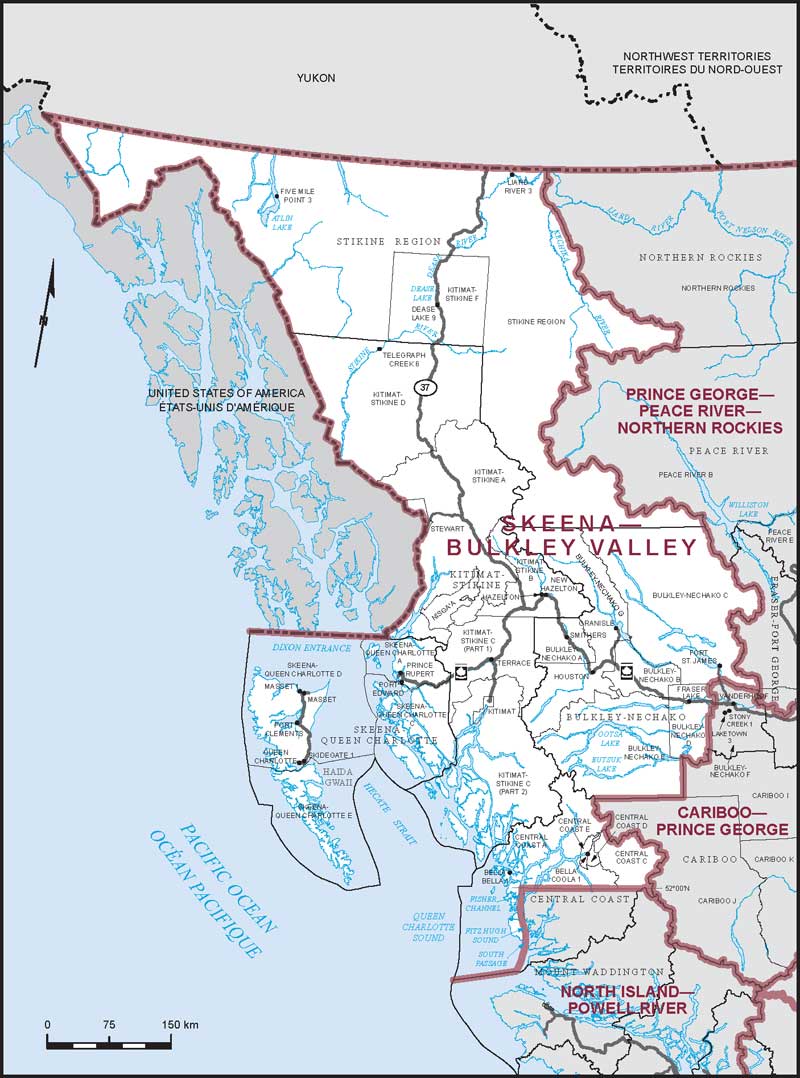
Electoral District:
Skeena—Bulkley ValleyProvince/Territory:
British Columbia-
Population:
89,689 -
Area:
325,634 km² -
Population density:
0.30/km² -
Population change:
n/a -
Average age:
41 -
Average income:
$51,900 -
Voter turnout:
65%
Language spoken most often at home:
-
English:
84,600 -
French:
370 -
Indigenous language:
420 -
Most popular other language:
-
Punjabi (Panjabi):
625
-
-
All others:
1,905
-
-
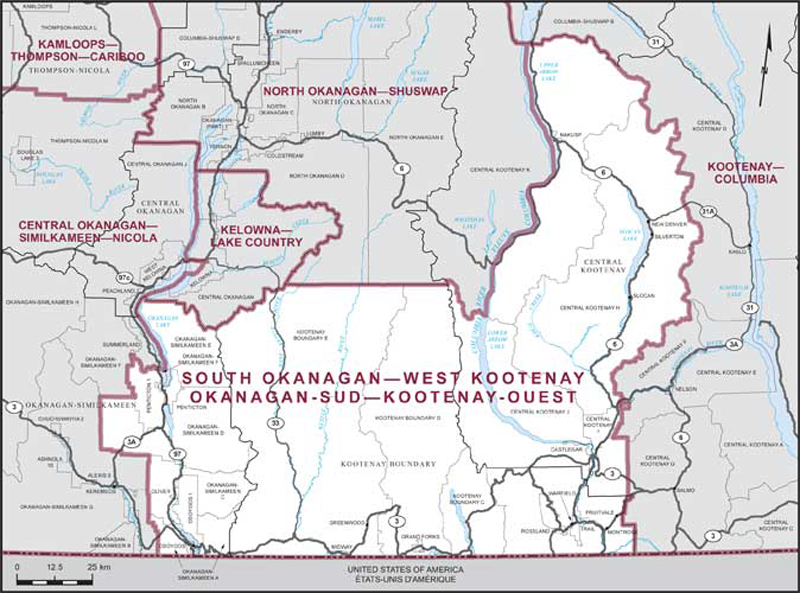
Electoral District:
Similkameen—South Okanagan—West KootenayProvince/Territory:
British Columbia-
Population:
111,246 -
Area:
16,881 km² -
Population density:
7.00/km² -
Population change:
n/a -
Average age:
50 -
Average income:
$48,120 -
Voter turnout:
72%
Language spoken most often at home:
-
English:
103,470 -
French:
480 -
Indigenous language:
0 -
Most popular other language:
-
Punjabi (Panjabi):
2,240
-
-
All others:
2,290
-
-
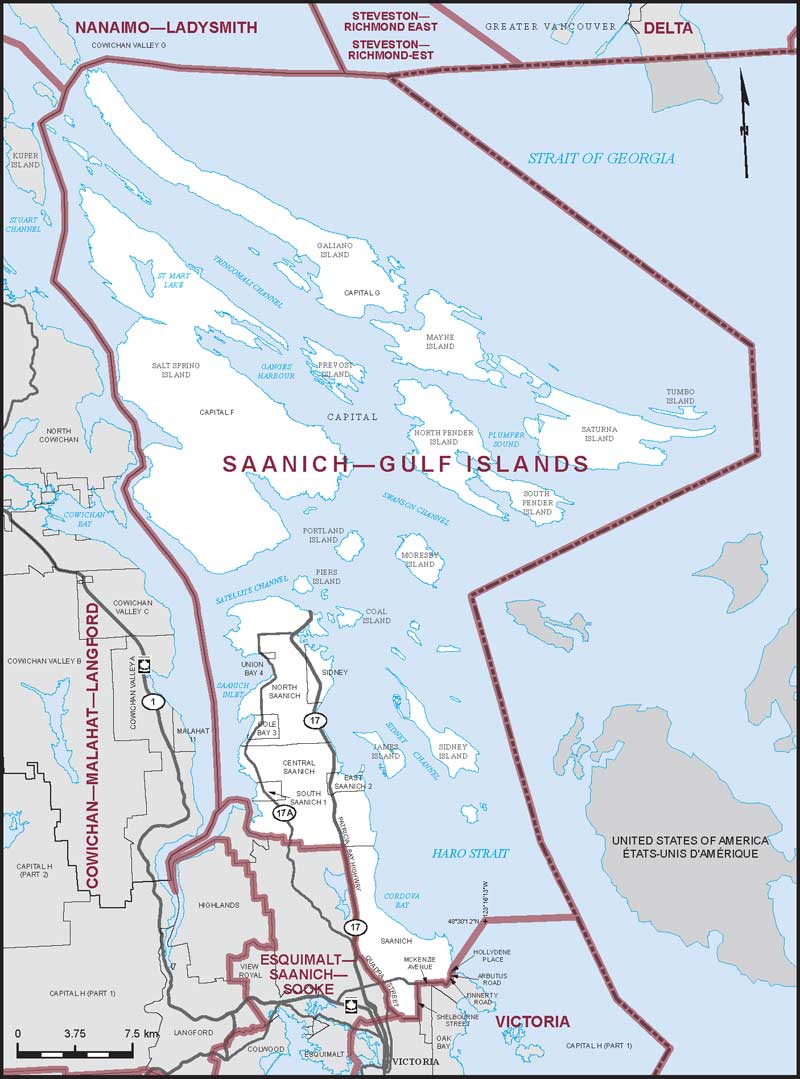
Electoral District:
Saanich—Gulf IslandsProvince/Territory:
British Columbia-
Population:
122,147 -
Area:
516 km² -
Population density:
237.00/km² -
Population change:
n/a -
Average age:
49 -
Average income:
$59,200 -
Voter turnout:
78%
Language spoken most often at home:
-
English:
109,905 -
French:
345 -
Indigenous language:
30 -
Most popular other language:
-
Mandarin:
2,255
-
-
All others:
5,800
-
-
Electoral District:
Richmond East—StevestonProvince/Territory:
British Columbia-
Population:
116,141 -
Area:
89 km² -
Population density:
1,305.00/km² -
Population change:
n/a -
Average age:
43 -
Average income:
$48,360 -
Voter turnout:
64%
Language spoken most often at home:
-
English:
57,660 -
French:
175 -
Indigenous language:
0 -
Most popular other language:
-
Yue (Cantonese):
19,060
-
-
All others:
29,720
-
-
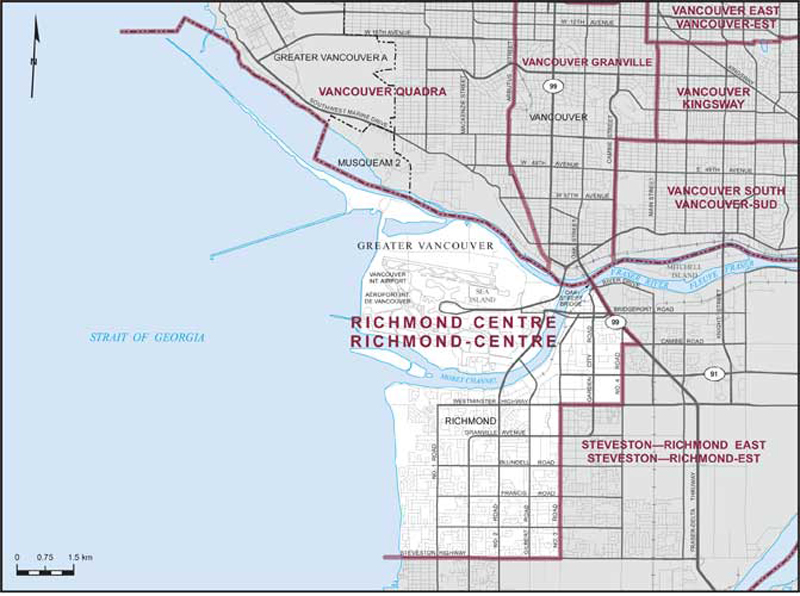
Electoral District:
Richmond Centre—MarpoleProvince/Territory:
British Columbia-
Population:
116,380 -
Area:
44 km² -
Population density:
2,645.00/km² -
Population change:
n/a -
Average age:
43 -
Average income:
$45,920 -
Voter turnout:
59%
Language spoken most often at home:
-
English:
51,150 -
French:
270 -
Indigenous language:
0 -
Most popular other language:
-
Mandarin:
23,310
-
-
All others:
31,490
-
-
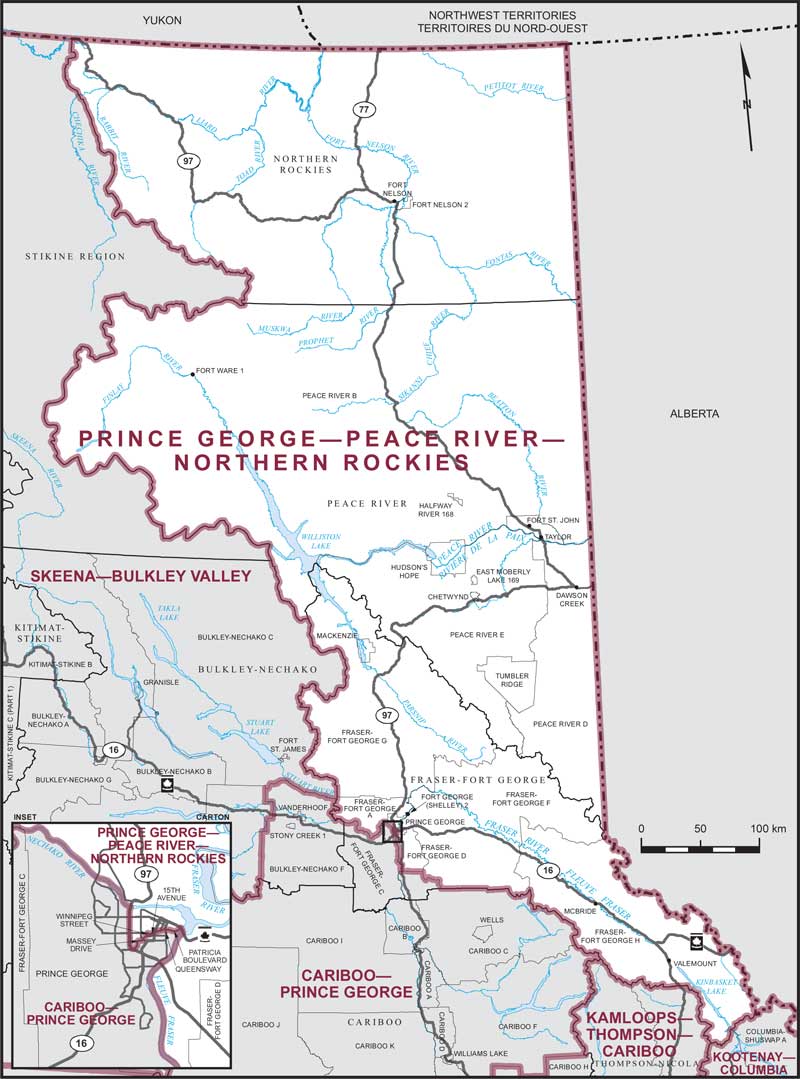
Electoral District:
Prince George—Peace River—Northern RockiesProvince/Territory:
British Columbia-
Population:
116,962 -
Area:
249,110 km² -
Population density:
0.50/km² -
Population change:
n/a -
Average age:
39 -
Average income:
$57,100 -
Voter turnout:
67%
Language spoken most often at home:
-
English:
108,750 -
French:
270 -
Indigenous language:
110 -
Most popular other language:
-
German:
875
-
-
All others:
4,310
-
-
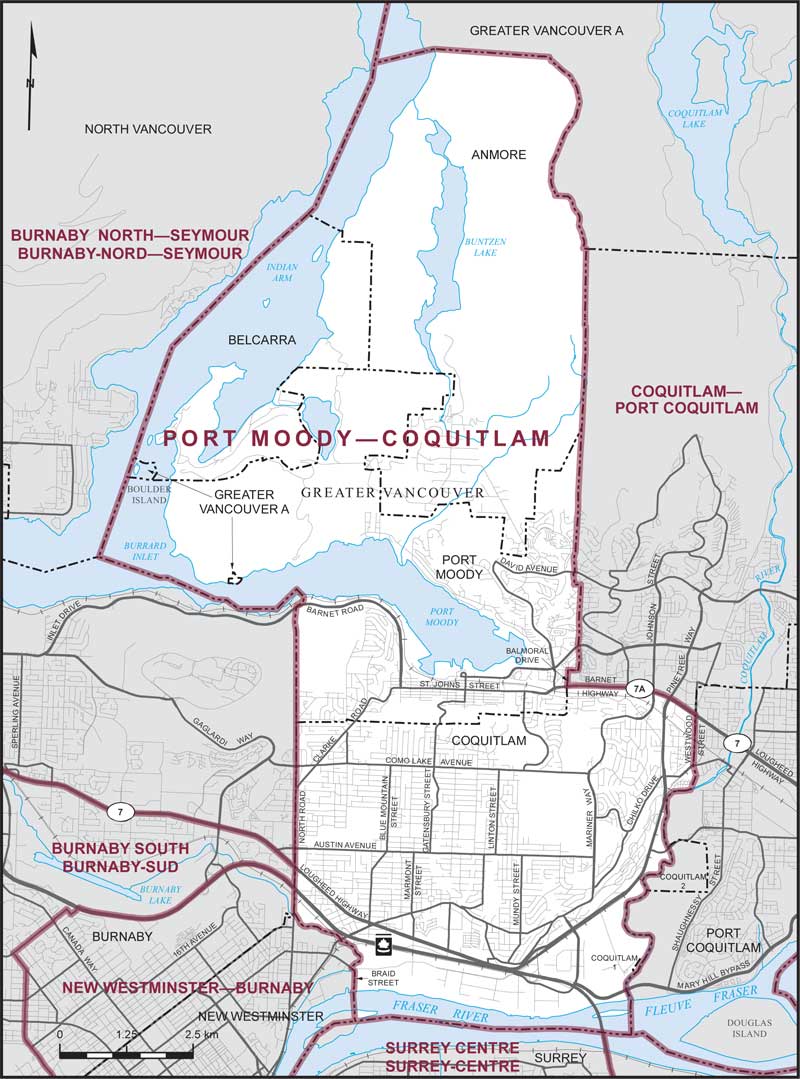
Electoral District:
Port Moody—CoquitlamProvince/Territory:
British Columbia-
Population:
115,367 -
Area:
109 km² -
Population density:
1,058.00/km² -
Population change:
n/a -
Average age:
42 -
Average income:
$59,300 -
Voter turnout:
70%
Language spoken most often at home:
-
English:
82,545 -
French:
295 -
Indigenous language:
0 -
Most popular other language:
-
Mandarin:
6,375
-
-
All others:
19,845
-
-
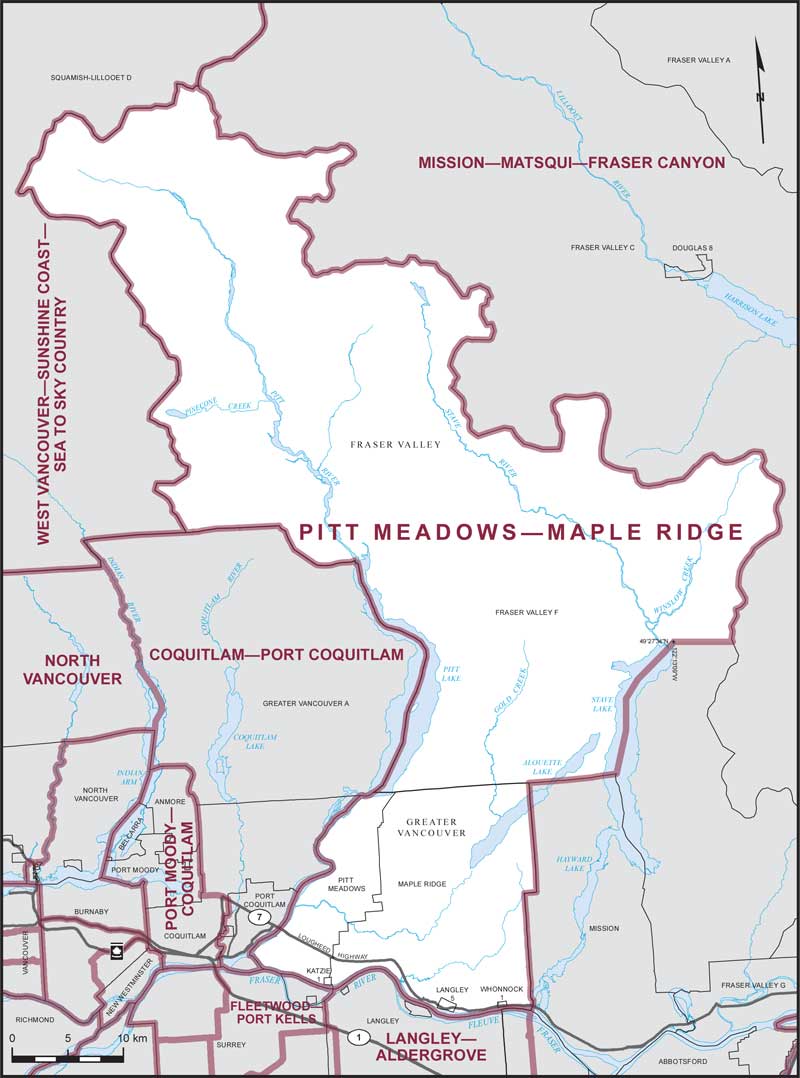
Electoral District:
Pitt Meadows—Maple RidgeProvince/Territory:
British Columbia-
Population:
116,916 -
Area:
2,232 km² -
Population density:
52.00/km² -
Population change:
n/a -
Average age:
41 -
Average income:
$55,400 -
Voter turnout:
72%
Language spoken most often at home:
-
English:
102,180 -
French:
265 -
Indigenous language:
0 -
Most popular other language:
-
Punjabi (Panjabi):
1,345
-
-
All others:
9,075
-
-
Electoral District:
Okanagan Lake West—South KelownaProvince/Territory:
British Columbia-
Population:
106,794 -
Area:
1,915 km² -
Population density:
56.00/km² -
Population change:
n/a -
Average age:
45 -
Average income:
$57,900 -
Voter turnout:
73%
Language spoken most often at home:
-
English:
100,715 -
French:
330 -
Indigenous language:
5 -
Most popular other language:
-
Punjabi (Panjabi):
550
-
-
All others:
3,275
-
-
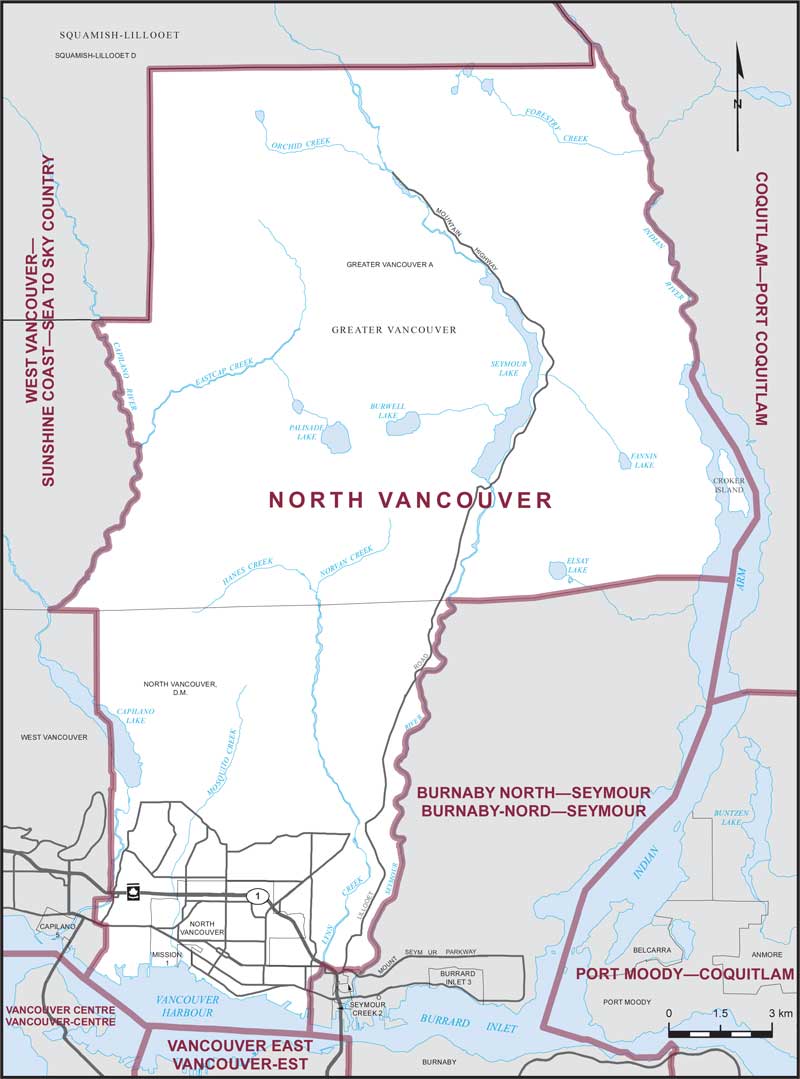
Electoral District:
North Vancouver—CapilanoProvince/Territory:
British Columbia-
Population:
116,055 -
Area:
311 km² -
Population density:
373.00/km² -
Population change:
n/a -
Average age:
44 -
Average income:
$71,700 -
Voter turnout:
72%
Language spoken most often at home:
-
English:
86,470 -
French:
785 -
Indigenous language:
5 -
Most popular other language:
-
Iranian Persian:
9,315
-
-
All others:
13,620
-
-
Electoral District:
North Island—Powell RiverProvince/Territory:
British Columbia-
Population:
125,925 -
Area:
53,549 km² -
Population density:
2.00/km² -
Population change:
n/a -
Average age:
47 -
Average income:
$49,040 -
Voter turnout:
74%
Language spoken most often at home:
-
English:
120,705 -
French:
755 -
Indigenous language:
25 -
Most popular other language:
-
Punjabi (Panjabi):
210
-
-
All others:
2,100
-
-
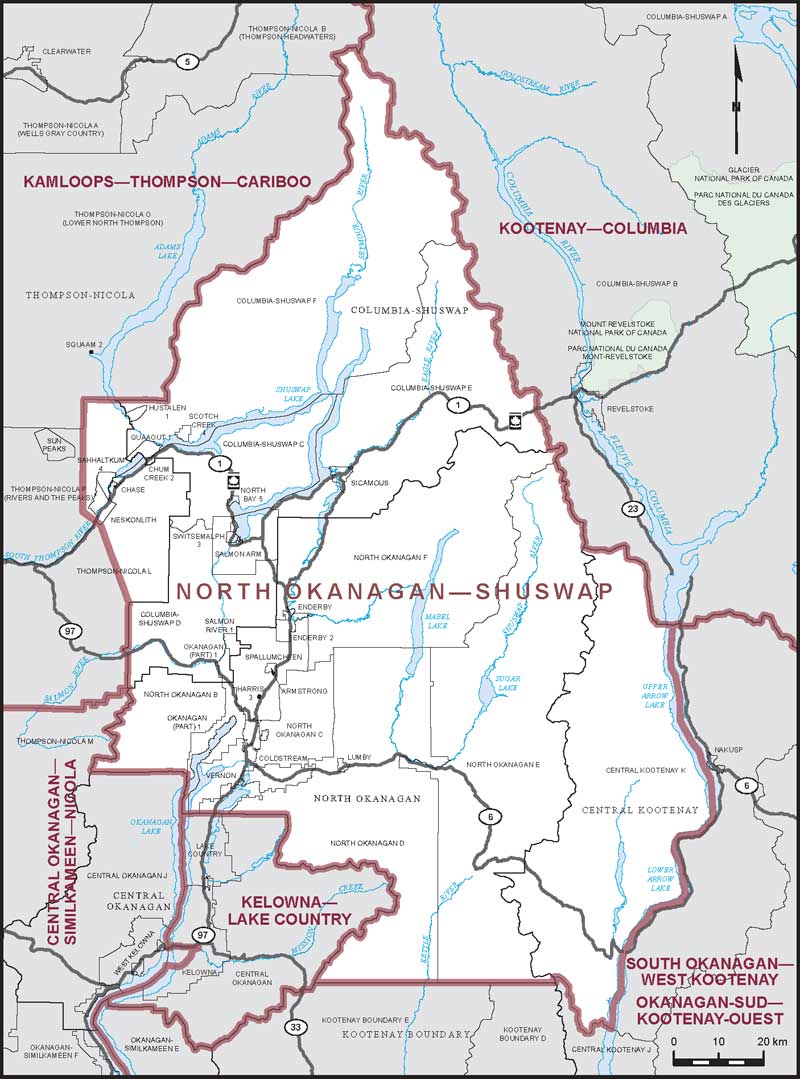
Electoral District:
New Westminster—Burnaby—MaillardvilleProvince/Territory:
British Columbia-
Population:
114,665 -
Area:
27 km² -
Population density:
4,247.00/km² -
Population change:
n/a -
Average age:
42 -
Average income:
$53,550 -
Voter turnout:
67%
Language spoken most often at home:
-
English:
78,225 -
French:
295 -
Indigenous language:
0 -
Most popular other language:
-
Mandarin:
4,370
-
-
All others:
22,920
-
-
Electoral District:
Nanaimo—LadysmithProvince/Territory:
British Columbia-
Population:
122,857 -
Area:
1,695 km² -
Population density:
72.00/km² -
Population change:
n/a -
Average age:
46 -
Average income:
$48,600 -
Voter turnout:
73%
Language spoken most often at home:
-
English:
115,000 -
French:
335 -
Indigenous language:
10 -
Most popular other language:
-
Mandarin:
855
-
-
All others:
3,705
-

