Federal Electoral District Fact Sheets
-
Electoral District:
Rivière-des-Mille-ÎlesProvince/Territory:
Québec-
Population:
104,960 -
Area:
96 km² -
Population density:
1,093.00/km² -
Population change:
n/a -
Average age:
42 -
Average income:
$53,650 -
Voter turnout:
72%
Language spoken most often at home:
-
English:
9,135 -
French:
84,100 -
Indigenous language:
0 -
Most popular other language:
-
Yiddish:
1,965
-
-
All others:
5,150
-
-
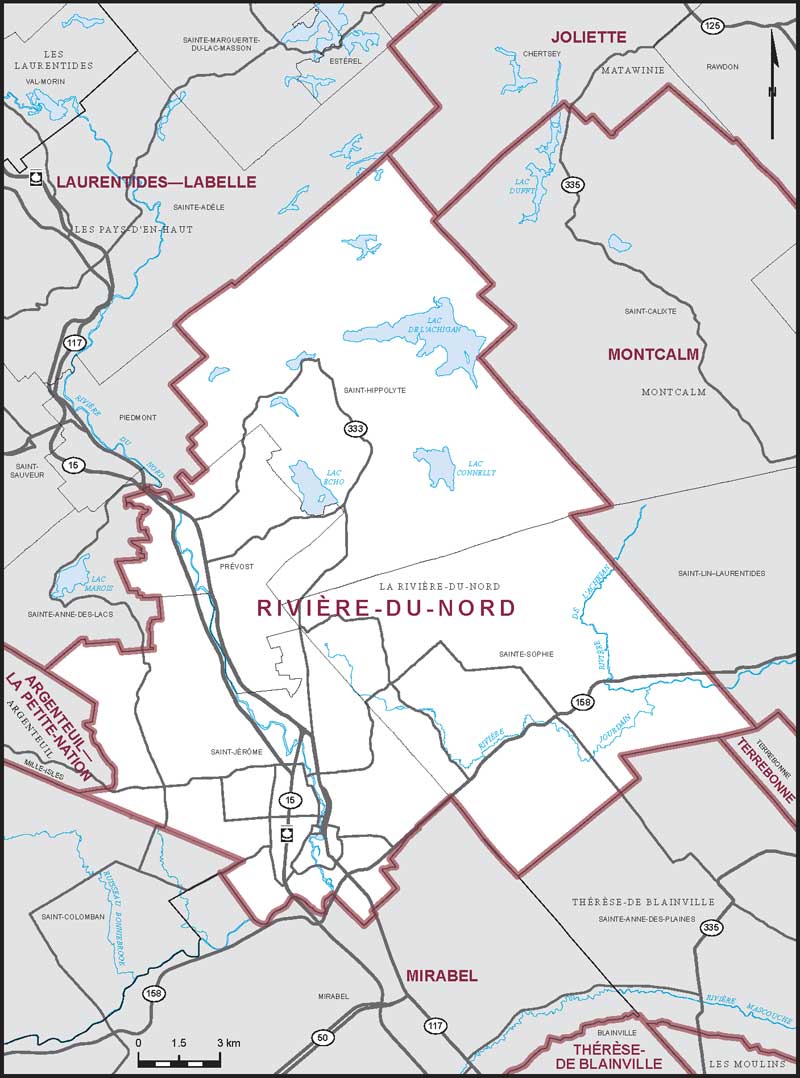
Electoral District:
Rivière-du-NordProvince/Territory:
Québec-
Population:
113,514 -
Area:
295 km² -
Population density:
385.00/km² -
Population change:
n/a -
Average age:
43 -
Average income:
$45,360 -
Voter turnout:
63%
Language spoken most often at home:
-
English:
1,755 -
French:
106,020 -
Indigenous language:
0 -
Most popular other language:
-
Spanish:
805
-
-
All others:
1,145
-
-
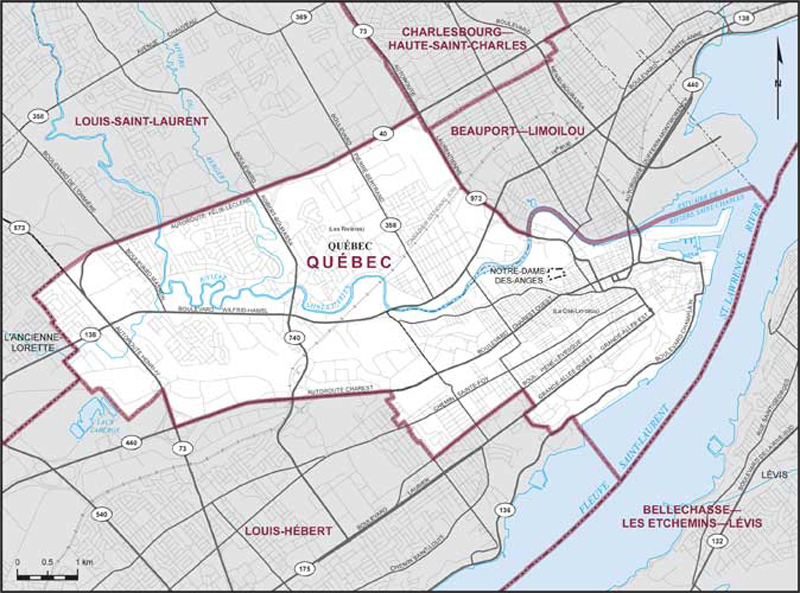
Electoral District:
Québec CentreProvince/Territory:
Québec-
Population:
103,977 -
Area:
37 km² -
Population density:
2,810.00/km² -
Population change:
n/a -
Average age:
46 -
Average income:
$50,960 -
Voter turnout:
70%
Language spoken most often at home:
-
English:
1,915 -
French:
93,205 -
Indigenous language:
35 -
Most popular other language:
-
Spanish:
1,210
-
-
All others:
2,695
-
-
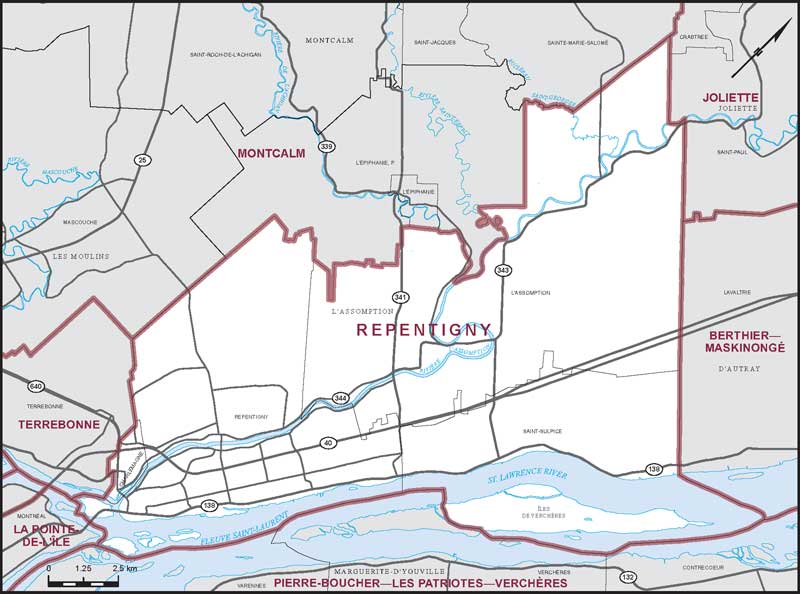
Electoral District:
RepentignyProvince/Territory:
Québec-
Population:
111,373 -
Area:
141 km² -
Population density:
790.00/km² -
Population change:
n/a -
Average age:
43 -
Average income:
$52,400 -
Voter turnout:
71%
Language spoken most often at home:
-
English:
1,930 -
French:
102,085 -
Indigenous language:
5 -
Most popular other language:
-
Spanish:
1,220
-
-
All others:
2,425
-
-
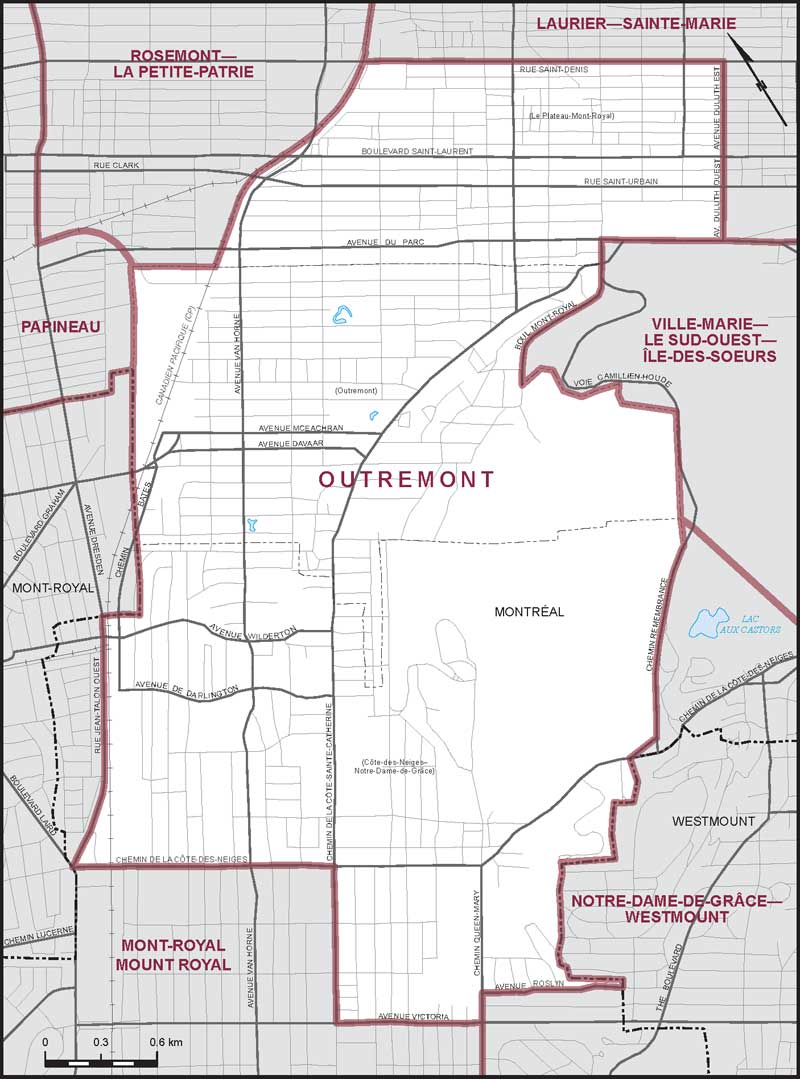
Electoral District:
OutremontProvince/Territory:
Québec-
Population:
115,051 -
Area:
13 km² -
Population density:
8,850.00/km² -
Population change:
n/a -
Average age:
38 -
Average income:
$60,000 -
Voter turnout:
62%
Language spoken most often at home:
-
English:
25,770 -
French:
57,125 -
Indigenous language:
20 -
Most popular other language:
-
Yiddish:
5,470
-
-
All others:
15,745
-
-
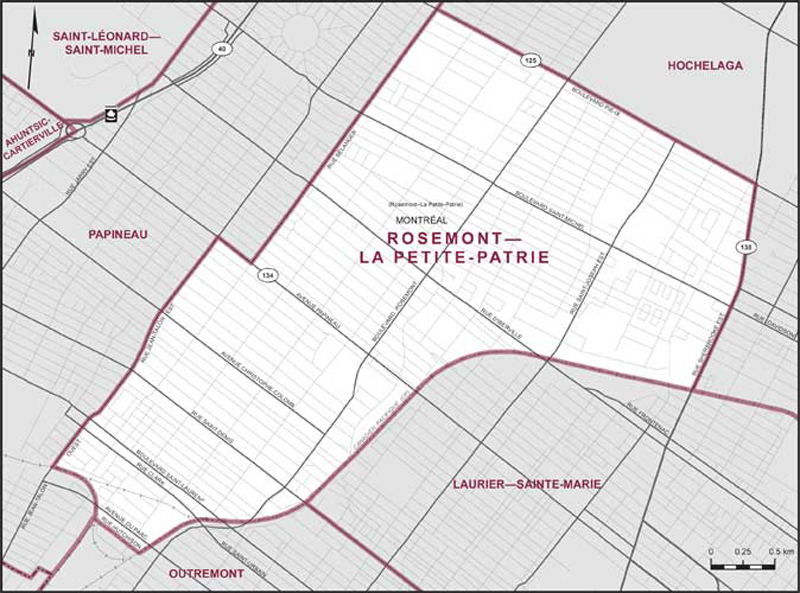
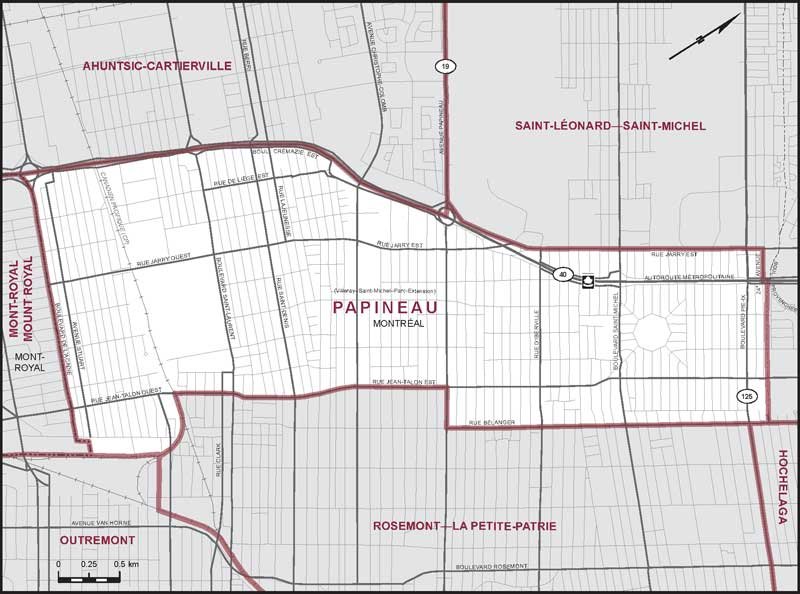
Electoral District:
PapineauProvince/Territory:
Québec-
Population:
110,813 -
Area:
10 km² -
Population density:
11,081.00/km² -
Population change:
n/a -
Average age:
39 -
Average income:
$43,160 -
Voter turnout:
66%
Language spoken most often at home:
-
English:
12,365 -
French:
58,770 -
Indigenous language:
10 -
Most popular other language:
-
Punjabi (Panjabi):
4,880
-
-
All others:
23,870
-
-
Electoral District:
Pierre-Boucher—Les Patriotes—VerchèresProvince/Territory:
Québec-
Population:
103,020 -
Area:
685 km² -
Population density:
150.00/km² -
Population change:
n/a -
Average age:
42 -
Average income:
$62,750 -
Voter turnout:
76%
Language spoken most often at home:
-
English:
2,055 -
French:
96,245 -
Indigenous language:
0 -
Most popular other language:
-
Spanish:
745
-
-
All others:
1,375
-
-
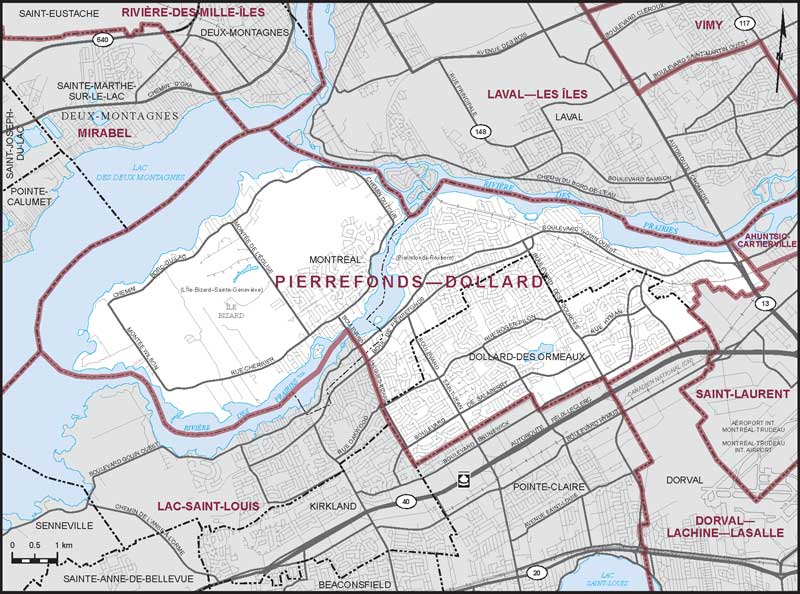
Electoral District:
Pierrefonds—DollardProvince/Territory:
Québec-
Population:
109,497 -
Area:
51 km² -
Population density:
2,147.00/km² -
Population change:
n/a -
Average age:
42 -
Average income:
$53,200 -
Voter turnout:
69%
Language spoken most often at home:
-
English:
48,465 -
French:
24,990 -
Indigenous language:
0 -
Most popular other language:
-
Arabic:
4,240
-
-
All others:
19,140
-
-
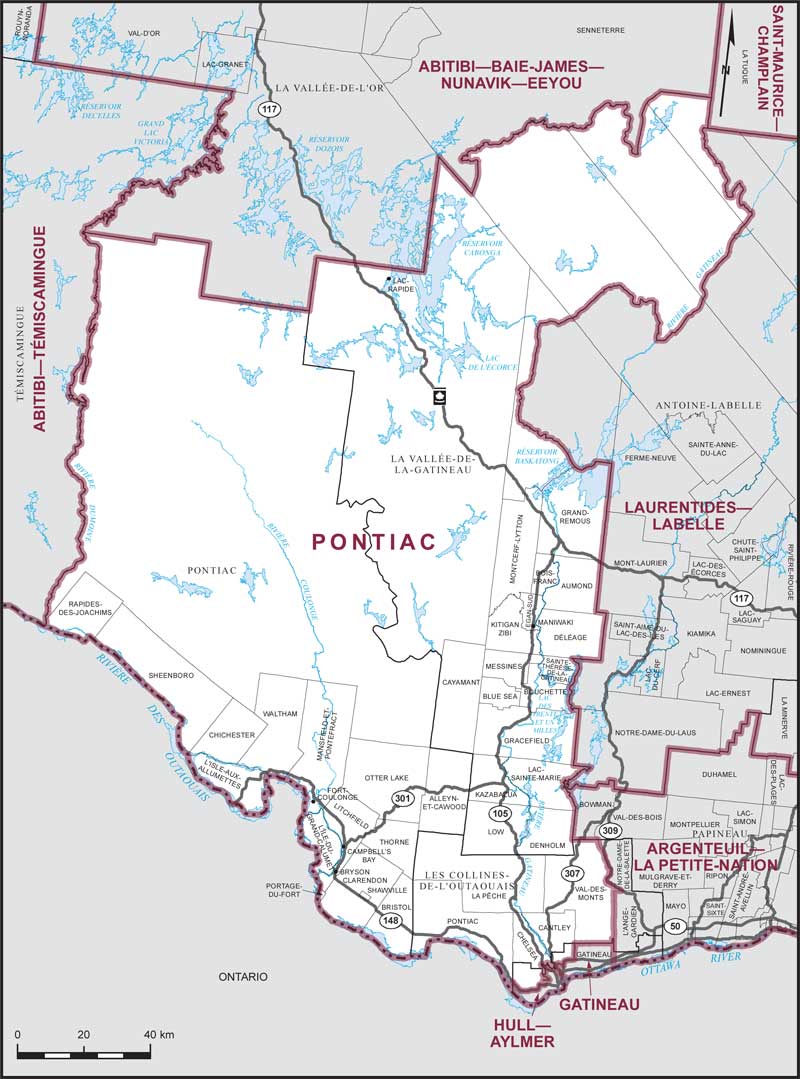
Electoral District:
Pontiac—Kitigan ZibiProvince/Territory:
Québec-
Population:
111,138 -
Area:
26,513 km² -
Population density:
4.00/km² -
Population change:
n/a -
Average age:
40 -
Average income:
$56,550 -
Voter turnout:
69%
Language spoken most often at home:
-
English:
34,020 -
French:
66,540 -
Indigenous language:
65 -
Most popular other language:
-
Arabic:
980
-
-
All others:
3,600
-
-
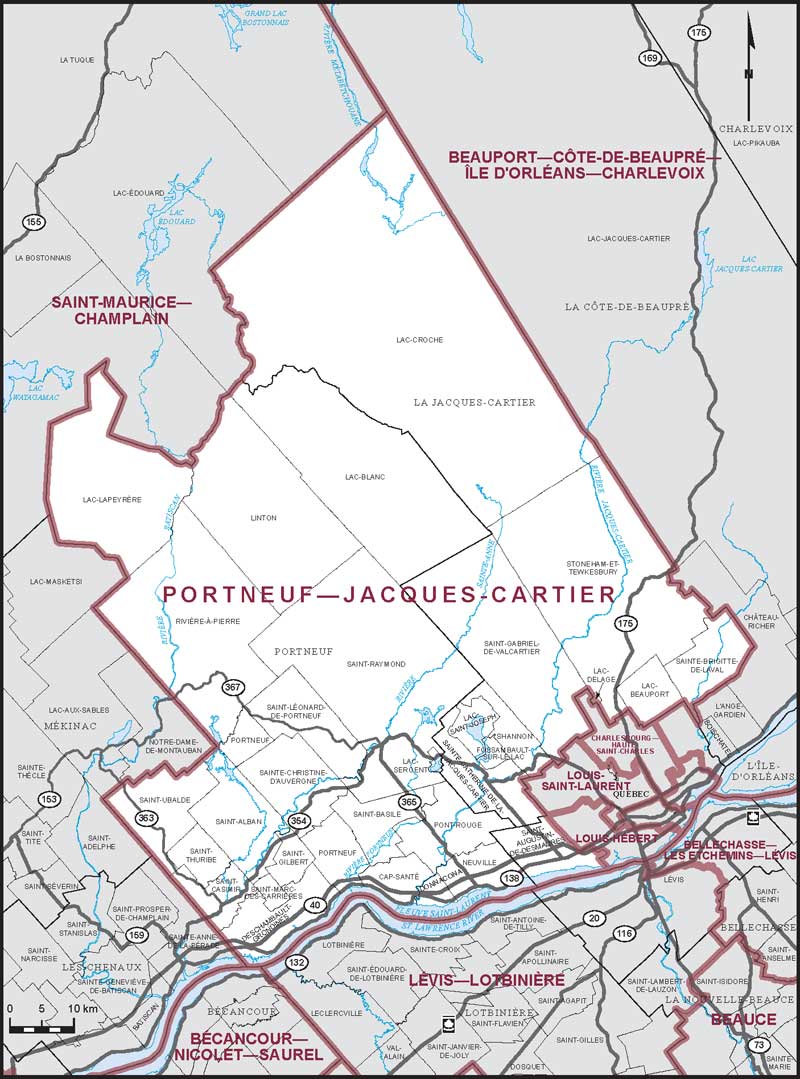
Electoral District:
Portneuf—Jacques-CartierProvince/Territory:
Québec-
Population:
106,611 -
Area:
6,987 km² -
Population density:
15.00/km² -
Population change:
n/a -
Average age:
42 -
Average income:
$55,650 -
Voter turnout:
74%
Language spoken most often at home:
-
English:
1,590 -
French:
102,550 -
Indigenous language:
0 -
Most popular other language:
-
Spanish:
220
-
-
All others:
290
-
-
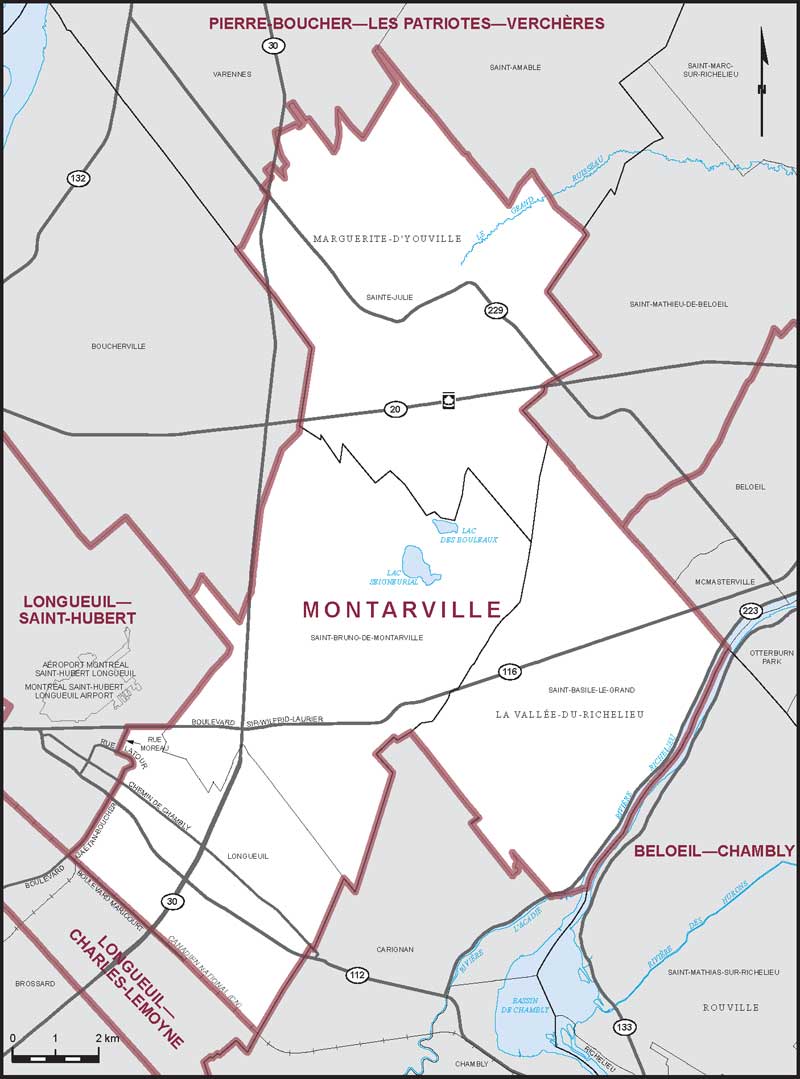
Electoral District:
Mont-Saint-Bruno—L'AcadieProvince/Territory:
Québec-
Population:
111,323 -
Area:
205 km² -
Population density:
543.00/km² -
Population change:
n/a -
Average age:
42 -
Average income:
$64,300 -
Voter turnout:
78%
Language spoken most often at home:
-
English:
6,060 -
French:
95,260 -
Indigenous language:
0 -
Most popular other language:
-
Spanish:
1,480
-
-
All others:
3,635
-
-
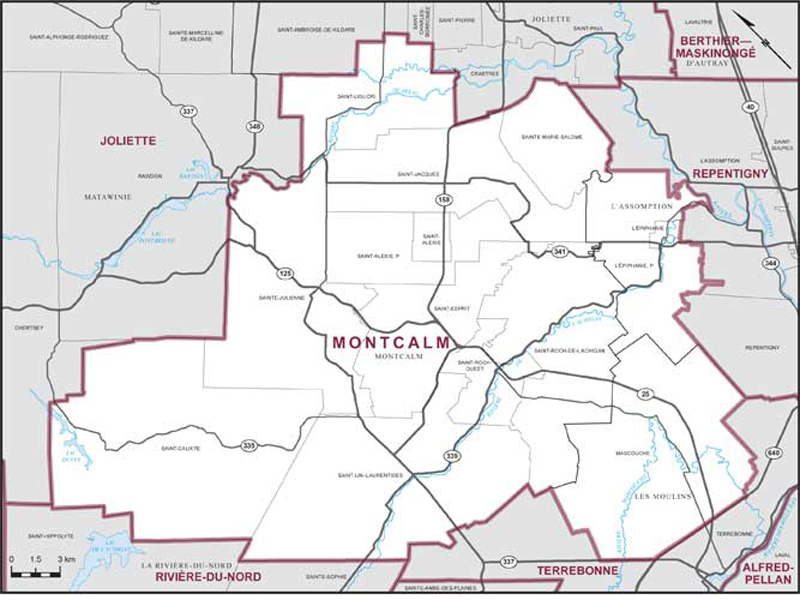
Electoral District:
MontcalmProvince/Territory:
Québec-
Population:
111,954 -
Area:
730 km² -
Population density:
153.00/km² -
Population change:
n/a -
Average age:
40 -
Average income:
$49,240 -
Voter turnout:
64%
Language spoken most often at home:
-
English:
1,925 -
French:
105,630 -
Indigenous language:
0 -
Most popular other language:
-
Spanish:
645
-
-
All others:
945
-
-
Electoral District:
Montmorency—CharlevoixProvince/Territory:
Québec-
Population:
101,119 -
Area:
11,282 km² -
Population density:
9.00/km² -
Population change:
n/a -
Average age:
44 -
Average income:
$53,800 -
Voter turnout:
72%
Language spoken most often at home:
-
English:
625 -
French:
97,905 -
Indigenous language:
0 -
Most popular other language:
-
Spanish:
160
-
-
All others:
360
-
-
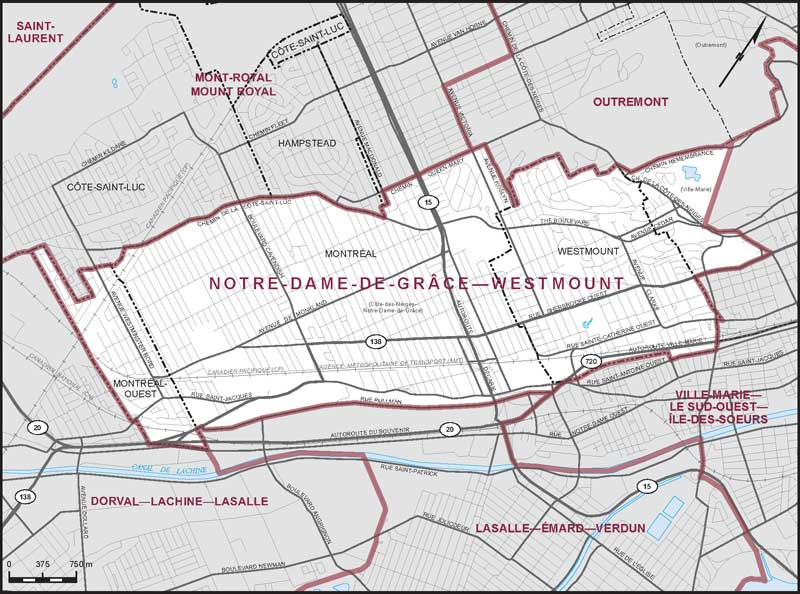
Electoral District:
Notre-Dame-de-Grâce—WestmountProvince/Territory:
Québec-
Population:
111,377 -
Area:
17 km² -
Population density:
6,552.00/km² -
Population change:
n/a -
Average age:
42 -
Average income:
$83,200 -
Voter turnout:
67%
Language spoken most often at home:
-
English:
55,300 -
French:
27,780 -
Indigenous language:
10 -
Most popular other language:
-
Mandarin:
2,520
-
-
All others:
15,405
-
-
Electoral District:
Mount RoyalProvince/Territory:
Québec-
Population:
112,706 -
Area:
23 km² -
Population density:
4,900.00/km² -
Population change:
n/a -
Average age:
41 -
Average income:
$63,500 -
Voter turnout:
66%
Language spoken most often at home:
-
English:
46,555 -
French:
25,820 -
Indigenous language:
0 -
Most popular other language:
-
Tagalog (Pilipino, Filipino):
3,995
-
-
All others:
23,700
-
-
Electoral District:
Longueuil—Charles-LeMoyneProvince/Territory:
Québec-
Population:
112,257 -
Area:
37 km² -
Population density:
3,034.00/km² -
Population change:
n/a -
Average age:
41 -
Average income:
$44,240 -
Voter turnout:
63%
Language spoken most often at home:
-
English:
11,910 -
French:
79,835 -
Indigenous language:
0 -
Most popular other language:
-
Spanish:
3,745
-
-
All others:
9,210
-