Federal Electoral District Fact Sheets
-
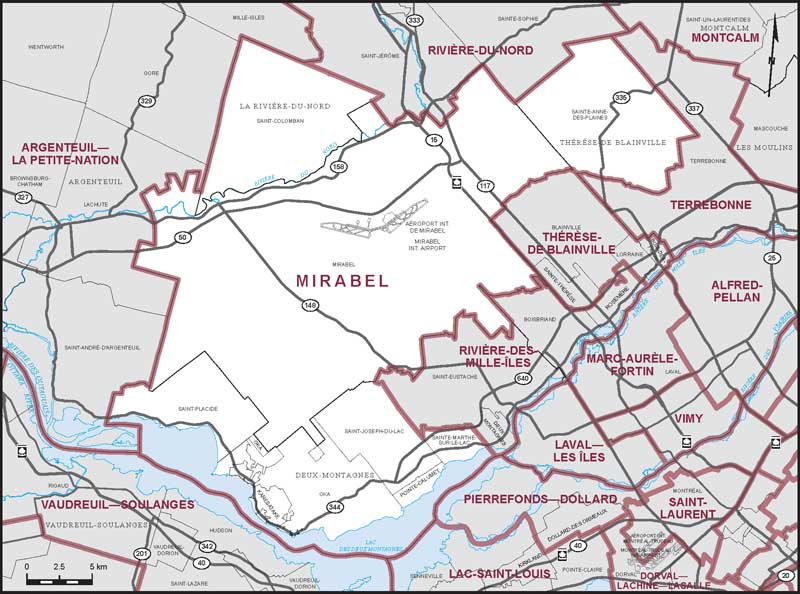
Electoral District:
Mount RoyalProvince/Territory:
Québec-
Population:
112,706 -
Area:
23 km² -
Population density:
4,900.00/km² -
Population change:
n/a -
Average age:
41 -
Average income:
$63,500 -
Voter turnout:
57%
Language spoken most often at home:
-
English:
46,555 -
French:
25,820 -
Indigenous language:
0 -
Most popular other language:
-
Tagalog (Pilipino, Filipino):
3,995
-
-
All others:
23,700
-
-
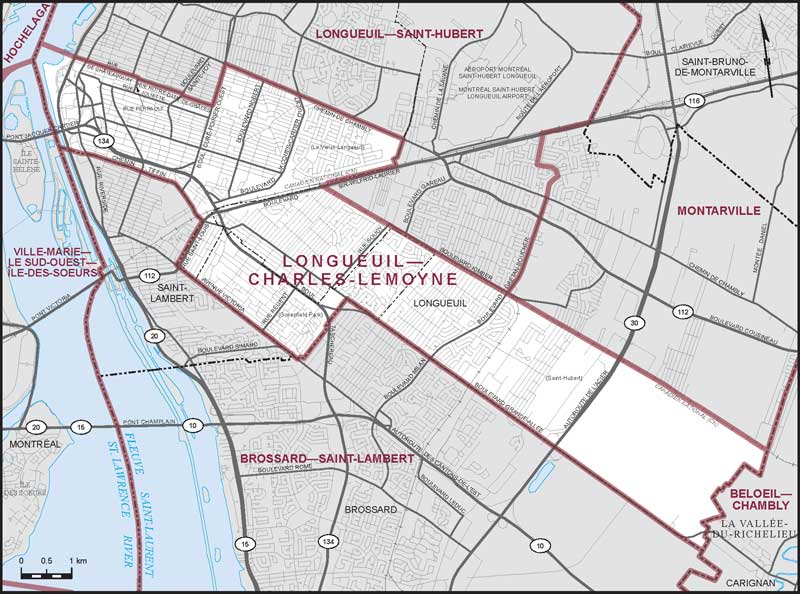
Electoral District:
Longueuil—Charles-LeMoyneProvince/Territory:
Québec-
Population:
112,257 -
Area:
37 km² -
Population density:
3,034.00/km² -
Population change:
n/a -
Average age:
41 -
Average income:
$44,240 -
Voter turnout:
60%
Language spoken most often at home:
-
English:
11,910 -
French:
79,835 -
Indigenous language:
0 -
Most popular other language:
-
Spanish:
3,745
-
-
All others:
9,210
-
-
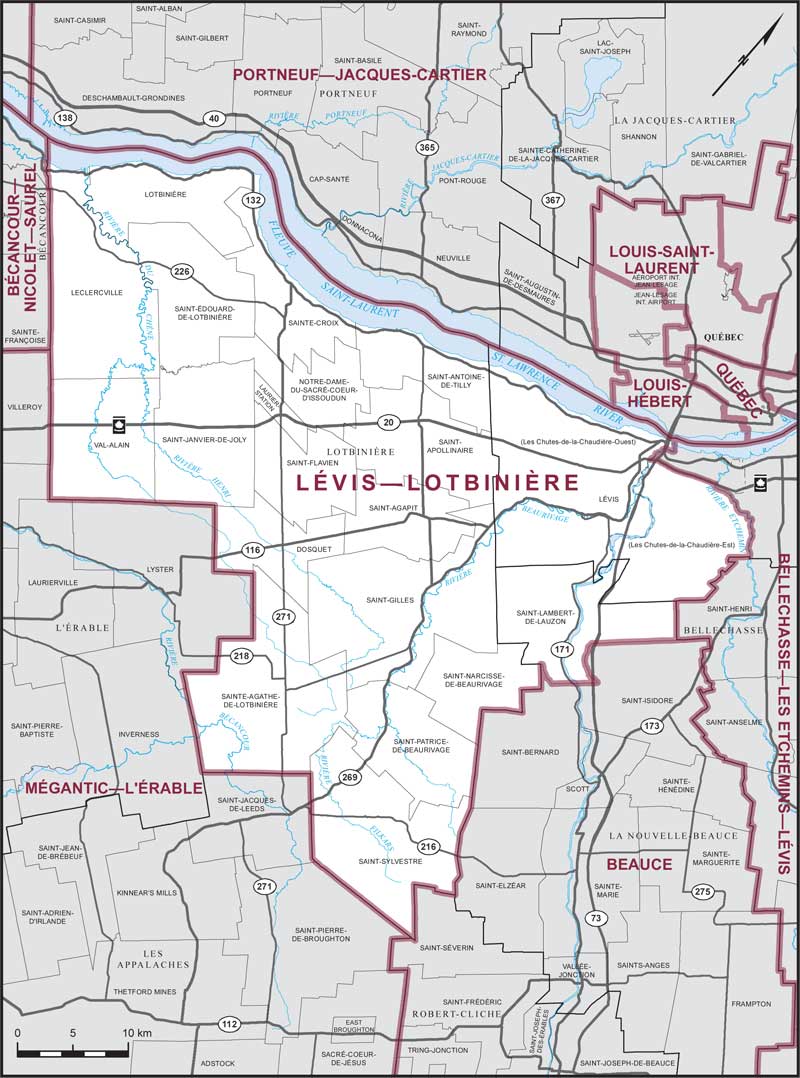
Electoral District:
Longueuil—Saint-HubertProvince/Territory:
Québec-
Population:
115,082 -
Area:
55 km² -
Population density:
2,092.00/km² -
Population change:
n/a -
Average age:
43 -
Average income:
$52,400 -
Voter turnout:
68%
Language spoken most often at home:
-
English:
5,235 -
French:
92,425 -
Indigenous language:
0 -
Most popular other language:
-
Spanish:
3,320
-
-
All others:
6,655
-
-
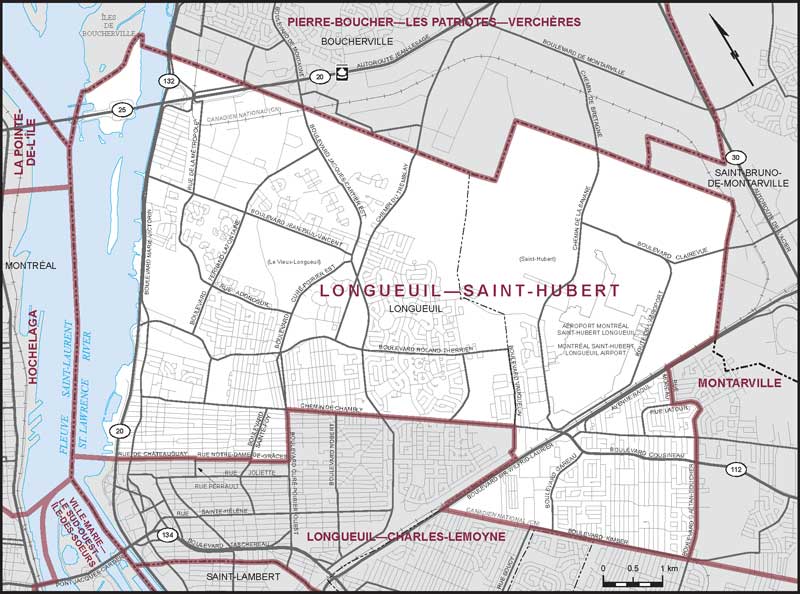
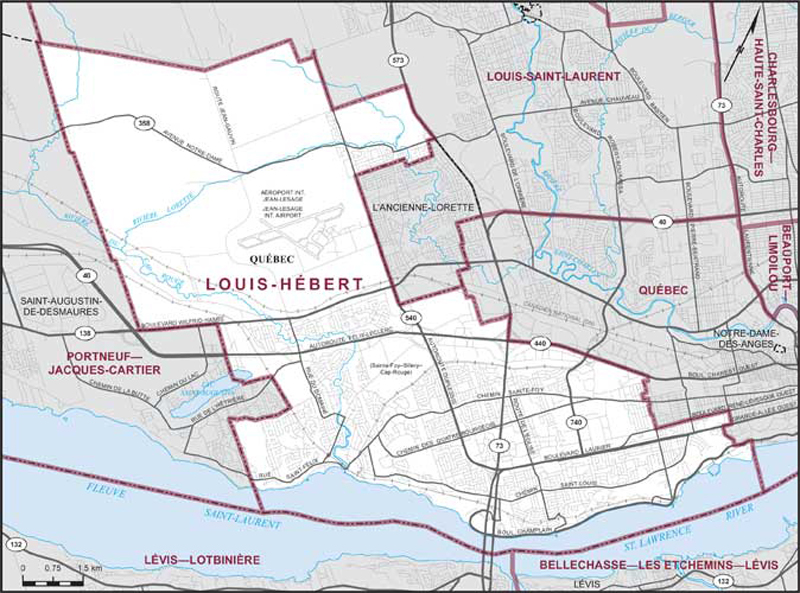
Electoral District:
Louis-HébertProvince/Territory:
Québec-
Population:
106,117 -
Area:
92 km² -
Population density:
1,153.00/km² -
Population change:
n/a -
Average age:
44 -
Average income:
$59,600 -
Voter turnout:
74%
Language spoken most often at home:
-
English:
1,895 -
French:
93,430 -
Indigenous language:
35 -
Most popular other language:
-
Spanish:
1,700
-
-
All others:
4,555
-
-
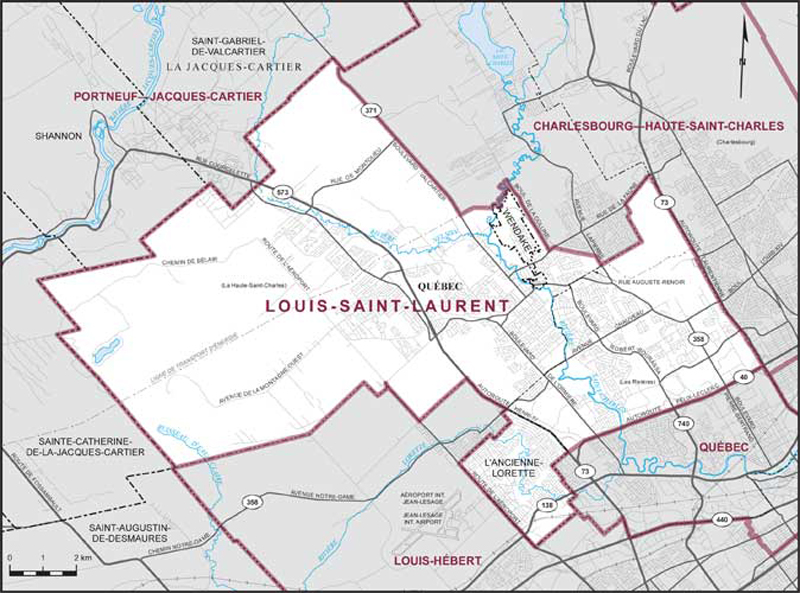
Electoral District:
Louis-Saint-Laurent—AkiawenhrahkProvince/Territory:
Québec-
Population:
113,220 -
Area:
125 km² -
Population density:
906.00/km² -
Population change:
n/a -
Average age:
43 -
Average income:
$54,500 -
Voter turnout:
68%
Language spoken most often at home:
-
English:
1,175 -
French:
107,150 -
Indigenous language:
120 -
Most popular other language:
-
Spanish:
755
-
-
All others:
1,300
-
-
Electoral District:
Marc-Aurèle-FortinProvince/Territory:
Québec-
Population:
104,636 -
Area:
53 km² -
Population density:
1,974.00/km² -
Population change:
n/a -
Average age:
40 -
Average income:
$55,050 -
Voter turnout:
67%
Language spoken most often at home:
-
English:
11,180 -
French:
71,270 -
Indigenous language:
5 -
Most popular other language:
-
Arabic:
3,570
-
-
All others:
9,735
-
-
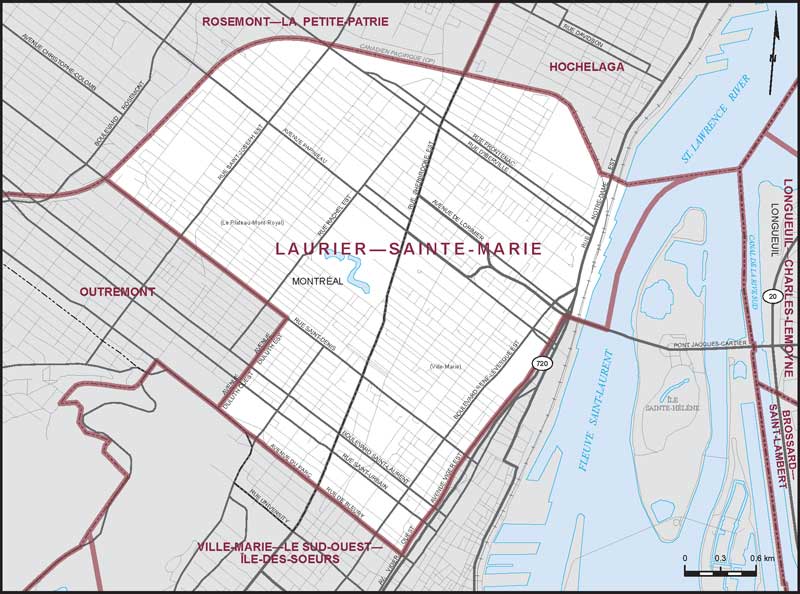
Electoral District:
Laurier—Sainte-MarieProvince/Territory:
Québec-
Population:
115,704 -
Area:
14 km² -
Population density:
8,265.00/km² -
Population change:
n/a -
Average age:
40 -
Average income:
$55,000 -
Voter turnout:
56%
Language spoken most often at home:
-
English:
20,375 -
French:
75,560 -
Indigenous language:
10 -
Most popular other language:
-
Spanish:
2,505
-
-
All others:
8,195
-
-
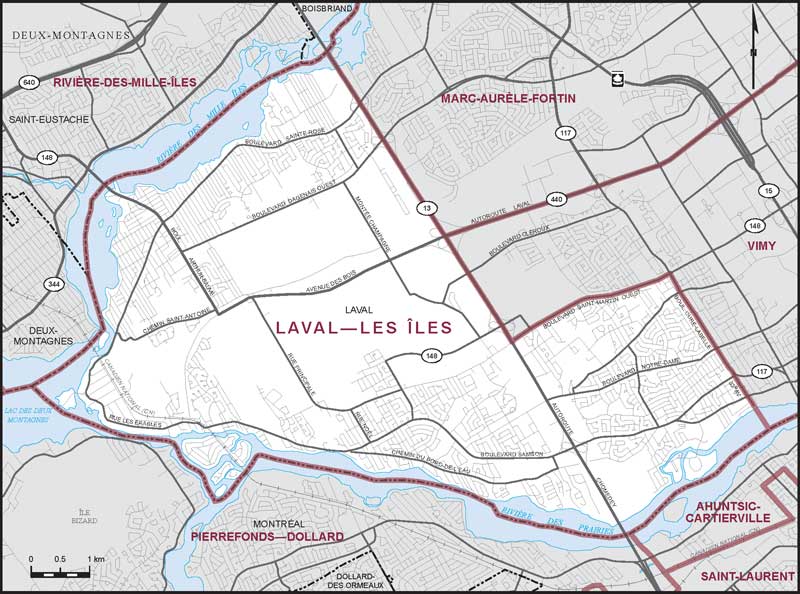
Electoral District:
Laval—Les ÎlesProvince/Territory:
Québec-
Population:
111,784 -
Area:
46 km² -
Population density:
2,430.00/km² -
Population change:
n/a -
Average age:
42 -
Average income:
$51,800 -
Voter turnout:
62%
Language spoken most often at home:
-
English:
22,895 -
French:
50,560 -
Indigenous language:
5 -
Most popular other language:
-
Arabic:
5,875
-
-
All others:
19,665
-
-
Electoral District:
Les Pays-d'en-HautProvince/Territory:
Québec-
Population:
106,834 -
Area:
1,632 km² -
Population density:
65.00/km² -
Population change:
n/a -
Average age:
46 -
Average income:
$53,950 -
Voter turnout:
63%
Language spoken most often at home:
-
English:
6,815 -
French:
96,780 -
Indigenous language:
0 -
Most popular other language:
-
Spanish:
205
-
-
All others:
595
-
-
Electoral District:
Lévis—LotbinièreProvince/Territory:
Québec-
Population:
112,830 -
Area:
1,106 km² -
Population density:
102.00/km² -
Population change:
n/a -
Average age:
41 -
Average income:
$56,300 -
Voter turnout:
71%
Language spoken most often at home:
-
English:
875 -
French:
109,165 -
Indigenous language:
0 -
Most popular other language:
-
Spanish:
355
-
-
All others:
540
-
-
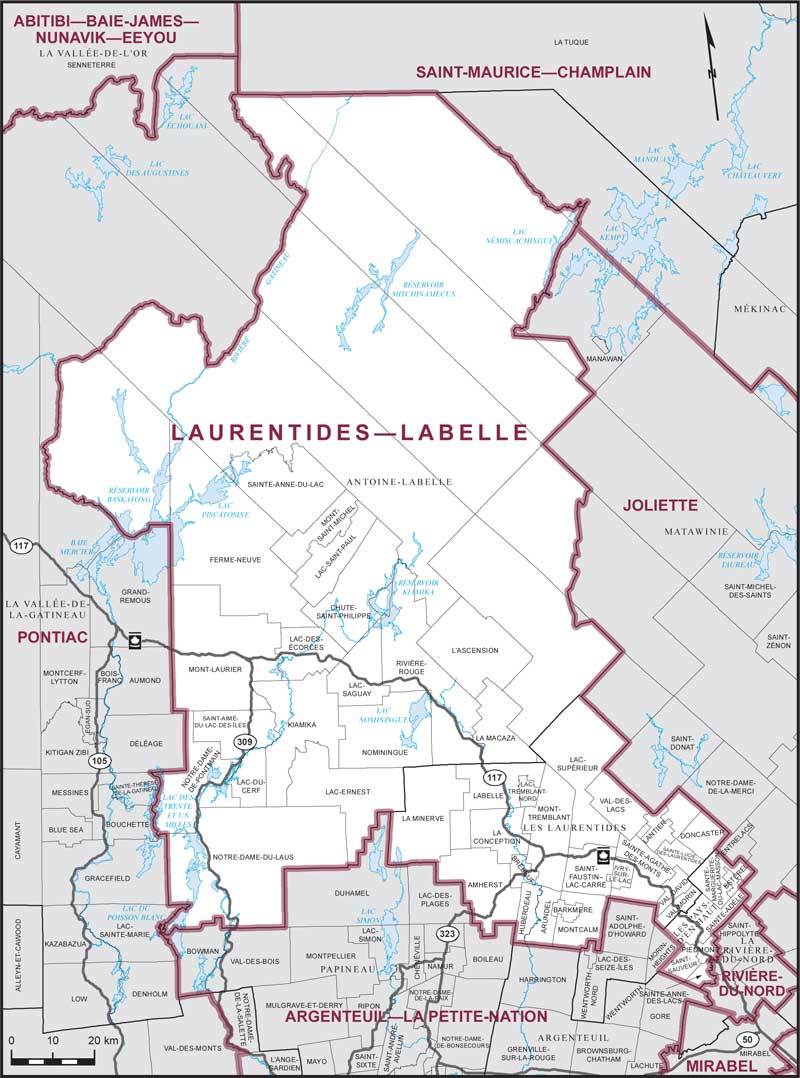
Electoral District:
Laurentides—LabelleProvince/Territory:
Québec-
Population:
92,897 -
Area:
17,866 km² -
Population density:
5.00/km² -
Population change:
n/a -
Average age:
49 -
Average income:
$45,320 -
Voter turnout:
61%
Language spoken most often at home:
-
English:
3,790 -
French:
86,305 -
Indigenous language:
5 -
Most popular other language:
-
Spanish:
190
-
-
All others:
305
-
-
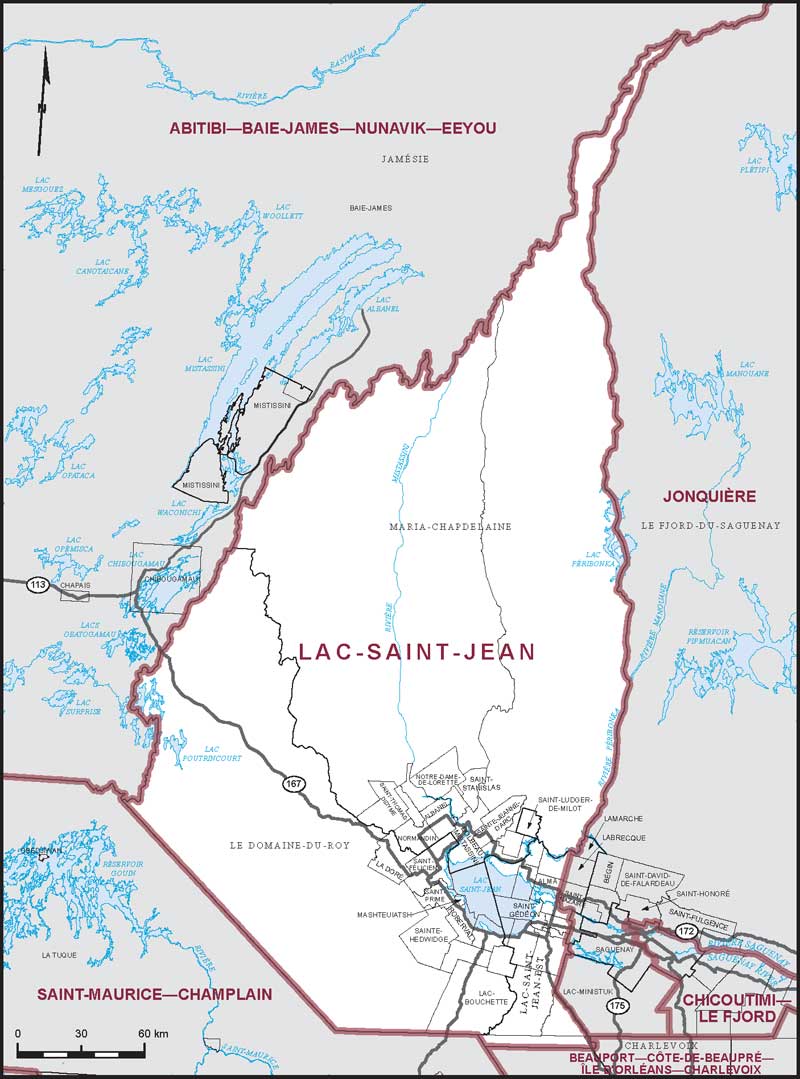
Electoral District:
Lac-Saint-JeanProvince/Territory:
Québec-
Population:
92,031 -
Area:
38,567 km² -
Population density:
2.00/km² -
Population change:
n/a -
Average age:
46 -
Average income:
$45,520 -
Voter turnout:
61%
Language spoken most often at home:
-
English:
200 -
French:
90,060 -
Indigenous language:
135 -
Most popular other language:
-
Spanish:
80
-
-
All others:
70
-
-
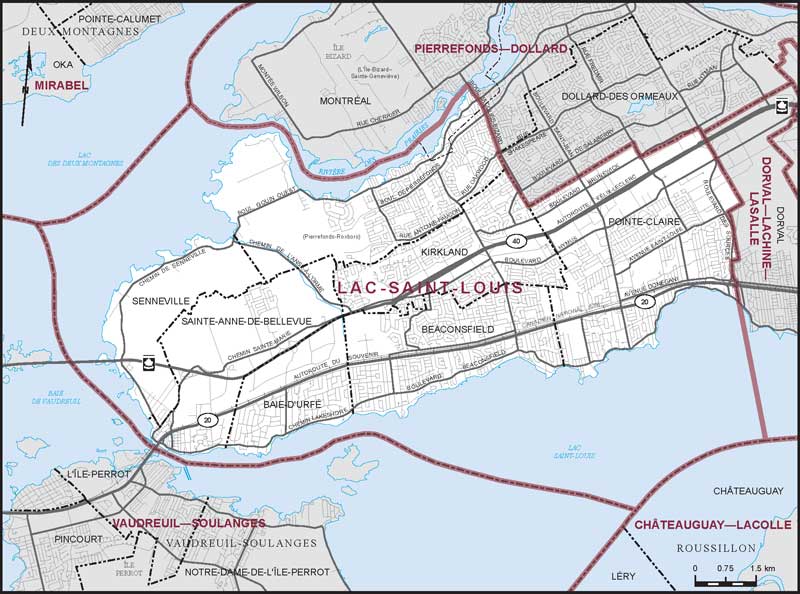
Electoral District:
Lac-Saint-LouisProvince/Territory:
Québec-
Population:
110,093 -
Area:
78 km² -
Population density:
1,411.00/km² -
Population change:
n/a -
Average age:
44 -
Average income:
$66,200 -
Voter turnout:
70%
Language spoken most often at home:
-
English:
63,395 -
French:
19,295 -
Indigenous language:
20 -
Most popular other language:
-
Mandarin:
4,630
-
-
All others:
12,750
-
-
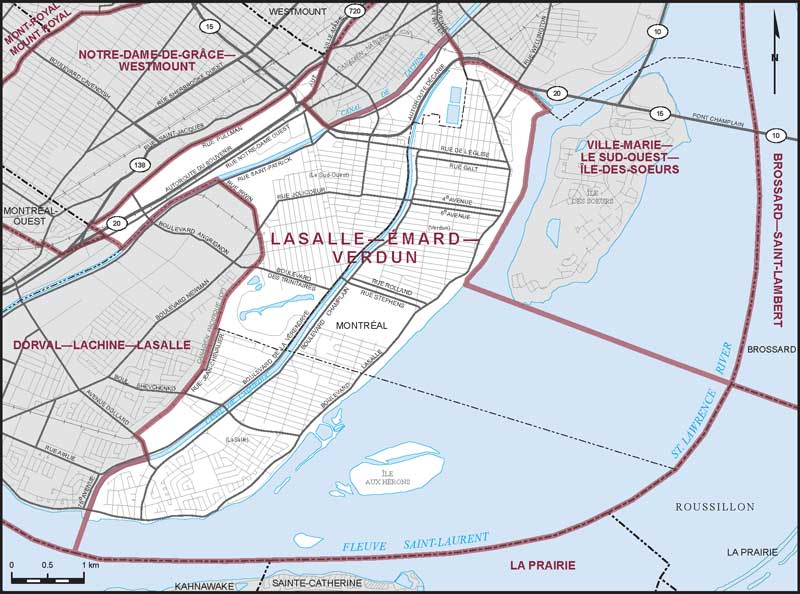
Electoral District:
LaSalle—Émard—VerdunProvince/Territory:
Québec-
Population:
112,298 -
Area:
20 km² -
Population density:
5,615.00/km² -
Population change:
n/a -
Average age:
42 -
Average income:
$47,440 -
Voter turnout:
60%
Language spoken most often at home:
-
English:
28,595 -
French:
60,240 -
Indigenous language:
15 -
Most popular other language:
-
Spanish:
2,660
-
-
All others:
11,435
-
-
Electoral District:
GatineauProvince/Territory:
Québec-
Population:
109,624 -
Area:
83 km² -
Population density:
1,321.00/km² -
Population change:
n/a -
Average age:
42 -
Average income:
$52,700 -
Voter turnout:
65%
Language spoken most often at home:
-
English:
9,525 -
French:
88,735 -
Indigenous language:
0 -
Most popular other language:
-
Arabic:
1,695
-
-
All others:
3,425
-
-
Electoral District:
Hochelaga—Rosemont-EstProvince/Territory:
Québec-
Population:
110,039 -
Area:
20 km² -
Population density:
5,502.00/km² -
Population change:
n/a -
Average age:
41 -
Average income:
$46,640 -
Voter turnout:
61%
Language spoken most often at home:
-
English:
6,995 -
French:
82,660 -
Indigenous language:
10 -
Most popular other language:
-
Spanish:
3,030
-
-
All others:
8,845
-
