Federal Electoral District Fact Sheets
-
Electoral District:
Honoré-MercierProvince/Territory:
Québec-
Population:
105,434 -
Area:
39 km² -
Population density:
2,703.00/km² -
Population change:
n/a -
Average age:
43 -
Average income:
$46,240 -
Voter turnout:
64%
Language spoken most often at home:
-
English:
19,750 -
French:
56,515 -
Indigenous language:
0 -
Most popular other language:
-
Italian:
3,995
-
-
All others:
13,835
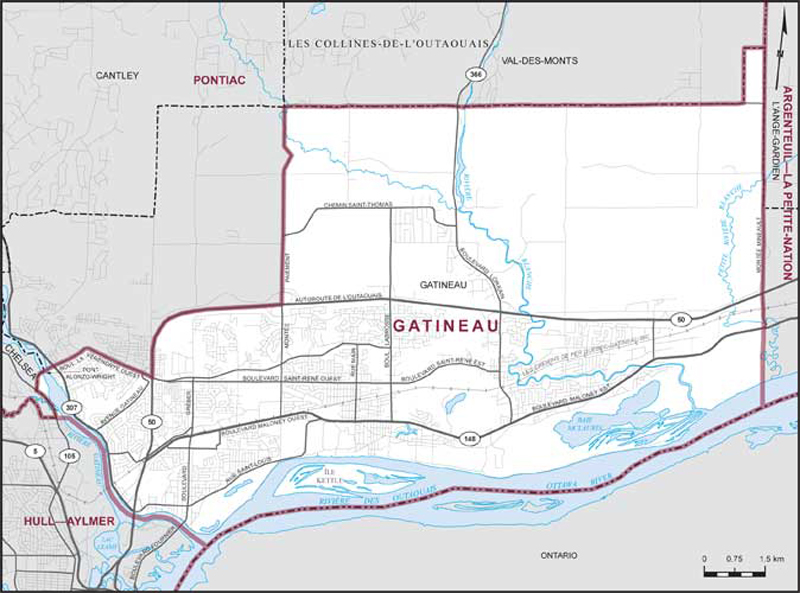
-
-
Electoral District:
Hull—AylmerProvince/Territory:
Québec-
Population:
105,559 -
Area:
61 km² -
Population density:
1,730.00/km² -
Population change:
n/a -
Average age:
41 -
Average income:
$54,450 -
Voter turnout:
66%
Language spoken most often at home:
-
English:
24,780 -
French:
62,220 -
Indigenous language:
20 -
Most popular other language:
-
Arabic:
1,830
-
-
All others:
6,670
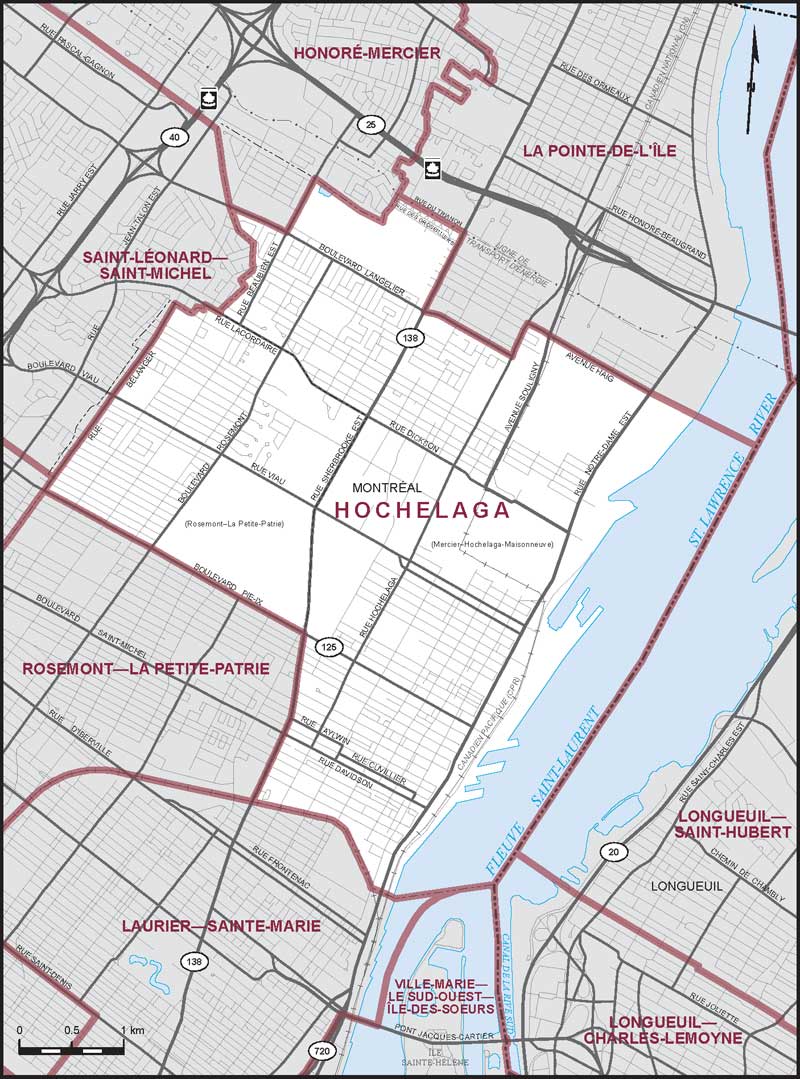
-
-
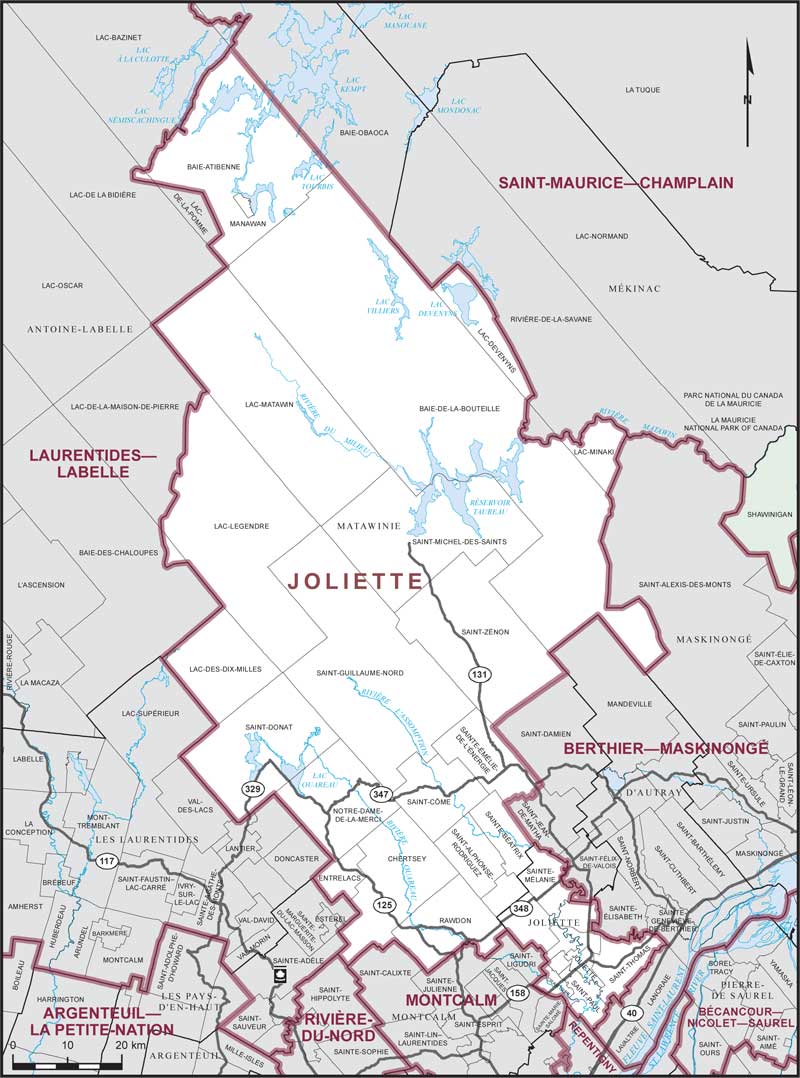
Electoral District:
Joliette—ManawanProvince/Territory:
Québec-
Population:
104,882 -
Area:
7,212 km² -
Population density:
15.00/km² -
Population change:
n/a -
Average age:
45 -
Average income:
$45,440 -
Voter turnout:
62%
Language spoken most often at home:
-
English:
1,880 -
French:
97,620 -
Indigenous language:
1,750 -
Most popular other language:
-
Spanish:
410
-
-
All others:
775
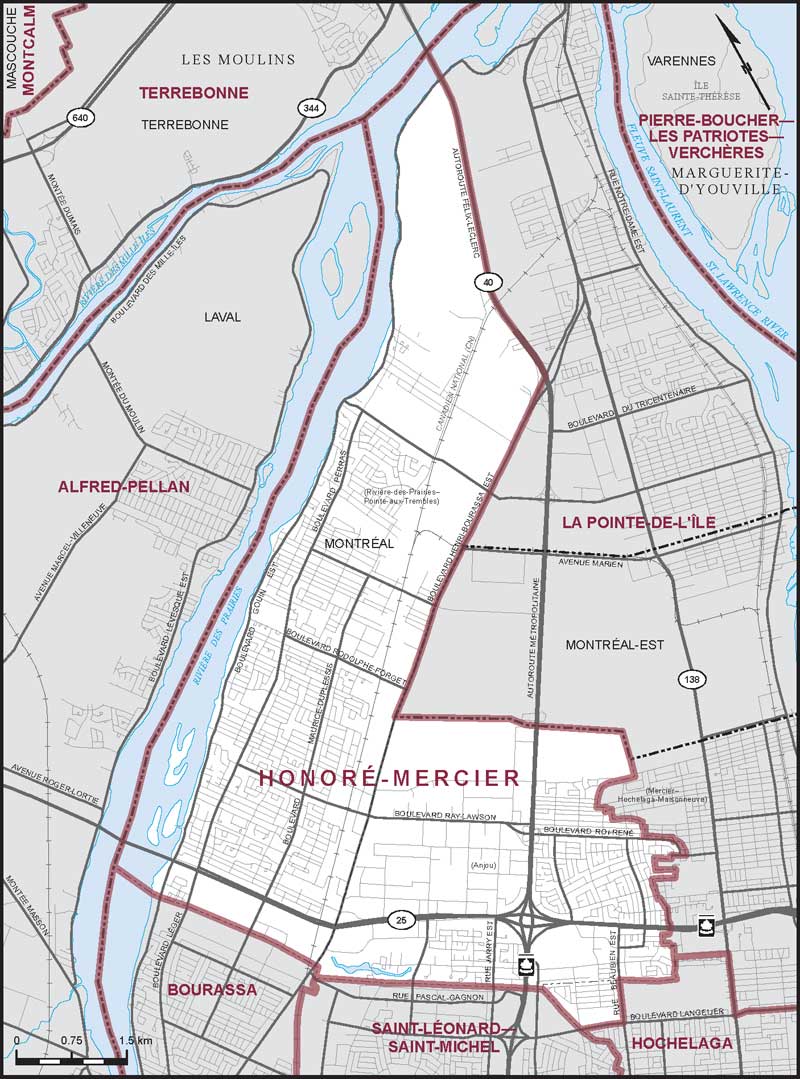
-
-
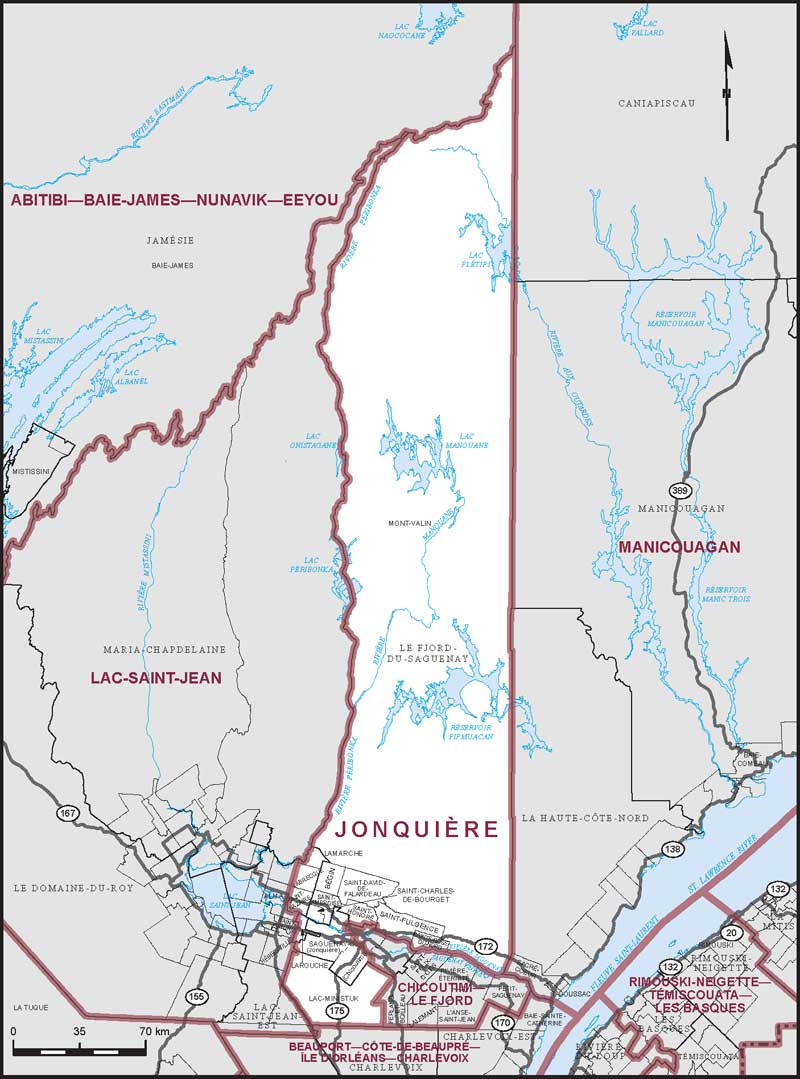
Electoral District:
JonquièreProvince/Territory:
Québec-
Population:
91,061 -
Area:
53,385 km² -
Population density:
2.00/km² -
Population change:
n/a -
Average age:
44 -
Average income:
$48,720 -
Voter turnout:
63%
Language spoken most often at home:
-
English:
400 -
French:
89,230 -
Indigenous language:
10 -
Most popular other language:
-
Spanish:
80
-
-
All others:
105
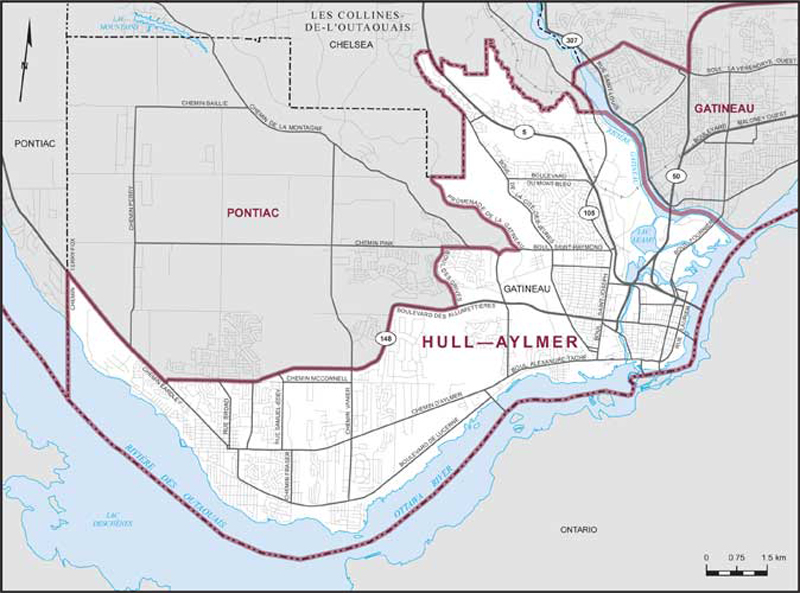
-
-
Electoral District:
La Pointe-de-l'ÎleProvince/Territory:
Québec-
Population:
110,486 -
Area:
41 km² -
Population density:
2,695.00/km² -
Population change:
n/a -
Average age:
43 -
Average income:
$46,600 -
Voter turnout:
62%
Language spoken most often at home:
-
English:
3,975 -
French:
88,855 -
Indigenous language:
0 -
Most popular other language:
-
Spanish:
2,915
-
-
All others:
6,055
-
-
Electoral District:
La Prairie—AtatekenProvince/Territory:
Québec-
Population:
114,968 -
Area:
278 km² -
Population density:
414.00/km² -
Population change:
n/a -
Average age:
40 -
Average income:
$60,050 -
Voter turnout:
68%
Language spoken most often at home:
-
English:
8,570 -
French:
90,920 -
Indigenous language:
0 -
Most popular other language:
-
Spanish:
2,280
-
-
All others:
7,215
-
-
Electoral District:
Dorval—Lachine—LaSalleProvince/Territory:
Québec-
Population:
114,661 -
Area:
49 km² -
Population density:
2,340.00/km² -
Population change:
n/a -
Average age:
42 -
Average income:
$47,680 -
Voter turnout:
59%
Language spoken most often at home:
-
English:
40,750 -
French:
42,470 -
Indigenous language:
40 -
Most popular other language:
-
Mandarin:
3,445
-
-
All others:
17,465
-
-
Electoral District:
DrummondProvince/Territory:
Québec-
Population:
107,967 -
Area:
1,599 km² -
Population density:
68.00/km² -
Population change:
n/a -
Average age:
43 -
Average income:
$45,080 -
Voter turnout:
61%
Language spoken most often at home:
-
English:
1,055 -
French:
102,455 -
Indigenous language:
0 -
Most popular other language:
-
Spanish:
865
-
-
All others:
1,045
-
-
Electoral District:
BourassaProvince/Territory:
Québec-
Population:
105,637 -
Area:
14 km² -
Population density:
7,546.00/km² -
Population change:
n/a -
Average age:
41 -
Average income:
$38,960 -
Voter turnout:
56%
Language spoken most often at home:
-
English:
8,235 -
French:
62,265 -
Indigenous language:
0 -
Most popular other language:
-
Spanish:
5,290
-
-
All others:
18,375
-
-
Electoral District:
Gaspésie—Les Îles-de-la-Madeleine—ListugujProvince/Territory:
Québec-
Population:
110,225 -
Area:
23,587 km² -
Population density:
5.00/km² -
Population change:
n/a -
Average age:
49 -
Average income:
$43,280 -
Voter turnout:
57%
Language spoken most often at home:
-
English:
7,020 -
French:
101,080 -
Indigenous language:
70 -
Most popular other language:
-
Spanish:
90
-
-
All others:
140
-
-
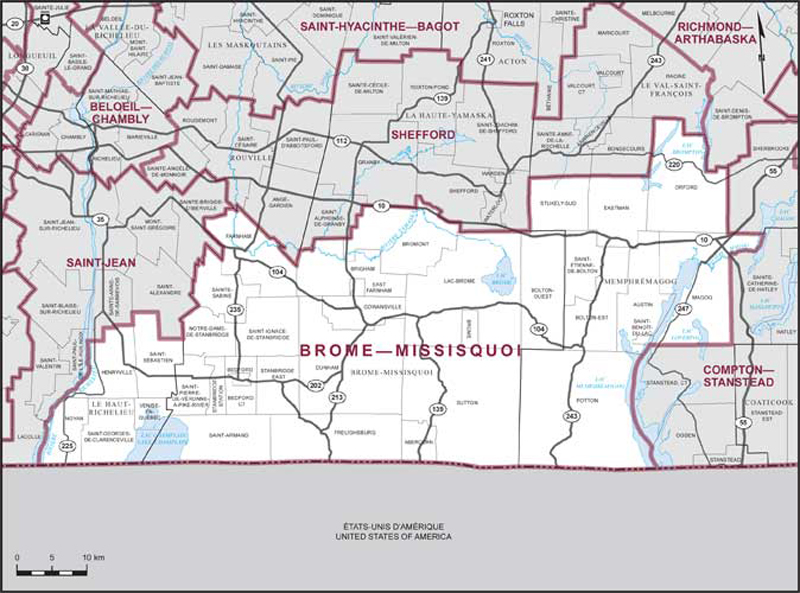
Electoral District:
Brome—MissisquoiProvince/Territory:
Québec-
Population:
113,913 -
Area:
2,779 km² -
Population density:
41.00/km² -
Population change:
n/a -
Average age:
48 -
Average income:
$52,800 -
Voter turnout:
66%
Language spoken most often at home:
-
English:
14,715 -
French:
93,990 -
Indigenous language:
0 -
Most popular other language:
-
Spanish:
295
-
-
All others:
515
-
-
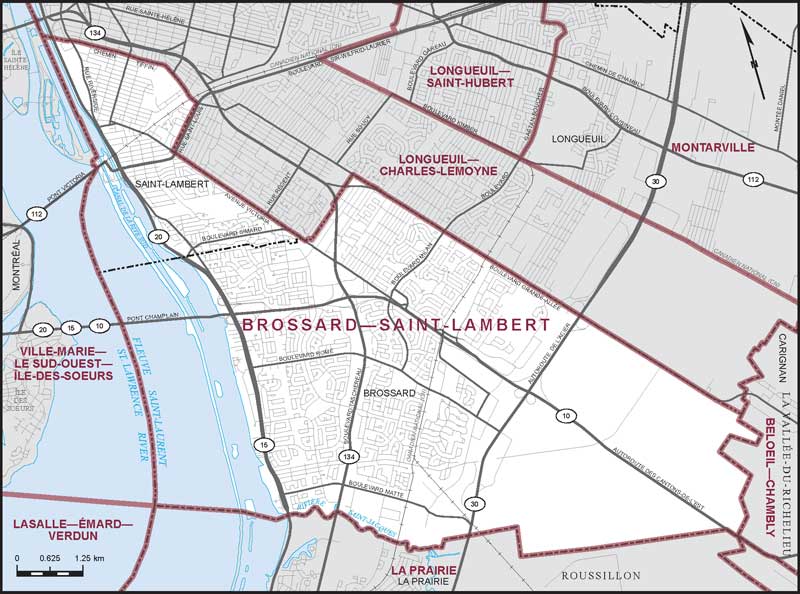
Electoral District:
Brossard—Saint-LambertProvince/Territory:
Québec-
Population:
114,286 -
Area:
53 km² -
Population density:
2,156.00/km² -
Population change:
n/a -
Average age:
44 -
Average income:
$60,200 -
Voter turnout:
64%
Language spoken most often at home:
-
English:
19,590 -
French:
55,415 -
Indigenous language:
0 -
Most popular other language:
-
Mandarin:
5,840
-
-
All others:
21,645
-
-
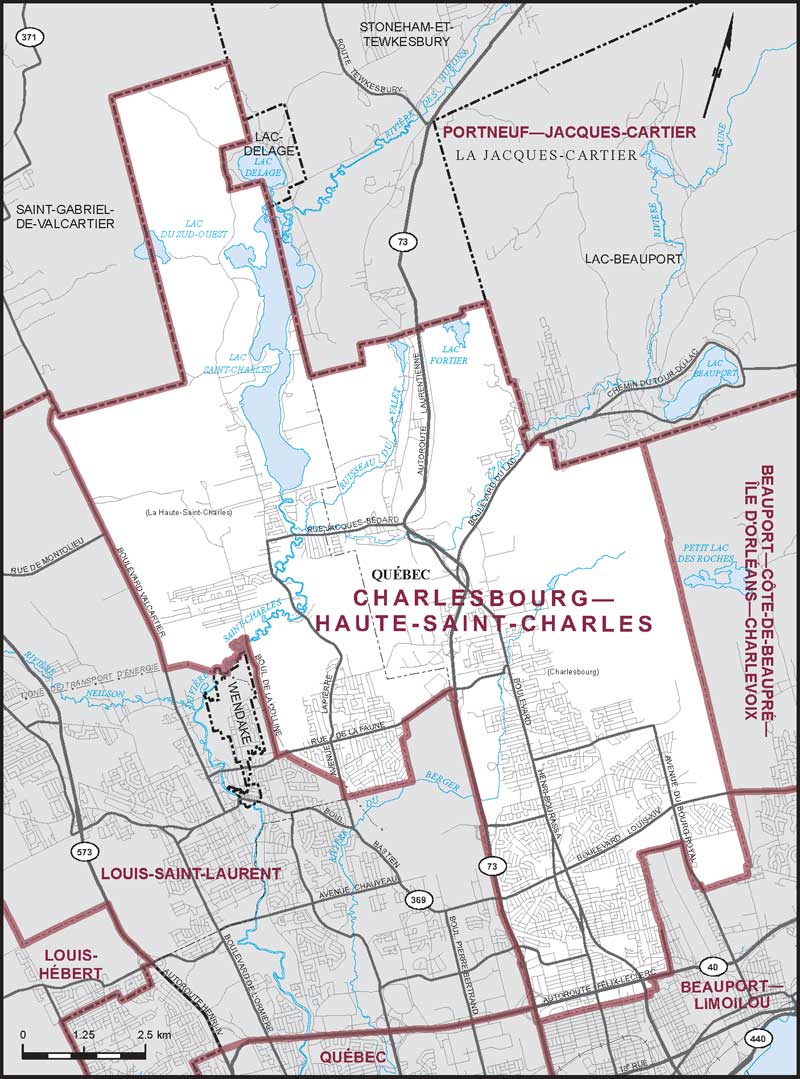
Electoral District:
Charlesbourg—Haute-Saint-CharlesProvince/Territory:
Québec-
Population:
113,308 -
Area:
118 km² -
Population density:
960.00/km² -
Population change:
n/a -
Average age:
43 -
Average income:
$51,500 -
Voter turnout:
68%
Language spoken most often at home:
-
English:
925 -
French:
107,565 -
Indigenous language:
30 -
Most popular other language:
-
Spanish:
670
-
-
All others:
1,485
-
-
Electoral District:
Châteauguay—Les Jardins-de-NapiervilleProvince/Territory:
Québec-
Population:
114,947 -
Area:
1,460 km² -
Population density:
79.00/km² -
Population change:
n/a -
Average age:
41 -
Average income:
$48,400 -
Voter turnout:
63%
Language spoken most often at home:
-
English:
20,235 -
French:
83,980 -
Indigenous language:
5 -
Most popular other language:
-
Spanish:
1,495
-
-
All others:
4,360
-
-
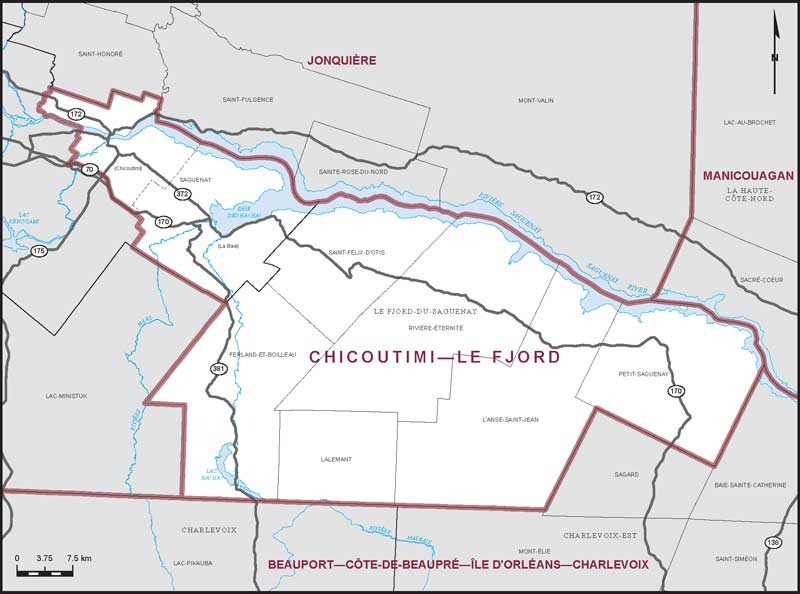
Electoral District:
Chicoutimi—Le FjordProvince/Territory:
Québec-
Population:
92,460 -
Area:
3,591 km² -
Population density:
26.00/km² -
Population change:
n/a -
Average age:
45 -
Average income:
$48,480 -
Voter turnout:
65%
Language spoken most often at home:
-
English:
675 -
French:
90,170 -
Indigenous language:
55 -
Most popular other language:
-
Spanish:
135
-
-
All others:
340
-
-
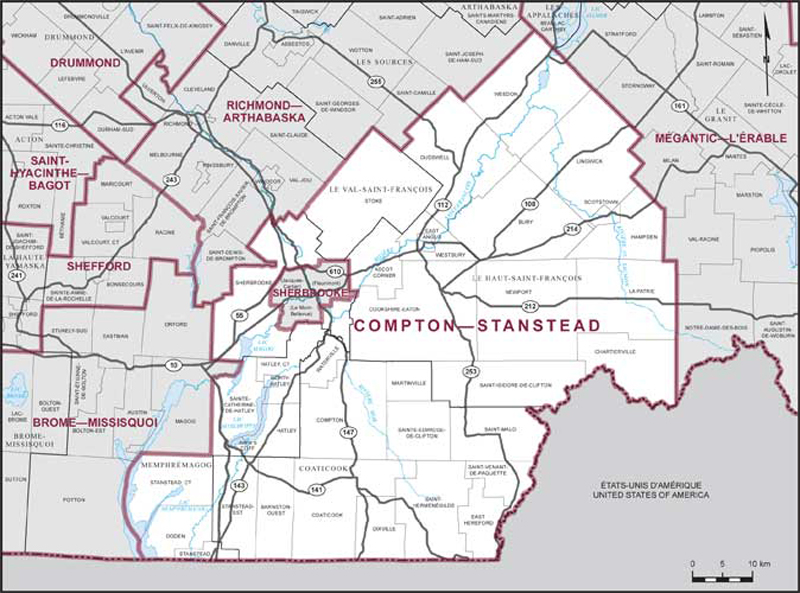
Electoral District:
Compton—StansteadProvince/Territory:
Québec-
Population:
113,282 -
Area:
4,558 km² -
Population density:
25.00/km² -
Population change:
n/a -
Average age:
42 -
Average income:
$48,960 -
Voter turnout:
67%
Language spoken most often at home:
-
English:
11,775 -
French:
97,180 -
Indigenous language:
0 -
Most popular other language:
-
Spanish:
710
-
-
All others:
775
-
