Federal Electoral District Fact Sheets
-
Electoral District:
Côte-du-Sud—Rivière-du-Loup—Kataskomiq—TémiscouataProvince/Territory:
Québec-
Population:
116,216 -
Area:
11,217 km² -
Population density:
10.00/km² -
Population change:
n/a -
Average age:
47 -
Average income:
$43,520 -
Voter turnout:
62%
Language spoken most often at home:
-
English:
440 -
French:
113,055 -
Indigenous language:
0 -
Most popular other language:
-
Spanish:
250
-
-
All others:
235
-
-
Electoral District:
Côte-Nord—Kawawachikamach—NitassinanProvince/Territory:
Québec-
Population:
88,525 -
Area:
234,442 km² -
Population density:
0.40/km² -
Population change:
n/a -
Average age:
44 -
Average income:
$53,100 -
Voter turnout:
50%
Language spoken most often at home:
-
English:
4,025 -
French:
75,885 -
Indigenous language:
5,660 -
Most popular other language:
-
Spanish:
80
-
-
All others:
200
-
-
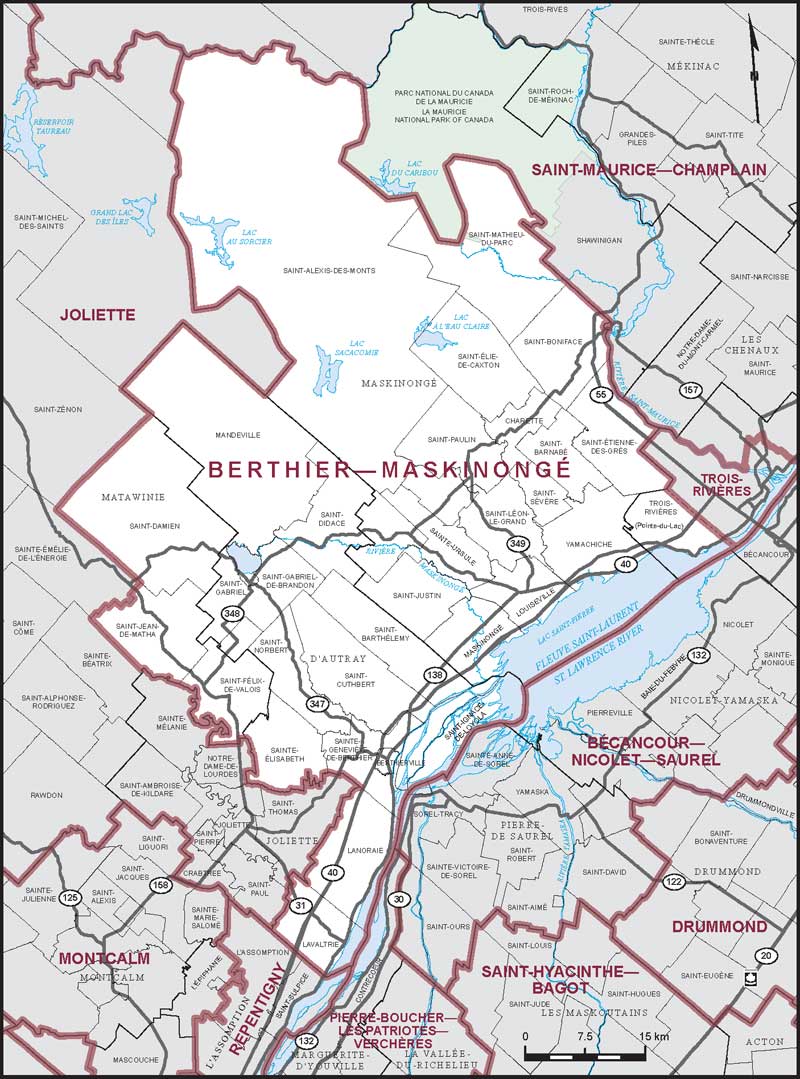
Electoral District:
Berthier—MaskinongéProvince/Territory:
Québec-
Population:
108,640 -
Area:
4,151 km² -
Population density:
26.00/km² -
Population change:
n/a -
Average age:
46 -
Average income:
$44,520 -
Voter turnout:
65%
Language spoken most often at home:
-
English:
825 -
French:
105,350 -
Indigenous language:
0 -
Most popular other language:
-
Spanish:
265
-
-
All others:
300
-
-
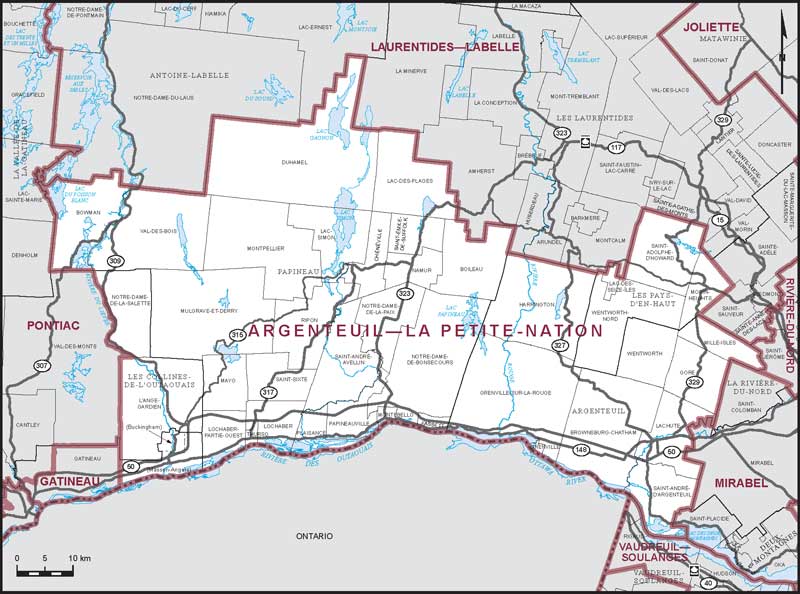
Electoral District:
Argenteuil—La Petite-NationProvince/Territory:
Québec-
Population:
108,903 -
Area:
4,802 km² -
Population density:
23.00/km² -
Population change:
n/a -
Average age:
44 -
Average income:
$47,760 -
Voter turnout:
60%
Language spoken most often at home:
-
English:
10,450 -
French:
94,865 -
Indigenous language:
0 -
Most popular other language:
-
Spanish:
195
-
-
All others:
595
-
-
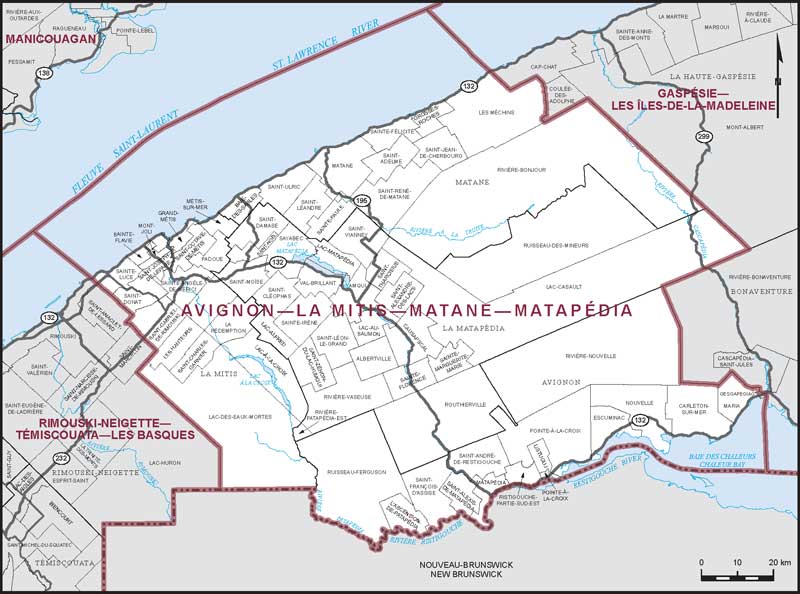
Electoral District:
BeauceProvince/Territory:
Québec-
Population:
111,034 -
Area:
4,101 km² -
Population density:
27.00/km² -
Population change:
n/a -
Average age:
43 -
Average income:
$46,120 -
Voter turnout:
67%
Language spoken most often at home:
-
English:
510 -
French:
107,515 -
Indigenous language:
0 -
Most popular other language:
-
Spanish:
675
-
-
All others:
325
-
-
Electoral District:
Beauharnois—Salaberry—Soulanges—HuntingdonProvince/Territory:
Québec-
Population:
118,474 -
Area:
1,663 km² -
Population density:
71.00/km² -
Population change:
n/a -
Average age:
43 -
Average income:
$46,640 -
Voter turnout:
63%
Language spoken most often at home:
-
English:
10,855 -
French:
102,545 -
Indigenous language:
10 -
Most popular other language:
-
Spanish:
410
-
-
All others:
895
-
-
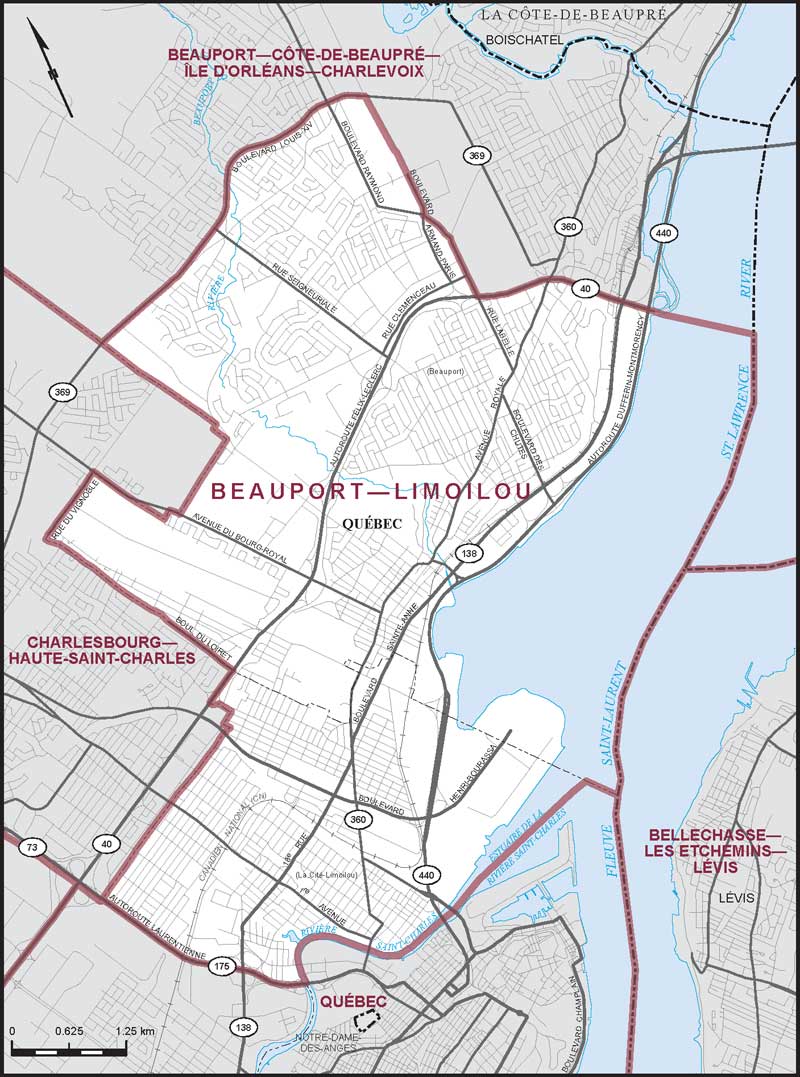
Electoral District:
Beauport—LimoilouProvince/Territory:
Québec-
Population:
113,598 -
Area:
43 km² -
Population density:
2,642.00/km² -
Population change:
n/a -
Average age:
44 -
Average income:
$46,040 -
Voter turnout:
65%
Language spoken most often at home:
-
English:
975 -
French:
105,815 -
Indigenous language:
35 -
Most popular other language:
-
Spanish:
815
-
-
All others:
2,310
-
-
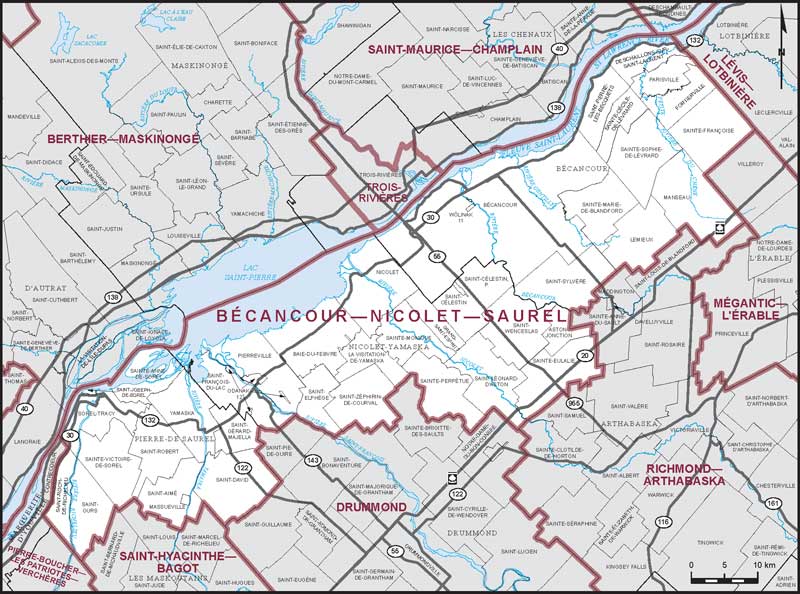
Electoral District:
Bécancour—Nicolet—Saurel—AlnôbakProvince/Territory:
Québec-
Population:
96,439 -
Area:
2,743 km² -
Population density:
35.00/km² -
Population change:
n/a -
Average age:
47 -
Average income:
$45,320 -
Voter turnout:
63%
Language spoken most often at home:
-
English:
645 -
French:
92,730 -
Indigenous language:
0 -
Most popular other language:
-
Spanish:
230
-
-
All others:
345
-
-
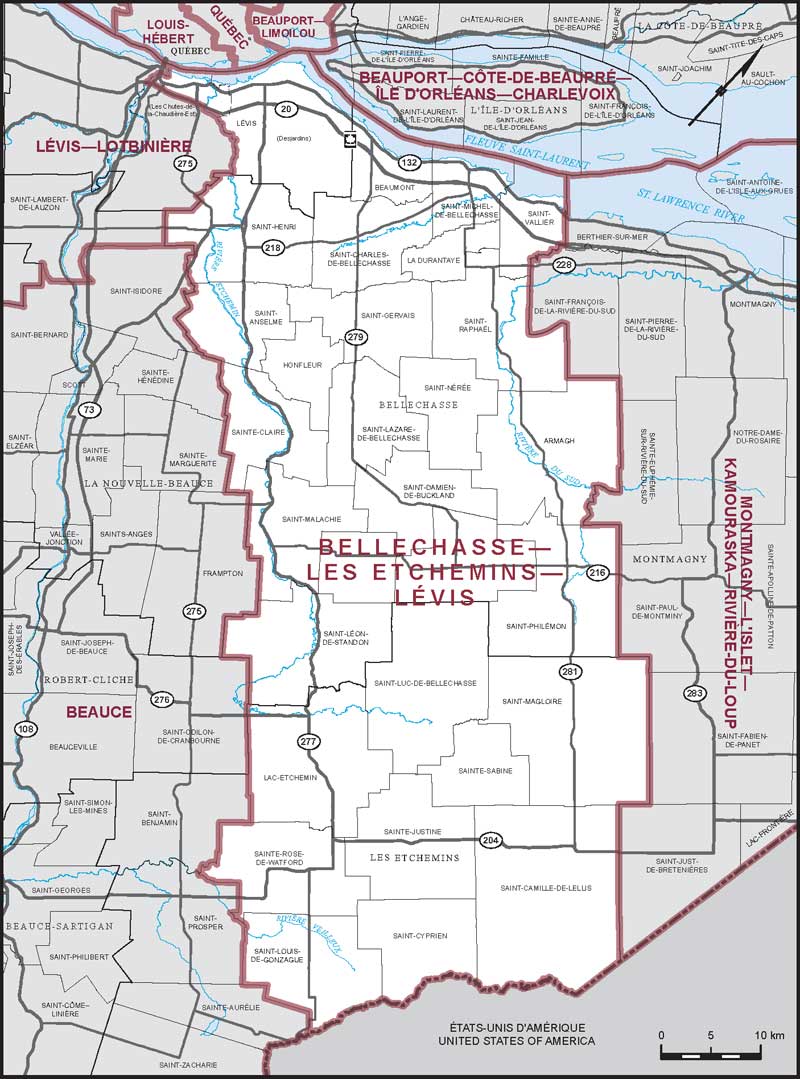
Electoral District:
Bellechasse—Les Etchemins—LévisProvince/Territory:
Québec-
Population:
111,737 -
Area:
3,192 km² -
Population density:
35.00/km² -
Population change:
n/a -
Average age:
45 -
Average income:
$48,960 -
Voter turnout:
66%
Language spoken most often at home:
-
English:
695 -
French:
107,190 -
Indigenous language:
0 -
Most popular other language:
-
Spanish:
460
-
-
All others:
650
-
-
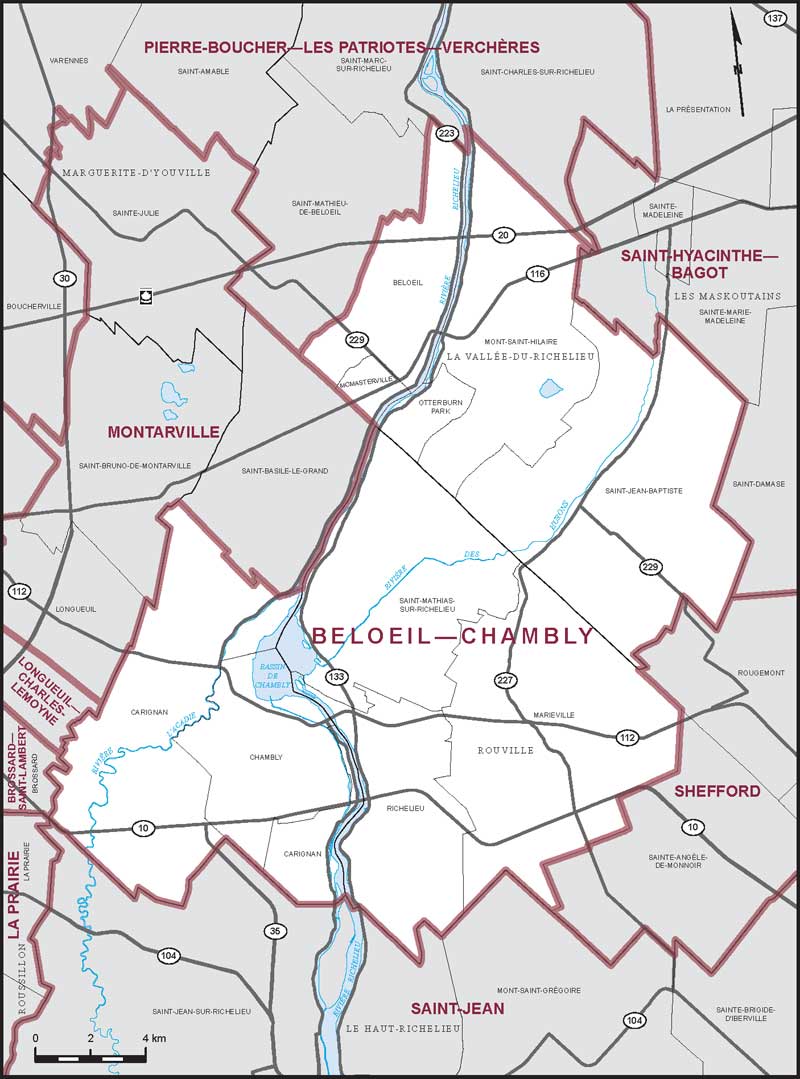
Electoral District:
Beloeil—ChamblyProvince/Territory:
Québec-
Population:
114,551 -
Area:
323 km² -
Population density:
355.00/km² -
Population change:
n/a -
Average age:
42 -
Average income:
$58,250 -
Voter turnout:
69%
Language spoken most often at home:
-
English:
3,820 -
French:
105,270 -
Indigenous language:
0 -
Most popular other language:
-
Spanish:
700
-
-
All others:
1,395
-
-
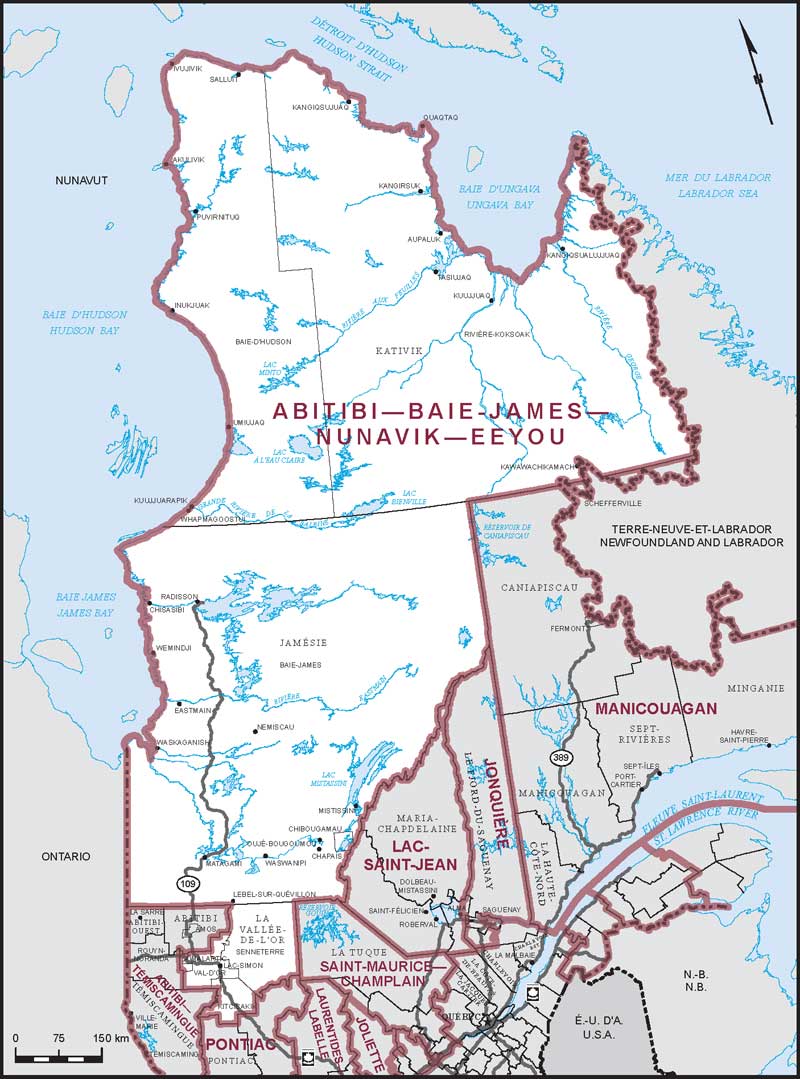
Electoral District:
Abitibi—Baie-James—Nunavik—EeyouProvince/Territory:
Québec-
Population:
89,087 -
Area:
731,401 km² -
Population density:
0.10/km² -
Population change:
n/a -
Average age:
37 -
Average income:
$53,050 -
Voter turnout:
45%
Language spoken most often at home:
-
English:
6,350 -
French:
54,405 -
Indigenous language:
23,490 -
Most popular other language:
-
Spanish:
105
-
-
All others:
315
-
-
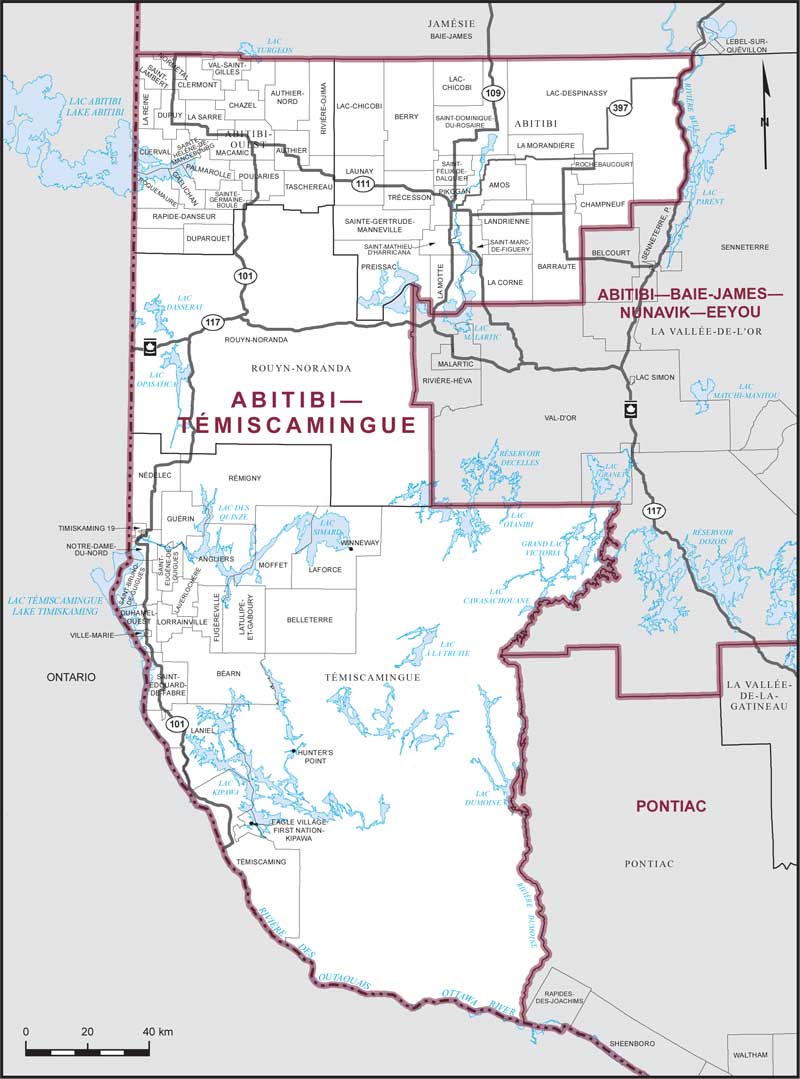
Electoral District:
Abitibi—TémiscamingueProvince/Territory:
Québec-
Population:
103,735 -
Area:
33,231 km² -
Population density:
3.00/km² -
Population change:
n/a -
Average age:
43 -
Average income:
$50,680 -
Voter turnout:
56%
Language spoken most often at home:
-
English:
3,685 -
French:
97,535 -
Indigenous language:
45 -
Most popular other language:
-
Spanish:
155
-
-
All others:
290
-
-
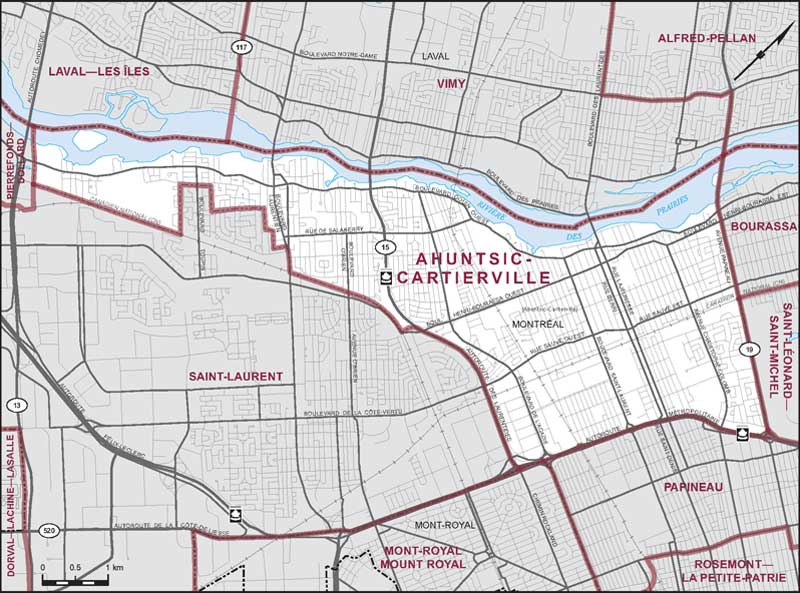
Electoral District:
Ahuntsic-CartiervilleProvince/Territory:
Québec-
Population:
111,511 -
Area:
21 km² -
Population density:
5,310.00/km² -
Population change:
n/a -
Average age:
42 -
Average income:
$50,720 -
Voter turnout:
65%
Language spoken most often at home:
-
English:
11,975 -
French:
63,110 -
Indigenous language:
0 -
Most popular other language:
-
Arabic:
6,545
-
-
All others:
16,955
-
-
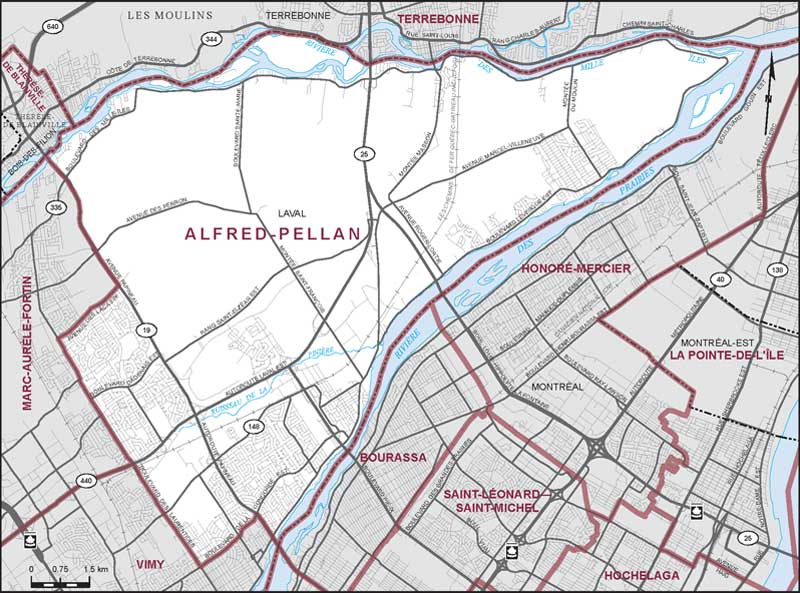
Electoral District:
Alfred-PellanProvince/Territory:
Québec-
Population:
113,173 -
Area:
116 km² -
Population density:
976.00/km² -
Population change:
n/a -
Average age:
43 -
Average income:
$53,200 -
Voter turnout:
66%
Language spoken most often at home:
-
English:
16,905 -
French:
73,535 -
Indigenous language:
0 -
Most popular other language:
-
Spanish:
3,065
-
-
All others:
10,235
-
