Federal Electoral District Fact Sheets
-
Electoral District:
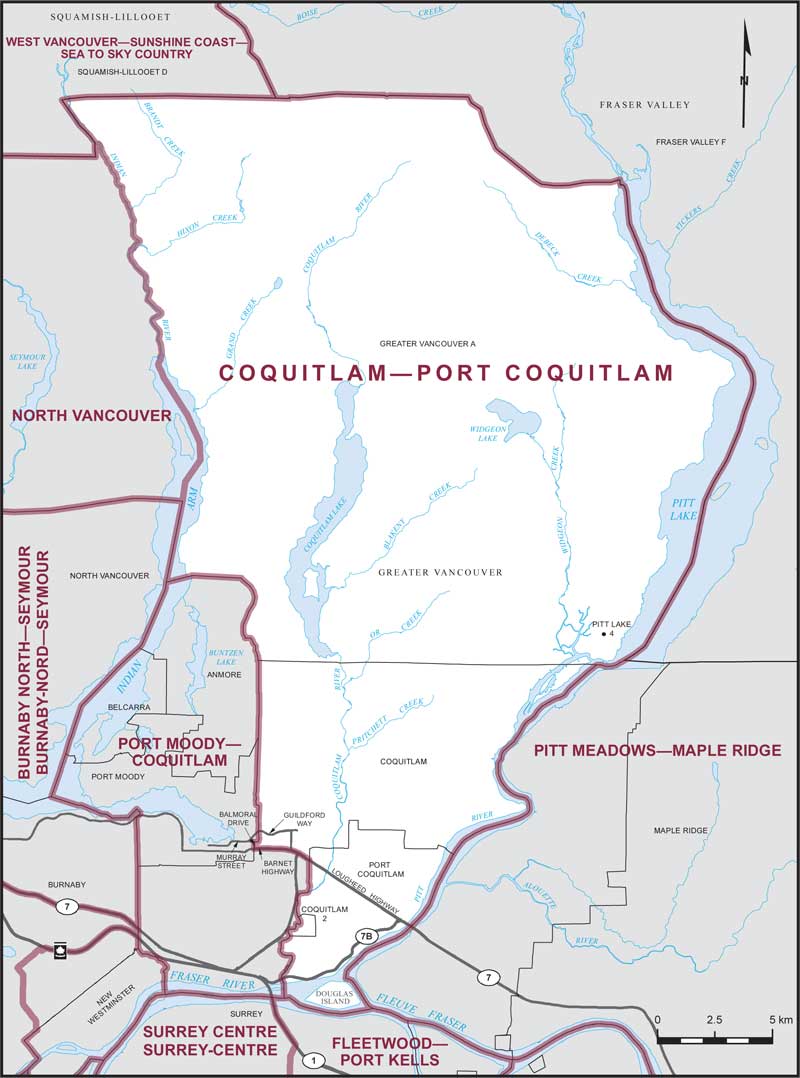
Coquitlam—Port CoquitlamProvince/Territory:
British Columbia-
Population:
114,460 -
Area:
578 km² -
Population density:
198.00/km² -
Population change:
n/a -
Average age:
41 -
Average income:
$53,100 -
Voter turnout:
69%
Language spoken most often at home:
-
English:
75,410 -
French:
370 -
Indigenous language:
0 -
Most popular other language:
-
Mandarin:
7,235
-
-
All others:
24,275
-
-
Electoral District:
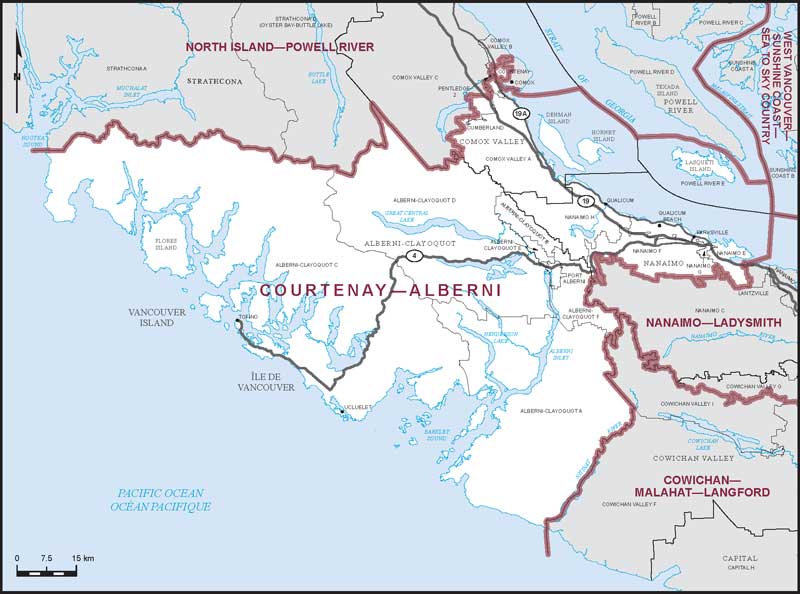
Courtenay—AlberniProvince/Territory:
British Columbia-
Population:
122,668 -
Area:
7,914 km² -
Population density:
16.00/km² -
Population change:
n/a -
Average age:
49 -
Average income:
$47,960 -
Voter turnout:
74%
Language spoken most often at home:
-
English:
117,935 -
French:
410 -
Indigenous language:
30 -
Most popular other language:
-
Mandarin:
430
-
-
All others:
2,180
-
-
Electoral District:
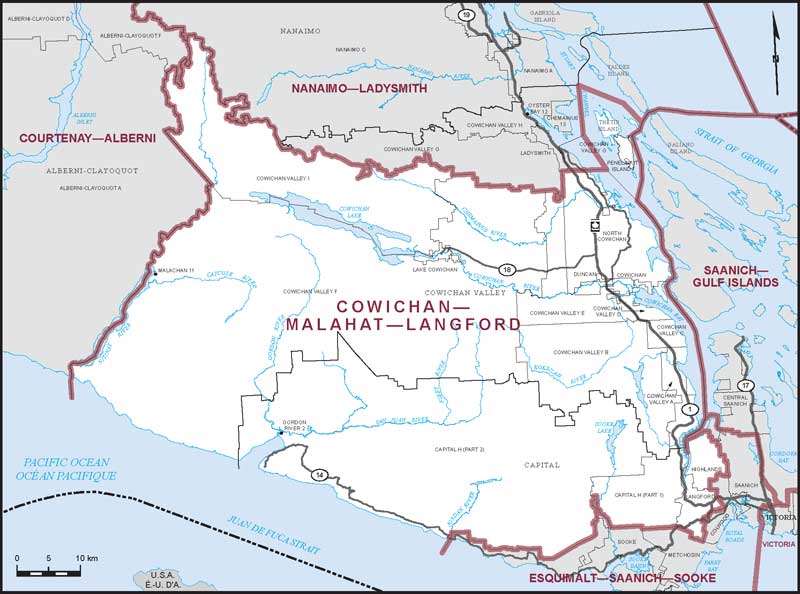
Cowichan—Malahat—LangfordProvince/Territory:
British Columbia-
Population:
124,115 -
Area:
4,549 km² -
Population density:
27.00/km² -
Population change:
n/a -
Average age:
44 -
Average income:
$51,500 -
Voter turnout:
72%
Language spoken most often at home:
-
English:
117,225 -
French:
365 -
Indigenous language:
65 -
Most popular other language:
-
Punjabi (Panjabi):
605
-
-
All others:
3,570
-
-
Electoral District:
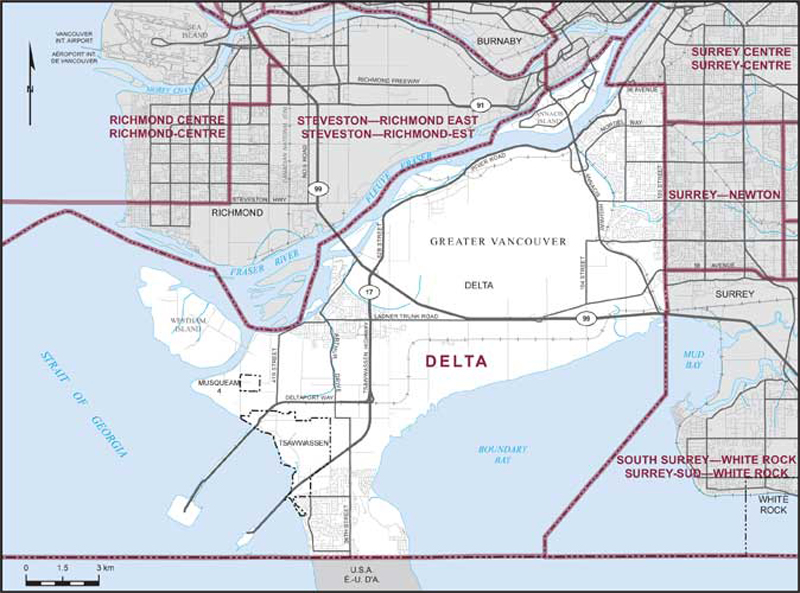
DeltaProvince/Territory:
British Columbia-
Population:
117,734 -
Area:
190 km² -
Population density:
620.00/km² -
Population change:
n/a -
Average age:
43 -
Average income:
$55,550 -
Voter turnout:
74%
Language spoken most often at home:
-
English:
84,345 -
French:
205 -
Indigenous language:
0 -
Most popular other language:
-
Punjabi (Panjabi):
13,330
-
-
All others:
12,110
-
-
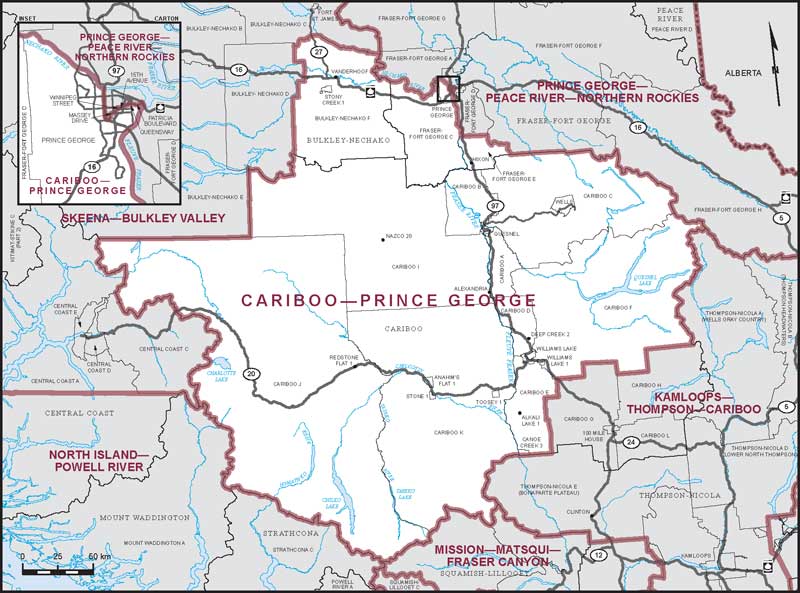
Electoral District:
Cariboo—Prince GeorgeProvince/Territory:
British Columbia-
Population:
117,160 -
Area:
89,390 km² -
Population density:
1.00/km² -
Population change:
n/a -
Average age:
43 -
Average income:
$51,120 -
Voter turnout:
68%
Language spoken most often at home:
-
English:
109,740 -
French:
150 -
Indigenous language:
260 -
Most popular other language:
-
Punjabi (Panjabi):
1,870
-
-
All others:
2,580
-
-
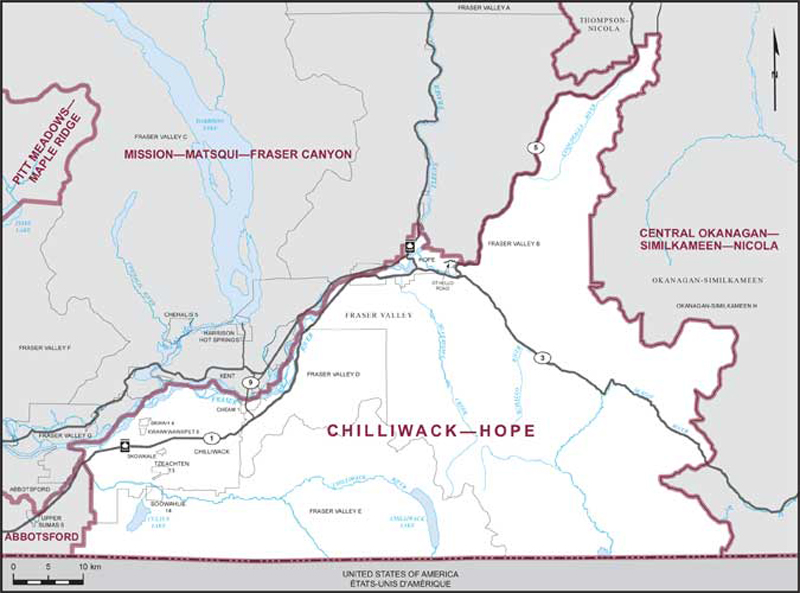
Electoral District:
Chilliwack—HopeProvince/Territory:
British Columbia-
Population:
119,082 -
Area:
6,846 km² -
Population density:
17.00/km² -
Population change:
n/a -
Average age:
43 -
Average income:
$48,560 -
Voter turnout:
68%
Language spoken most often at home:
-
English:
110,905 -
French:
255 -
Indigenous language:
0 -
Most popular other language:
-
Punjabi (Panjabi):
950
-
-
All others:
4,355
-
-
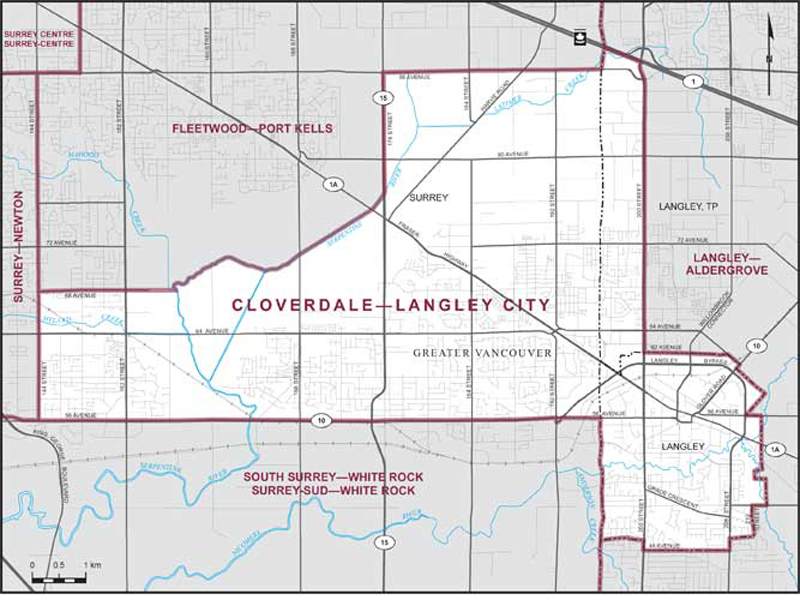
Electoral District:
Cloverdale—Langley CityProvince/Territory:
British Columbia-
Population:
117,050 -
Area:
47 km² -
Population density:
2,490.00/km² -
Population change:
n/a -
Average age:
39 -
Average income:
$53,000 -
Voter turnout:
65%
Language spoken most often at home:
-
English:
89,570 -
French:
210 -
Indigenous language:
0 -
Most popular other language:
-
Punjabi (Panjabi):
8,855
-
-
All others:
11,295
-
-
Electoral District:
Columbia—Kootenay—Southern RockiesProvince/Territory:
British Columbia-
Population:
117,132 -
Area:
40,444 km² -
Population density:
3.00/km² -
Population change:
n/a -
Average age:
45 -
Average income:
$51,550 -
Voter turnout:
73%
Language spoken most often at home:
-
English:
111,935 -
French:
645 -
Indigenous language:
10 -
Most popular other language:
-
Punjabi (Panjabi):
385
-
-
All others:
1,715
-
-
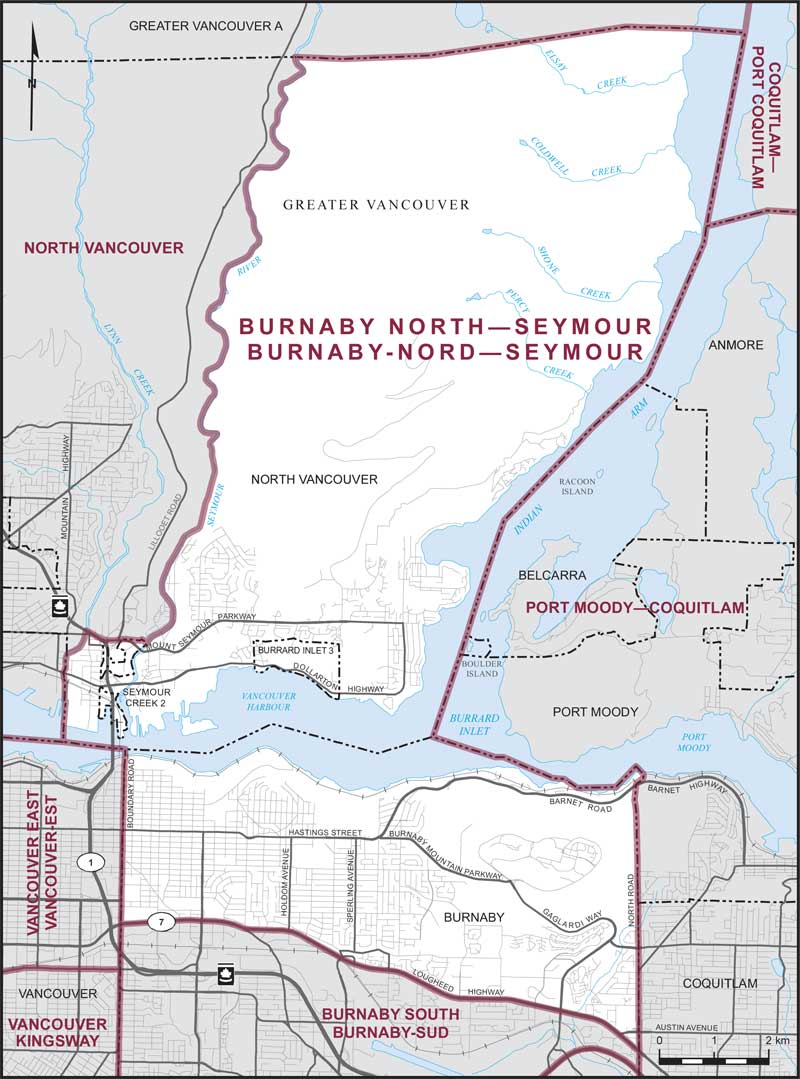
Electoral District:
Burnaby North—SeymourProvince/Territory:
British Columbia-
Population:
119,311 -
Area:
139 km² -
Population density:
858.00/km² -
Population change:
n/a -
Average age:
42 -
Average income:
$63,550 -
Voter turnout:
72%
Language spoken most often at home:
-
English:
88,115 -
French:
435 -
Indigenous language:
0 -
Most popular other language:
-
Yue (Cantonese):
6,180
-
-
All others:
18,505
-
-
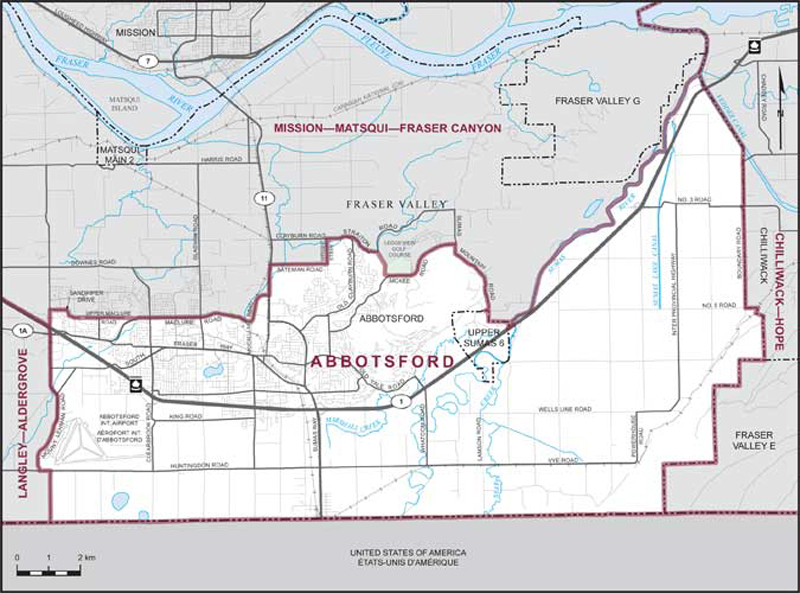
Electoral District:
Abbotsford—South LangleyProvince/Territory:
British Columbia-
Population:
116,265 -
Area:
233 km² -
Population density:
499.00/km² -
Population change:
n/a -
Average age:
42 -
Average income:
$47,920 -
Voter turnout:
67%
Language spoken most often at home:
-
English:
87,045 -
French:
195 -
Indigenous language:
0 -
Most popular other language:
-
Punjabi (Panjabi):
16,300
-
-
All others:
6,305
-
-
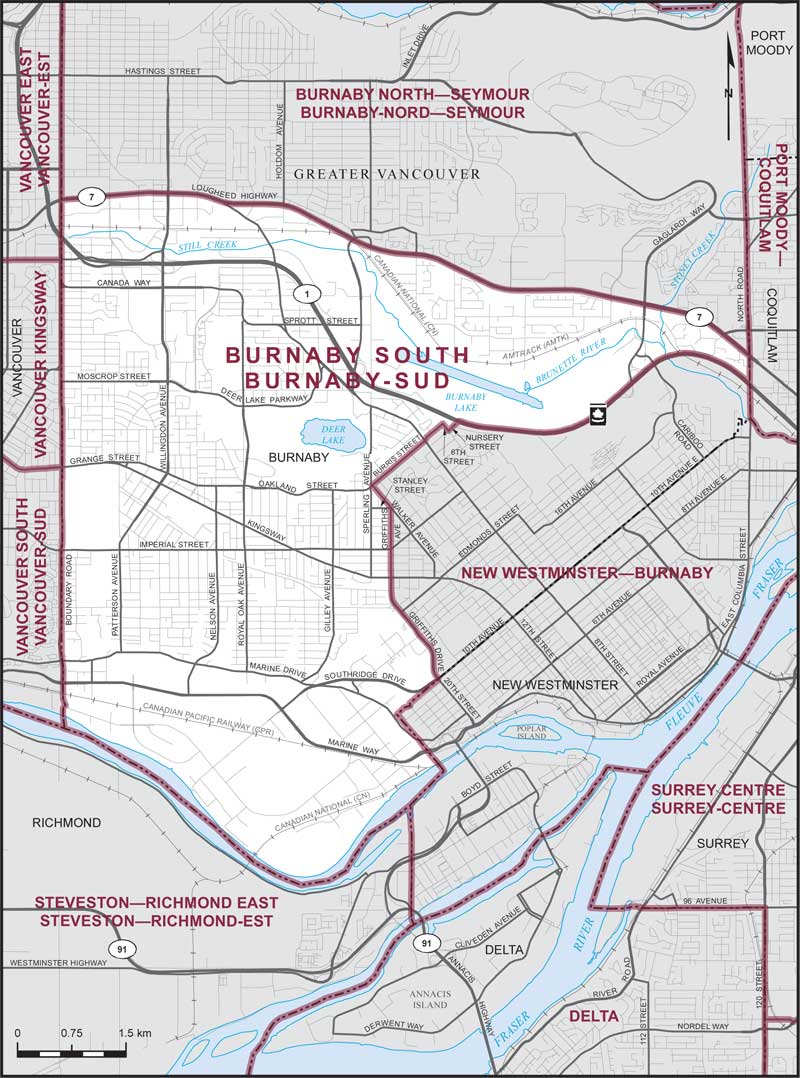
Electoral District:
Burnaby CentralProvince/Territory:
British Columbia-
Population:
120,734 -
Area:
38 km² -
Population density:
3,177.00/km² -
Population change:
n/a -
Average age:
42 -
Average income:
$49,680 -
Voter turnout:
61%
Language spoken most often at home:
-
English:
64,035 -
French:
280 -
Indigenous language:
5 -
Most popular other language:
-
Mandarin:
14,205
-
-
All others:
31,645
-