Federal Electoral District Fact Sheets
-
Electoral District:
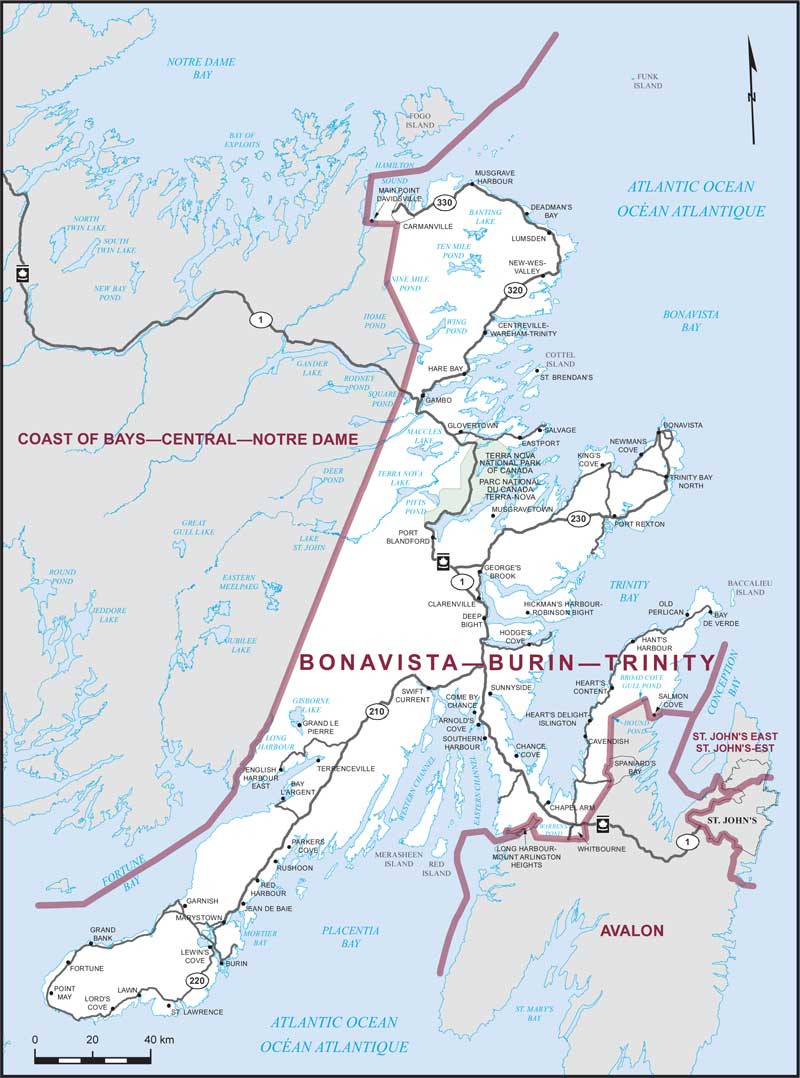
Terra Nova—The PeninsulasProvince/Territory:
Newfoundland and Labrador-
Population:
76,121 -
Area:
17,906 km² -
Population density:
4.00/km² -
Population change:
n/a -
Average age:
50 -
Average income:
$40,080 -
Voter turnout:
64%
Language spoken most often at home:
-
English:
74,980 -
French:
45 -
Indigenous language:
0 -
Most popular other language:
-
Punjabi (Panjabi):
40
-
-
All others:
150
-
-
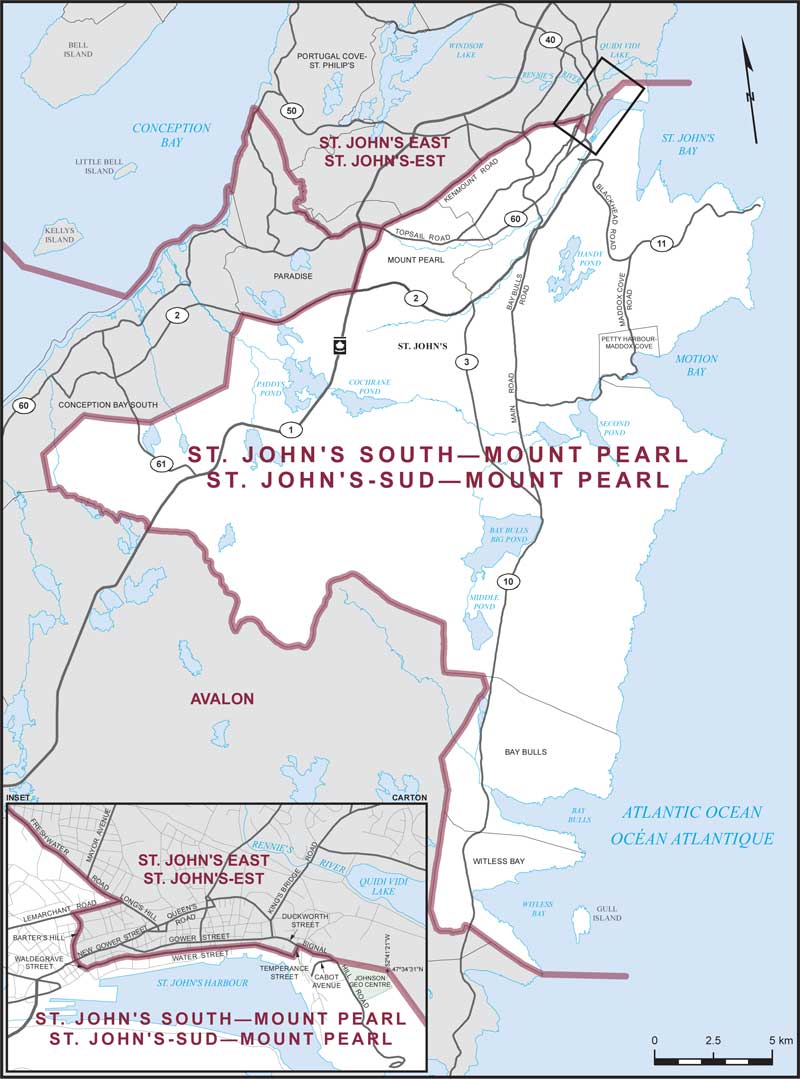
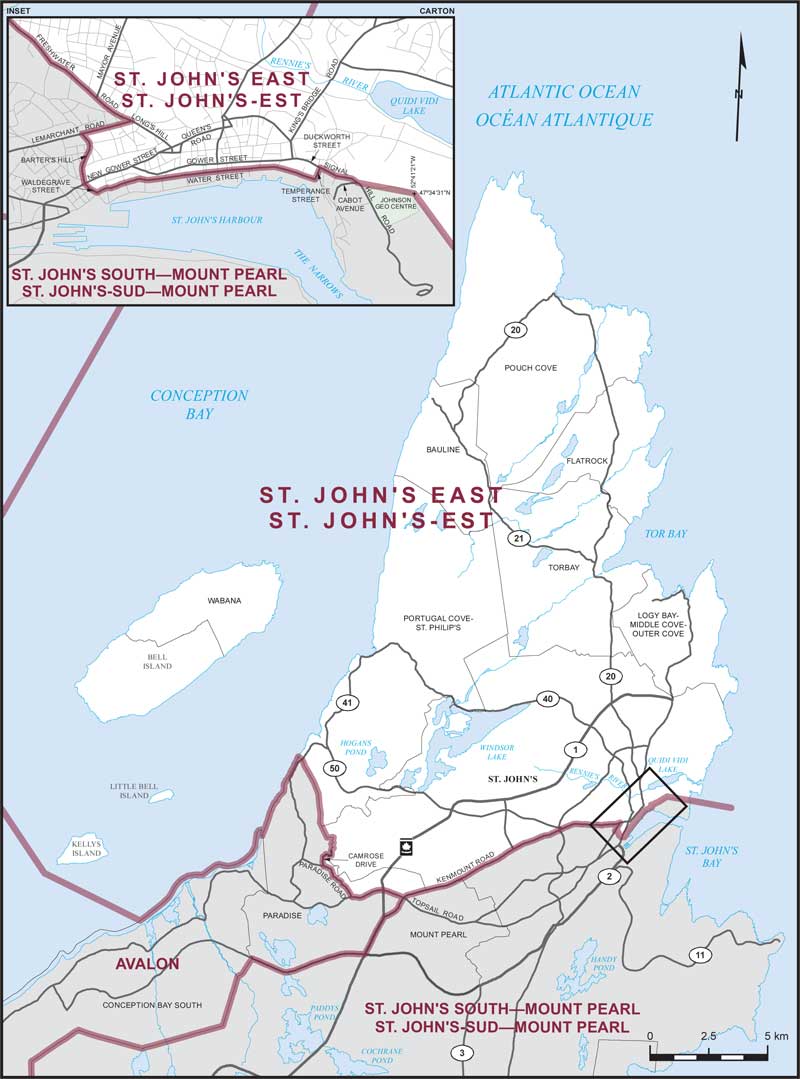
Electoral District:
St. John's EastProvince/Territory:
Newfoundland and Labrador-
Population:
85,038 -
Area:
328 km² -
Population density:
259.00/km² -
Population change:
n/a -
Average age:
42 -
Average income:
$58,700 -
Voter turnout:
70%
Language spoken most often at home:
-
English:
78,425 -
French:
300 -
Indigenous language:
5 -
Most popular other language:
-
Arabic:
625
-
-
All others:
2,600
-
-
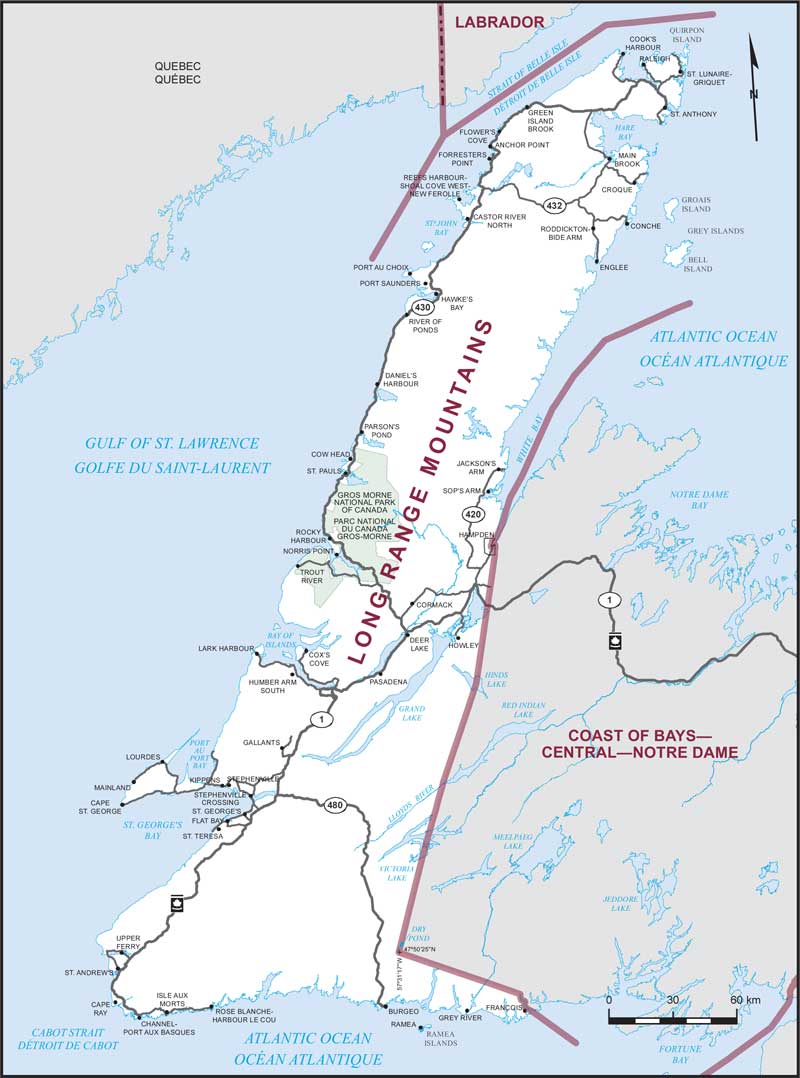
Electoral District:
Long Range MountainsProvince/Territory:
Newfoundland and Labrador-
Population:
81,795 -
Area:
37,219 km² -
Population density:
2.00/km² -
Population change:
n/a -
Average age:
49 -
Average income:
$41,600 -
Voter turnout:
65%
Language spoken most often at home:
-
English:
79,970 -
French:
115 -
Indigenous language:
5 -
Most popular other language:
-
Tagalog (Pilipino, Filipino):
60
-
-
All others:
325
-
-
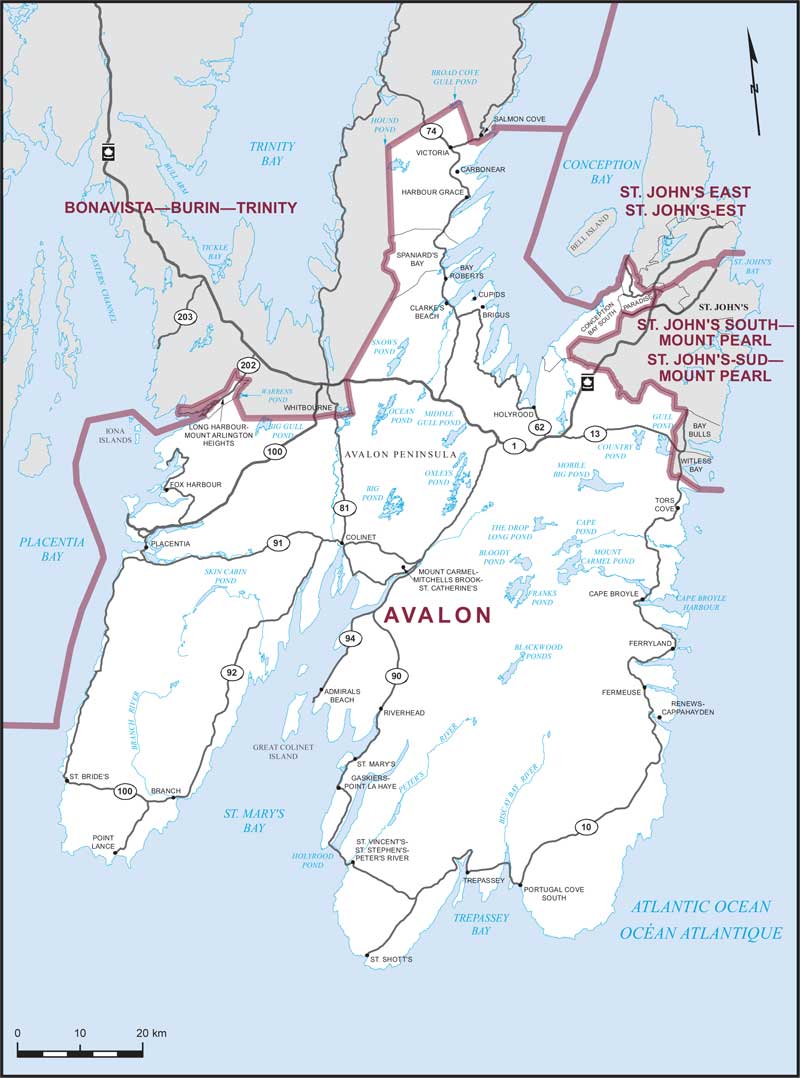
Electoral District:
AvalonProvince/Territory:
Newfoundland and Labrador-
Population:
81,781 -
Area:
5,205 km² -
Population density:
16.00/km² -
Population change:
n/a -
Average age:
45 -
Average income:
$49,560 -
Voter turnout:
67%
Language spoken most often at home:
-
English:
81,010 -
French:
65 -
Indigenous language:
0 -
Most popular other language:
-
Mandarin:
30
-
-
All others:
145
-
-
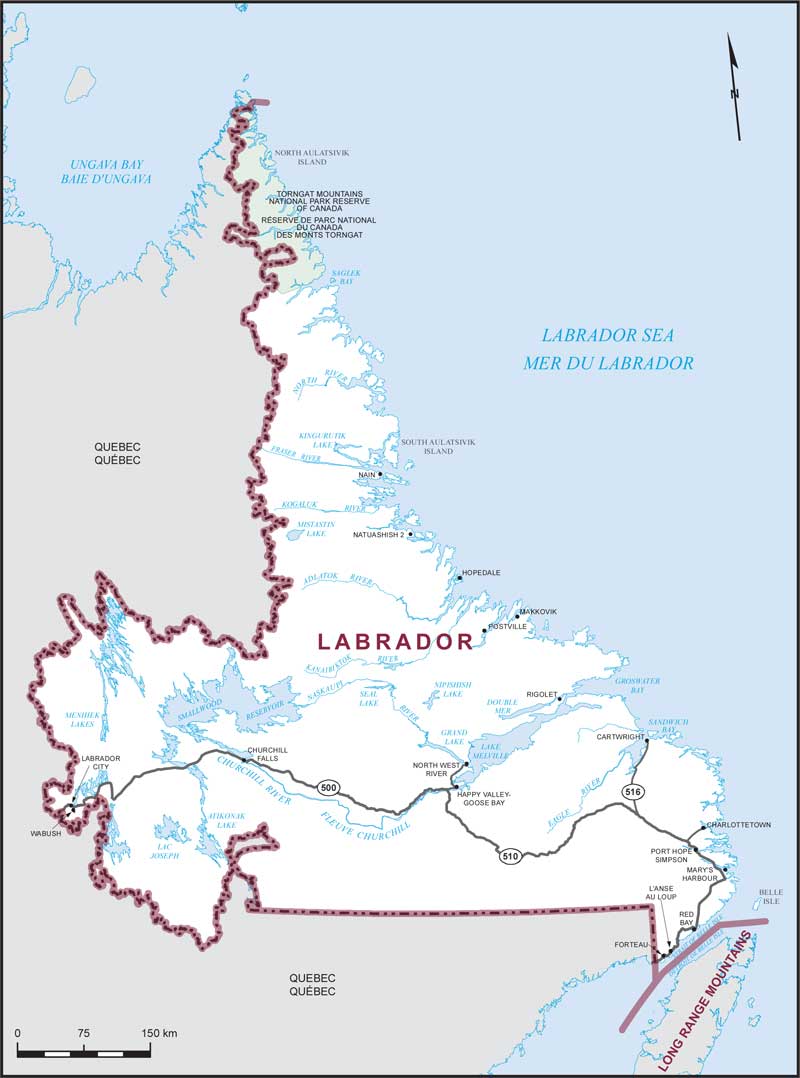
Electoral District:
LabradorProvince/Territory:
Newfoundland and Labrador-
Population:
26,655 -
Area:
258,539 km² -
Population density:
0.10/km² -
Population change:
n/a -
Average age:
38 -
Average income:
$64,000 -
Voter turnout:
57%
Language spoken most often at home:
-
English:
23,880 -
French:
195 -
Indigenous language:
1,345 -
Most popular other language:
-
Tagalog (Pilipino, Filipino):
240
-
-
All others:
215
-
-
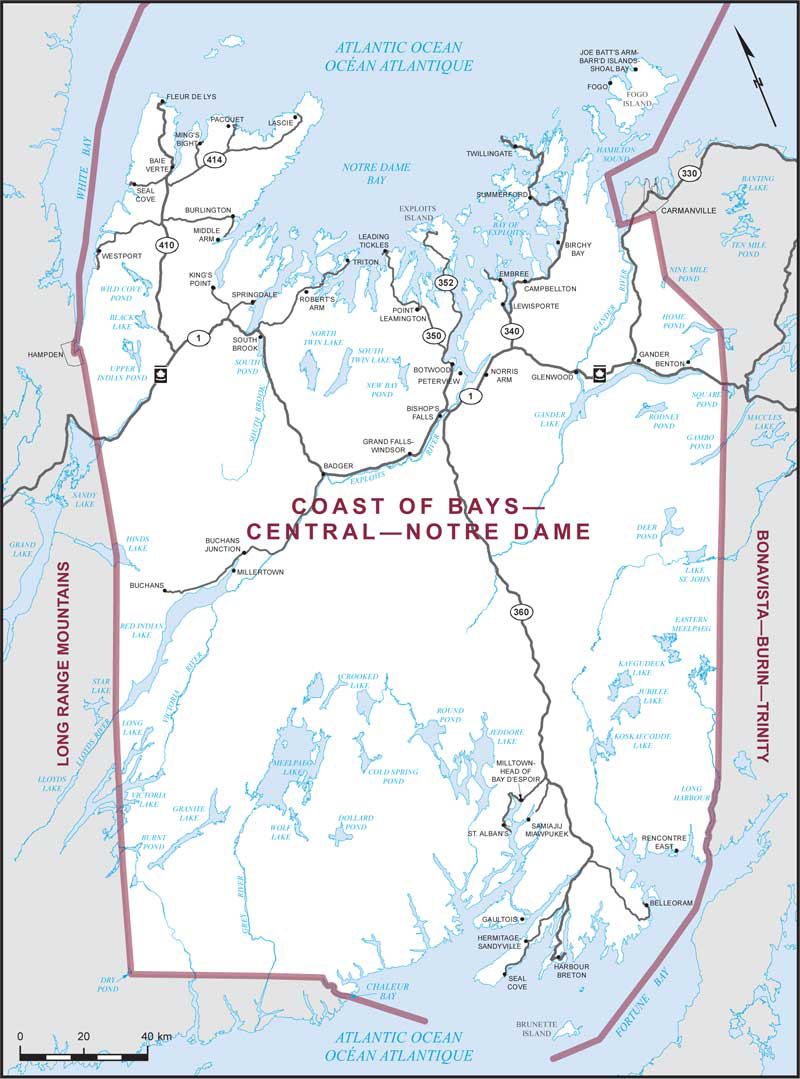
Electoral District:
Central NewfoundlandProvince/Territory:
Newfoundland and Labrador-
Population:
74,122 -
Area:
38,845 km² -
Population density:
2.00/km² -
Population change:
n/a -
Average age:
49 -
Average income:
$41,520 -
Voter turnout:
64%
Language spoken most often at home:
-
English:
72,970 -
French:
60 -
Indigenous language:
0 -
Most popular other language:
-
Punjabi (Panjabi):
60
-
-
All others:
230
-
-
Electoral District:
Cape SpearProvince/Territory:
Newfoundland and Labrador-
Population:
85,038 -
Area:
129 km² -
Population density:
659.00/km² -
Population change:
n/a -
Average age:
42 -
Average income:
$53,550 -
Voter turnout:
67%
Language spoken most often at home:
-
English:
82,900 -
French:
95 -
Indigenous language:
0 -
Most popular other language:
-
Arabic:
255
-
-
All others:
895
-