Federal Electoral District Fact Sheets
-
Electoral District:
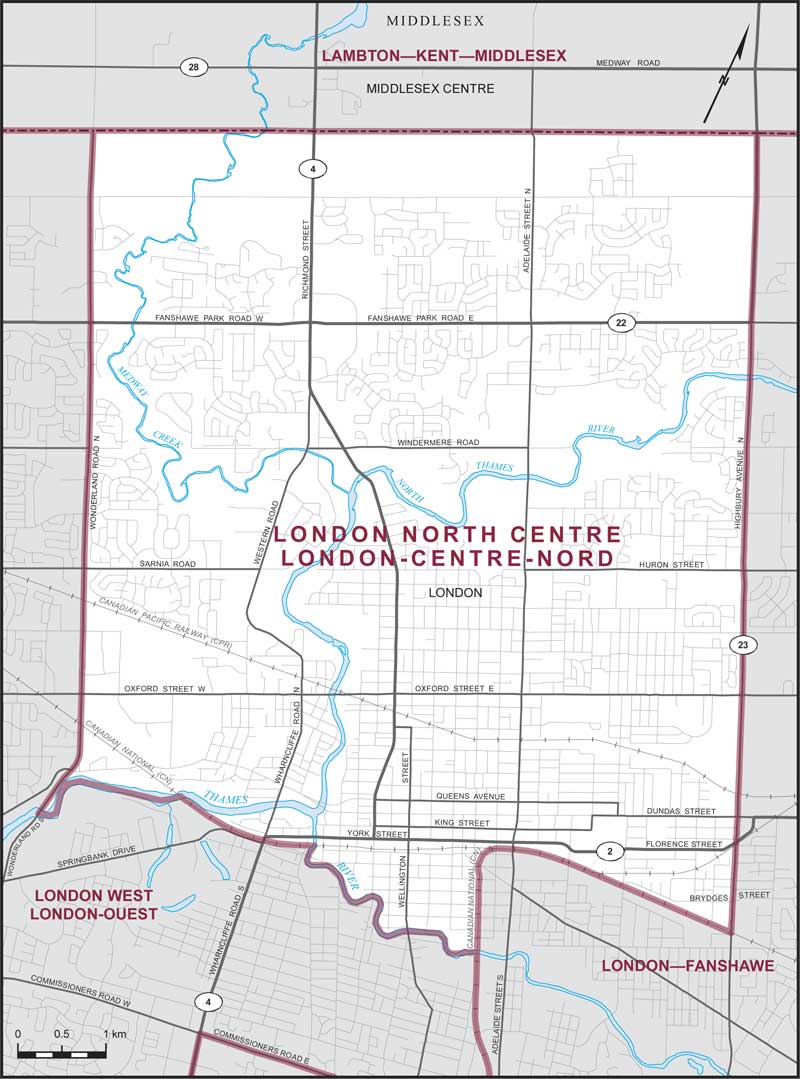
London North CentreProvince/Territory:
Ontario-
Population:
138,255 -
Area:
59 km² -
Population density:
2,349.00/km² -
Population change:
+10.3% -
Average age:
41 -
Average income:
$50,920 -
Voter turnout:
60%
Language spoken most often at home:
-
English:
109,305 -
French:
430 -
Indigenous language:
5 -
Most popular other language:
-
Mandarin:
2,925
-
-
All others:
17,685
-
-
Electoral District:
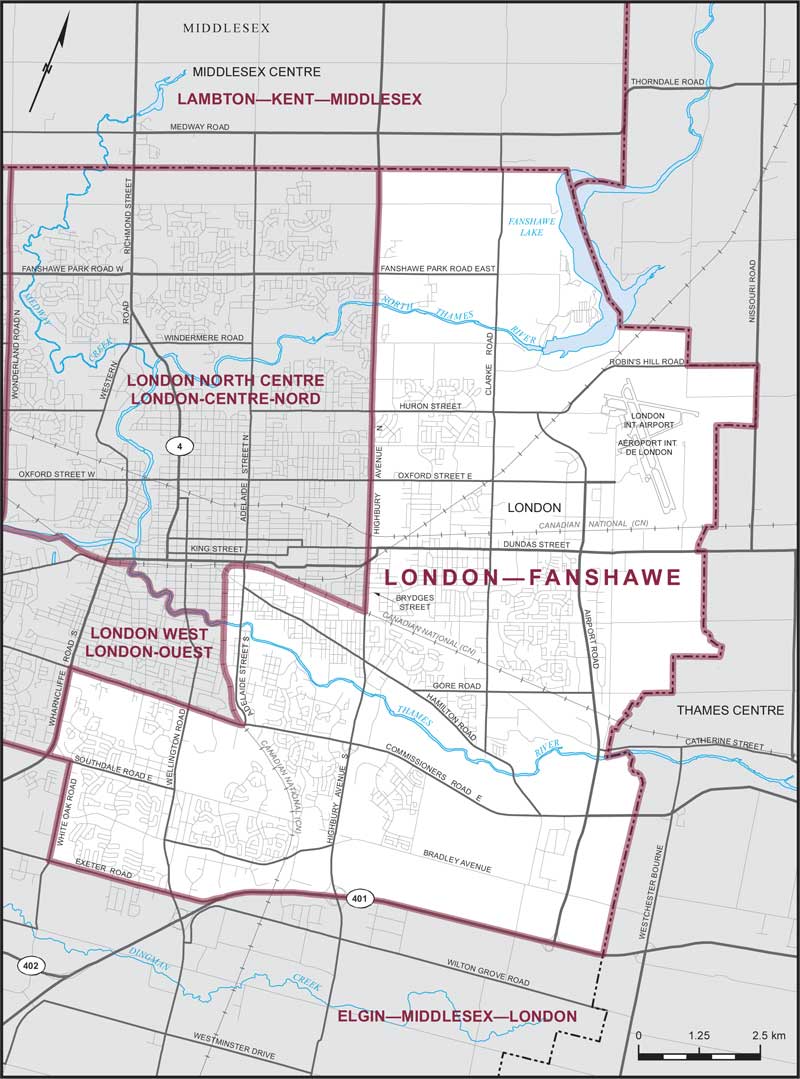
London—FanshaweProvince/Territory:
Ontario-
Population:
127,068 -
Area:
115 km² -
Population density:
1,106.00/km² -
Population change:
+6.4% -
Average age:
40 -
Average income:
$43,120 -
Voter turnout:
56%
Language spoken most often at home:
-
English:
103,530 -
French:
520 -
Indigenous language:
20 -
Most popular other language:
-
Arabic:
3,515
-
-
All others:
12,965
-
-
Electoral District:
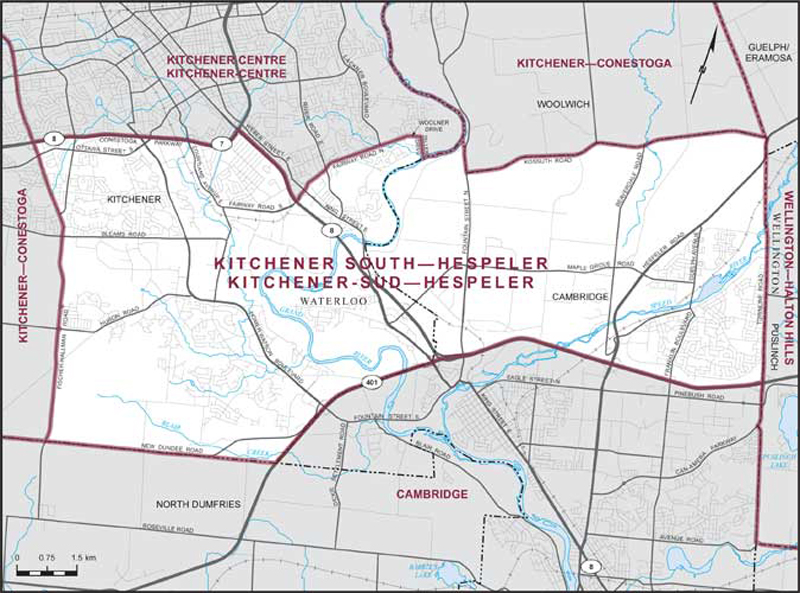
Kitchener South—HespelerProvince/Territory:
Ontario-
Population:
119,851 -
Area:
104 km² -
Population density:
1,150.00/km² -
Population change:
+13.8% -
Average age:
38 -
Average income:
$53,600 -
Voter turnout:
62%
Language spoken most often at home:
-
English:
91,470 -
French:
365 -
Indigenous language:
0 -
Most popular other language:
-
Punjabi (Panjabi):
3,075
-
-
All others:
17,495
-
-
Electoral District:
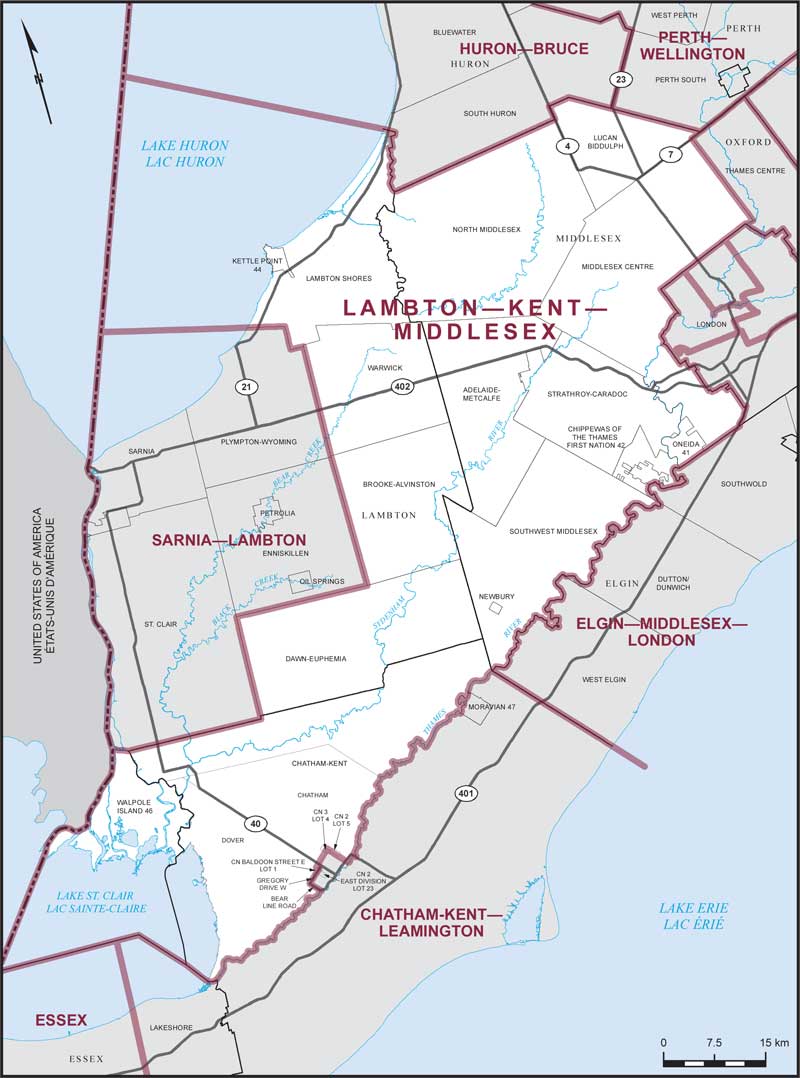
Lambton—Kent—MiddlesexProvince/Territory:
Ontario-
Population:
111,242 -
Area:
4,919 km² -
Population density:
23.00/km² -
Population change:
+5.6% -
Average age:
43 -
Average income:
$52,400 -
Voter turnout:
67%
Language spoken most often at home:
-
English:
106,445 -
French:
200 -
Indigenous language:
25 -
Most popular other language:
-
Portuguese:
530
-
-
All others:
2,145
-
-
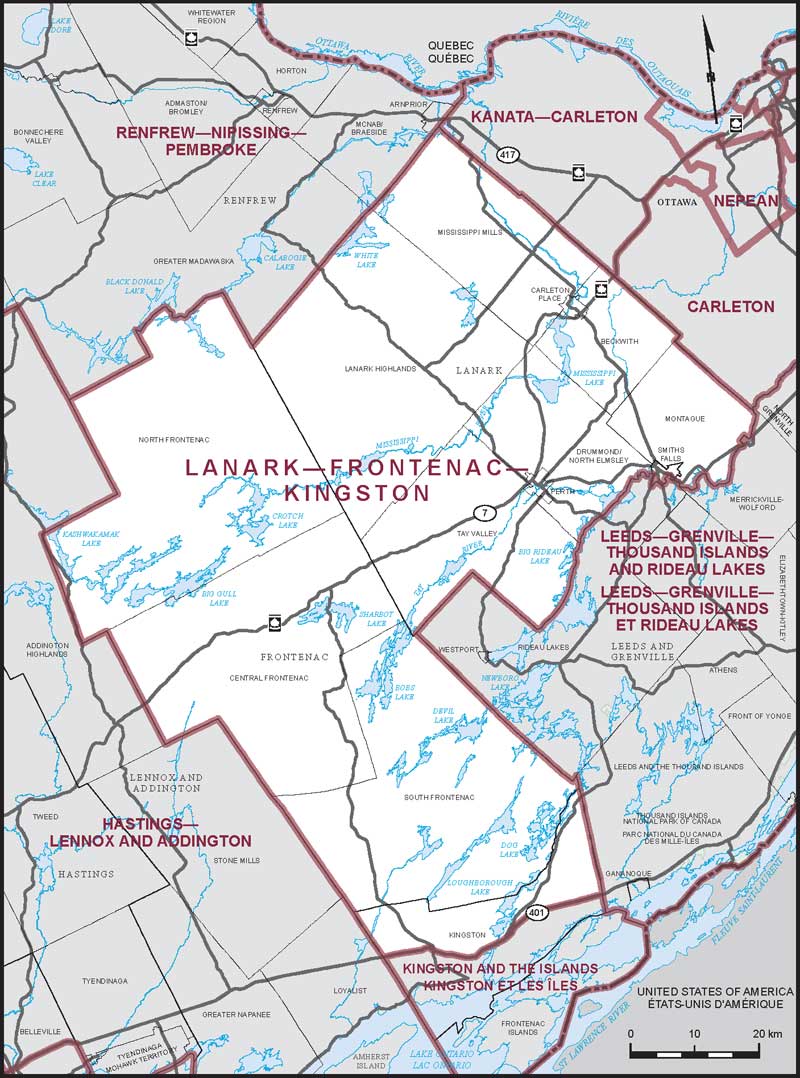
Electoral District:
Lanark—Frontenac—KingstonProvince/Territory:
Ontario-
Population:
111,424 -
Area:
6,354 km² -
Population density:
18.00/km² -
Population change:
+9.6% -
Average age:
46 -
Average income:
$54,150 -
Voter turnout:
70%
Language spoken most often at home:
-
English:
107,285 -
French:
970 -
Indigenous language:
10 -
Most popular other language:
-
Portuguese:
80
-
-
All others:
845
-
-
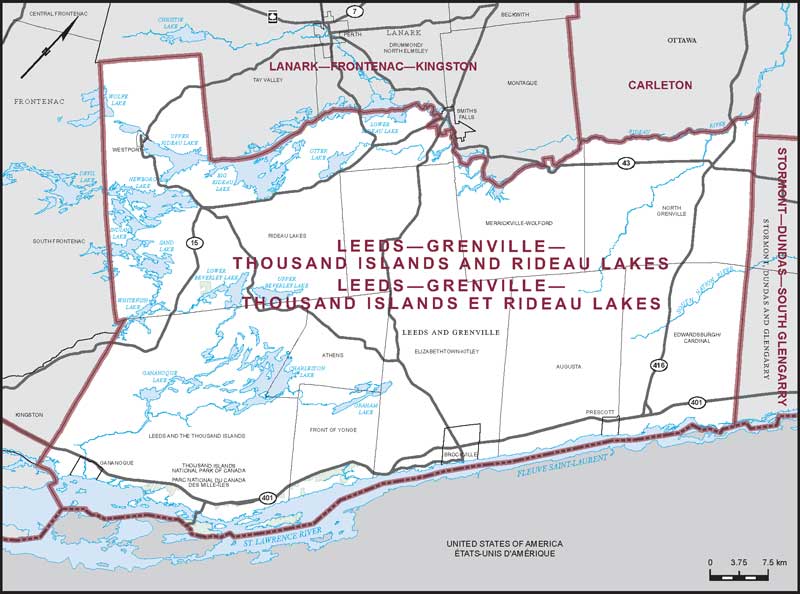
Electoral District:
Leeds—Grenville—Thousand Islands and Rideau LakesProvince/Territory:
Ontario-
Population:
104,070 -
Area:
3,356 km² -
Population density:
31.00/km² -
Population change:
+3.5% -
Average age:
47 -
Average income:
$51,040 -
Voter turnout:
68%
Language spoken most often at home:
-
English:
100,200 -
French:
905 -
Indigenous language:
5 -
Most popular other language:
-
Punjabi (Panjabi):
105
-
-
All others:
1,005
-
-
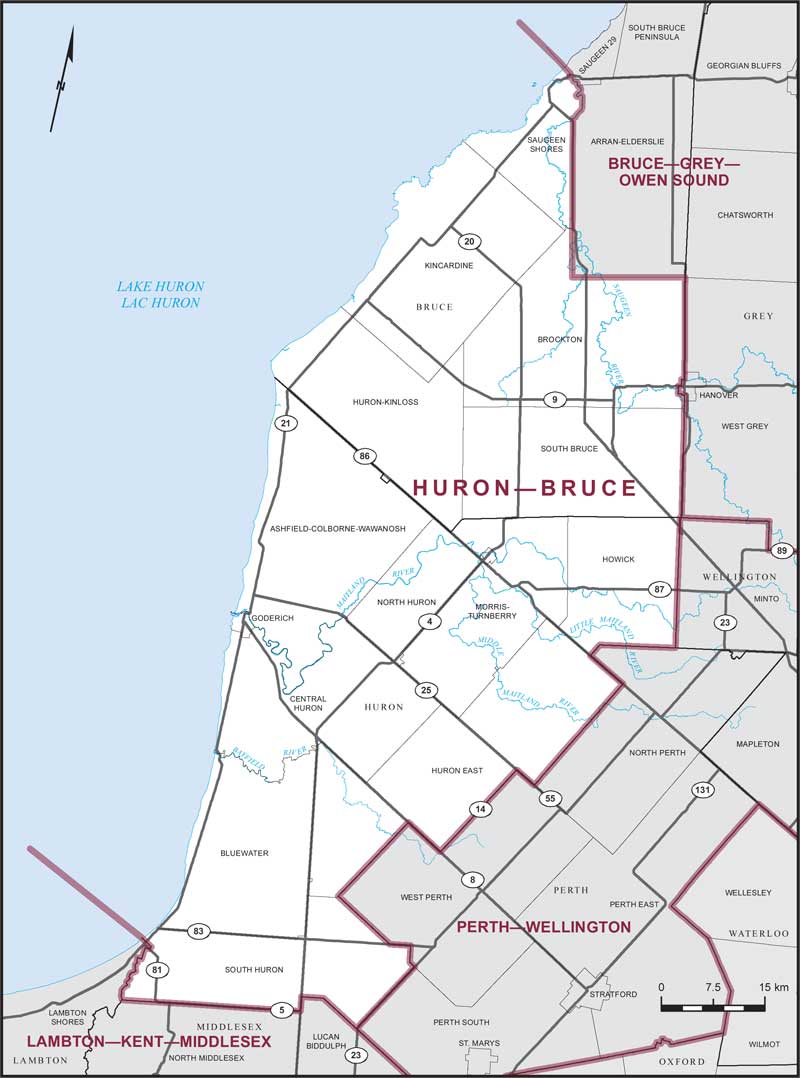
Electoral District:
Huron—BruceProvince/Territory:
Ontario-
Population:
112,929 -
Area:
5,599 km² -
Population density:
20.00/km² -
Population change:
+6% -
Average age:
44 -
Average income:
$55,700 -
Voter turnout:
70%
Language spoken most often at home:
-
English:
105,970 -
French:
125 -
Indigenous language:
5 -
Most popular other language:
-
German & Pennsylvania German:
2,810
-
-
All others:
2,070
-
-
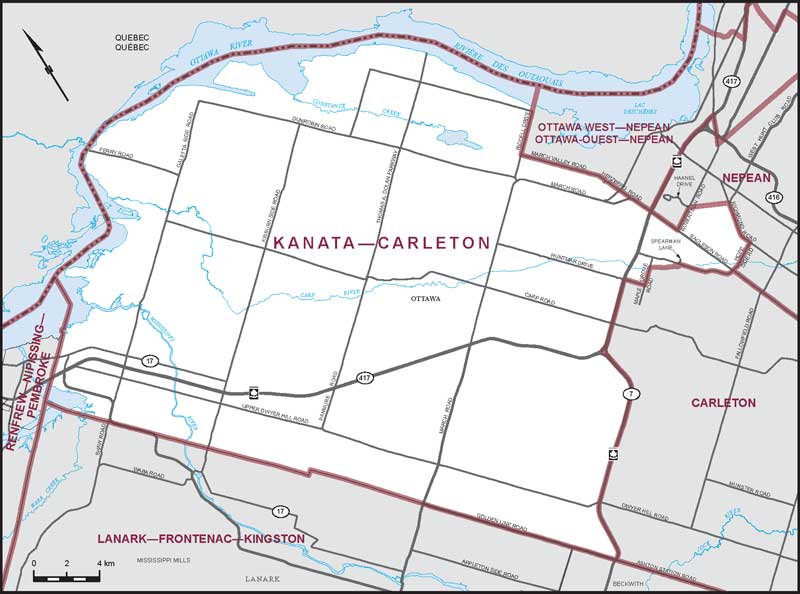
Electoral District:
Kanata—CarletonProvince/Territory:
Ontario-
Population:
116,651 -
Area:
761 km² -
Population density:
153.00/km² -
Population change:
+5.1% -
Average age:
41 -
Average income:
$69,100 -
Voter turnout:
73%
Language spoken most often at home:
-
English:
91,125 -
French:
3,120 -
Indigenous language:
0 -
Most popular other language:
-
Mandarin:
4,075
-
-
All others:
11,530
-
-
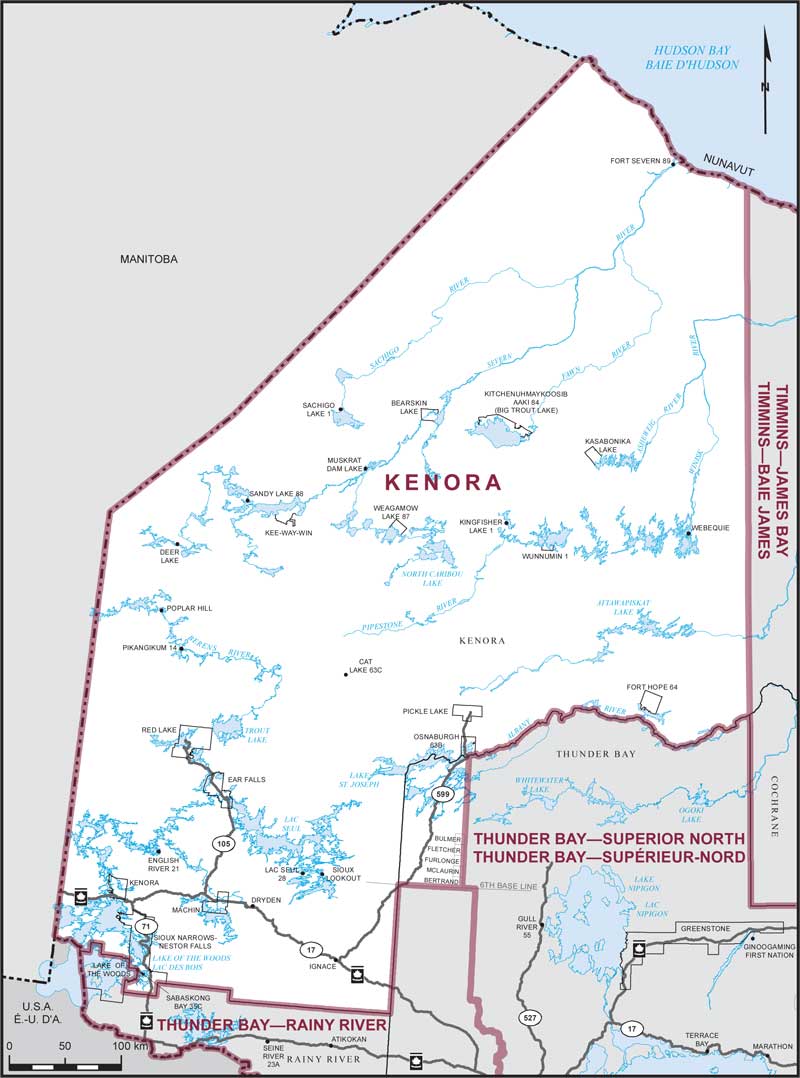
Electoral District:
KenoraProvince/Territory:
Ontario-
Population:
64,261 -
Area:
285,752 km² -
Population density:
0.20/km² -
Population change:
+2.7% -
Average age:
39 -
Average income:
$49,680 -
Voter turnout:
57%
Language spoken most often at home:
-
English:
58,455 -
French:
225 -
Indigenous language:
3,180 -
Most popular other language:
-
Tagalog (Pilipino, Filipino):
90
-
-
All others:
330
-
-
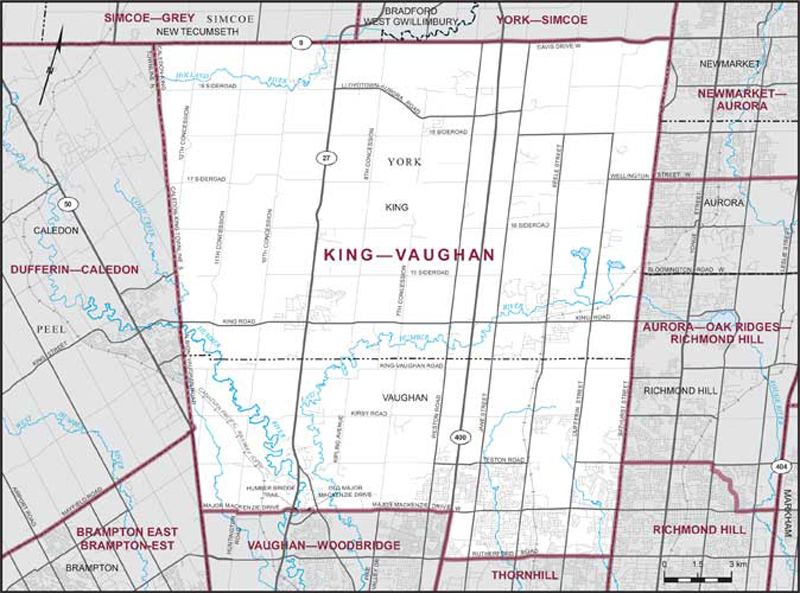
Electoral District:
King—VaughanProvince/Territory:
Ontario-
Population:
147,695 -
Area:
425 km² -
Population density:
348.00/km² -
Population change:
+11.9% -
Average age:
38 -
Average income:
$66,600 -
Voter turnout:
49%
Language spoken most often at home:
-
English:
100,340 -
French:
295 -
Indigenous language:
0 -
Most popular other language:
-
Mandarin & Yue (Cantonese):
7,285
-
-
All others:
28,520
-
-
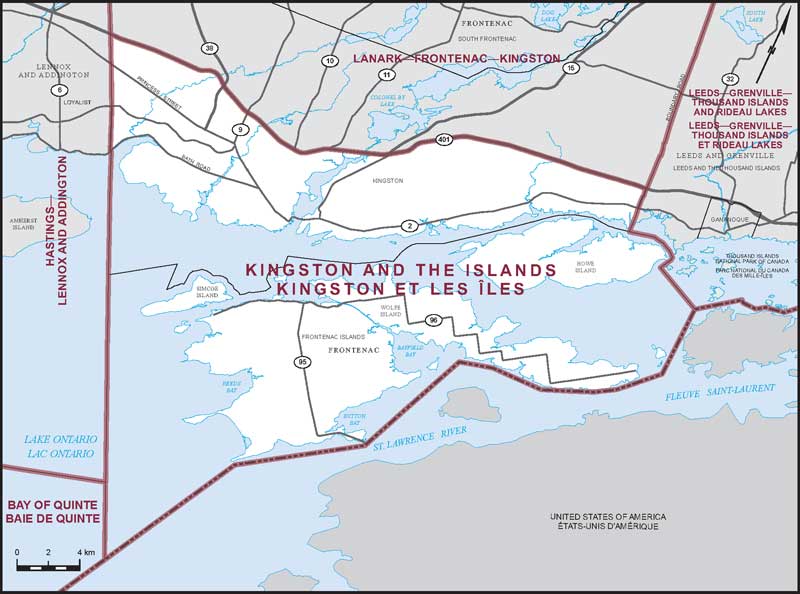
Electoral District:
Kingston and the IslandsProvince/Territory:
Ontario-
Population:
126,106 -
Area:
358 km² -
Population density:
352.00/km² -
Population change:
+7.3% -
Average age:
43 -
Average income:
$54,100 -
Voter turnout:
67%
Language spoken most often at home:
-
English:
112,730 -
French:
1,760 -
Indigenous language:
10 -
Most popular other language:
-
Mandarin & Yue (Cantonese):
3,830
-
-
All others:
3,240
-
-
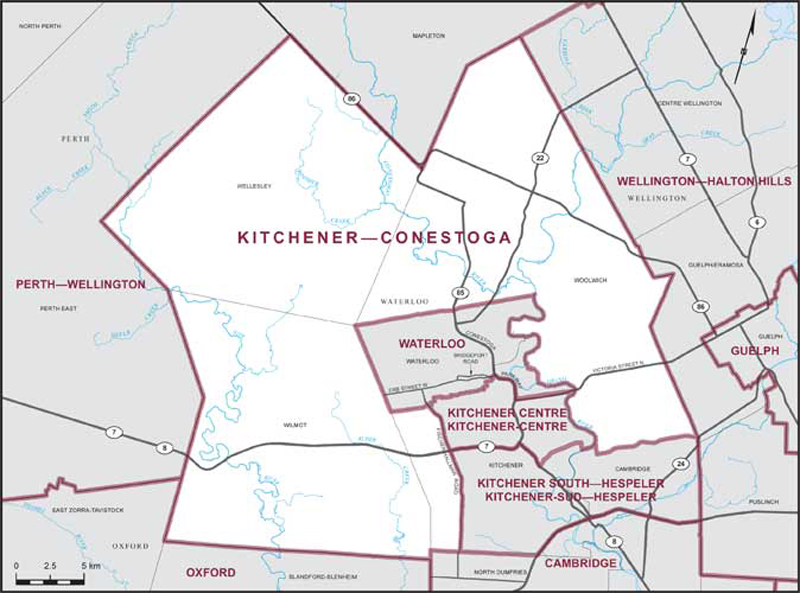
Electoral District:
Kitchener—ConestogaProvince/Territory:
Ontario-
Population:
107,134 -
Area:
896 km² -
Population density:
120.00/km² -
Population change:
+6.4% -
Average age:
39 -
Average income:
$57,650 -
Voter turnout:
68%
Language spoken most often at home:
-
English:
85,670 -
French:
220 -
Indigenous language:
0 -
Most popular other language:
-
German & Pennsylvania German:
4,340
-
-
All others:
12,340
-
-
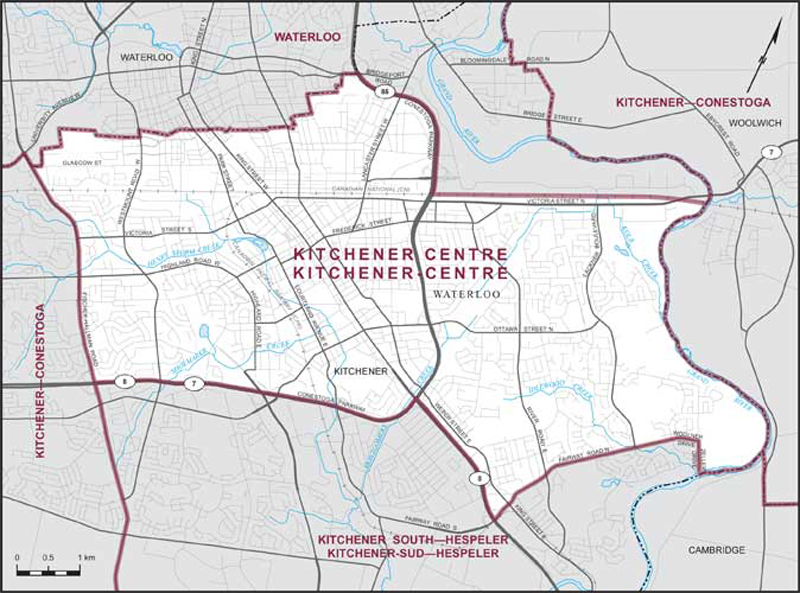
Electoral District:
Kitchener CentreProvince/Territory:
Ontario-
Population:
113,452 -
Area:
41 km² -
Population density:
2,737.00/km² -
Population change:
+7.8% -
Average age:
41 -
Average income:
$50,440 -
Voter turnout:
63%
Language spoken most often at home:
-
English:
91,265 -
French:
365 -
Indigenous language:
5 -
Most popular other language:
-
Arabic:
1,550
-
-
All others:
14,925
-
-
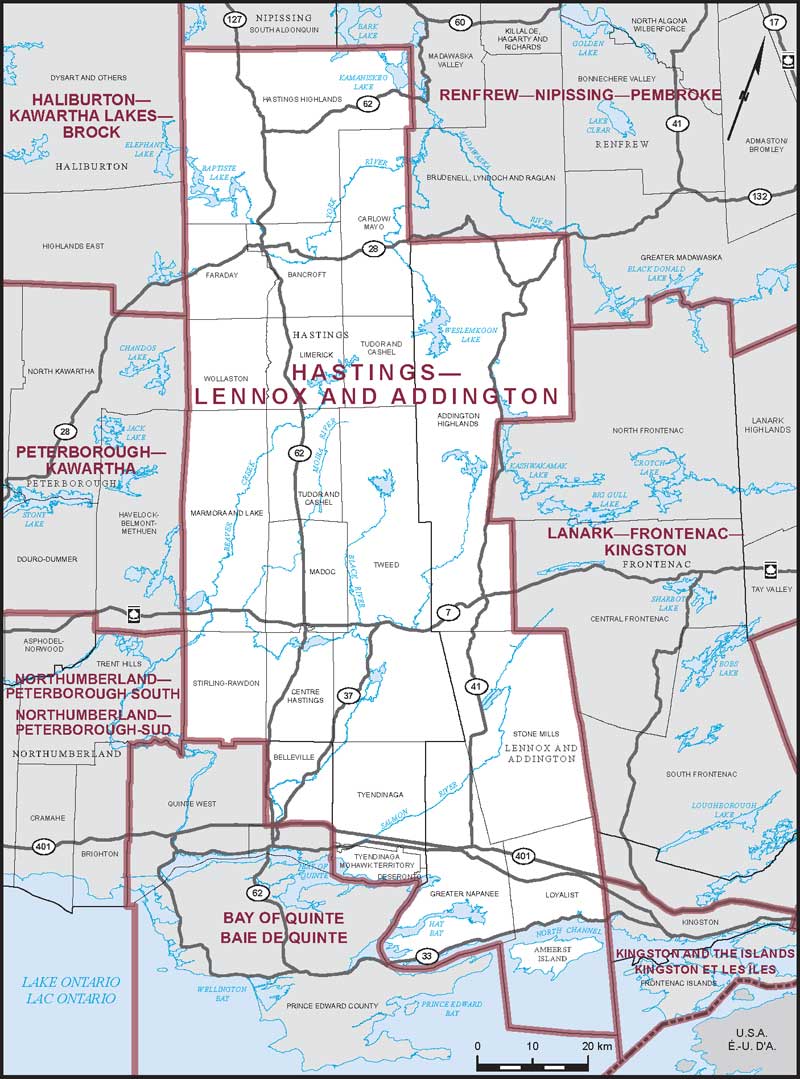
Electoral District:
Hastings—Lennox and AddingtonProvince/Territory:
Ontario-
Population:
100,636 -
Area:
8,234 km² -
Population density:
12.00/km² -
Population change:
+6.7% -
Average age:
46 -
Average income:
$47,720 -
Voter turnout:
66%
Language spoken most often at home:
-
English:
95,855 -
French:
485 -
Indigenous language:
10 -
Most popular other language:
-
German:
215
-
-
All others:
1,070
-
-
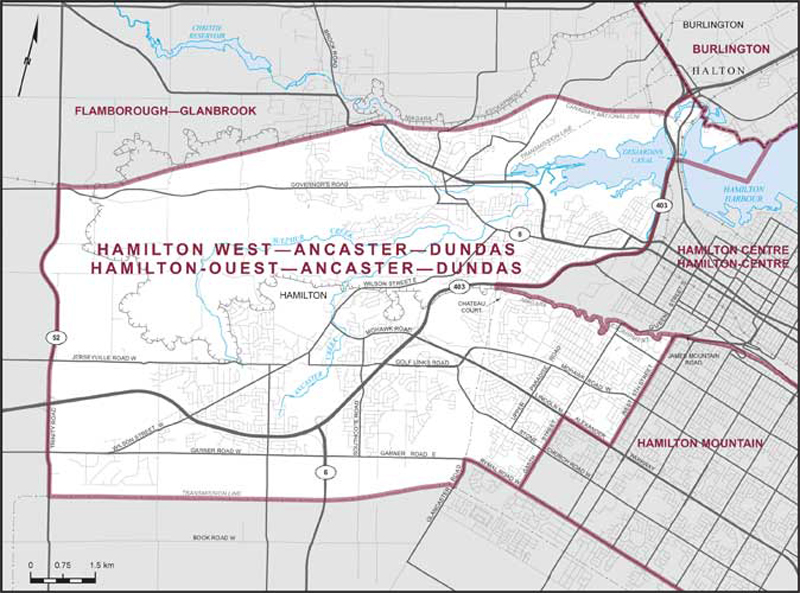
Electoral District:
Hamilton West—Ancaster—DundasProvince/Territory:
Ontario-
Population:
117,565 -
Area:
101 km² -
Population density:
1,164.00/km² -
Population change:
+4% -
Average age:
43 -
Average income:
$69,000 -
Voter turnout:
69%
Language spoken most often at home:
-
English:
97,395 -
French:
365 -
Indigenous language:
0 -
Most popular other language:
-
Mandarin:
2,130
-
-
All others:
11,815
-
-
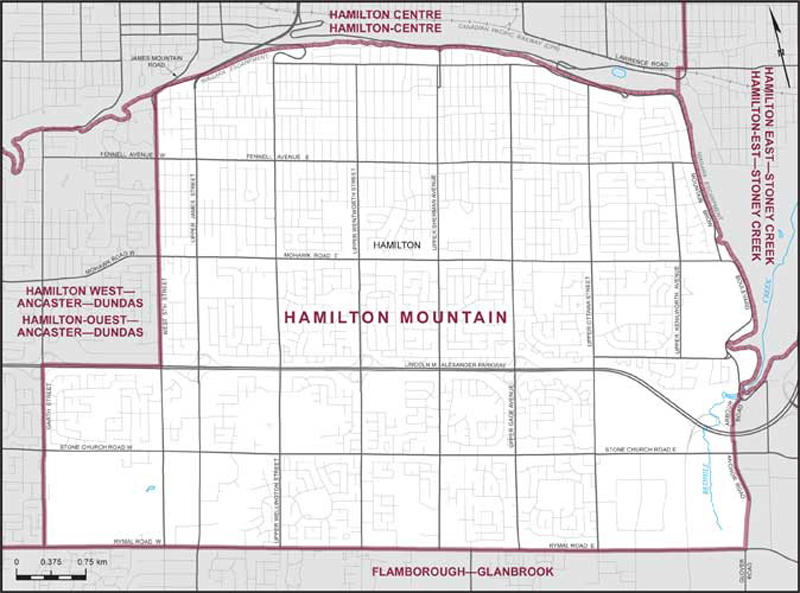
Electoral District:
Hamilton MountainProvince/Territory:
Ontario-
Population:
107,629 -
Area:
33 km² -
Population density:
3,248.00/km² -
Population change:
+2.6% -
Average age:
42 -
Average income:
$46,360 -
Voter turnout:
60%
Language spoken most often at home:
-
English:
86,405 -
French:
375 -
Indigenous language:
0 -
Most popular other language:
-
Arabic:
2,110
-
-
All others:
12,805
-