Federal Electoral District Fact Sheets
-
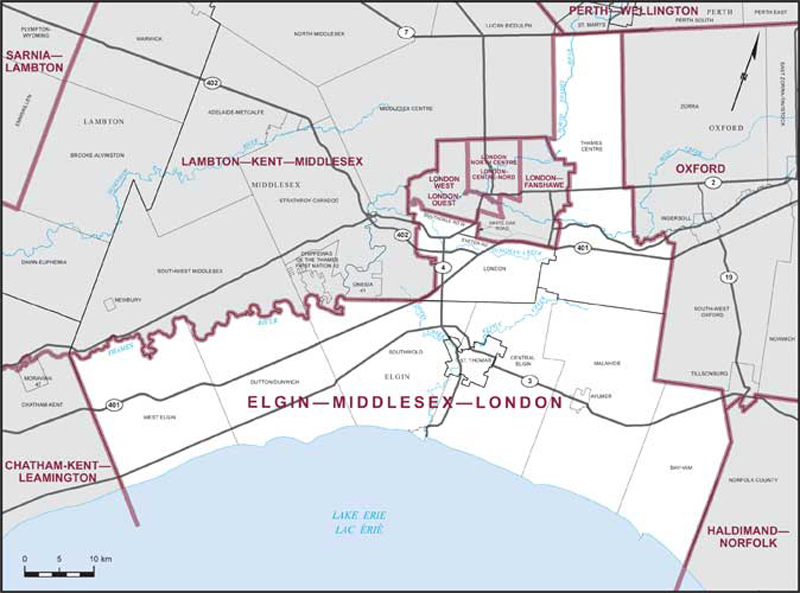
Electoral District:
Elgin—Middlesex—LondonProvince/Territory:
Ontario-
Population:
126,428 -
Area:
2,482 km² -
Population density:
51.00/km² -
Population change:
+9.9% -
Average age:
42 -
Average income:
$51,250 -
Voter turnout:
65%
Language spoken most often at home:
-
English:
115,580 -
French:
250 -
Indigenous language:
0 -
Most popular other language:
-
German:
1,705
-
-
All others:
5,400
-
-
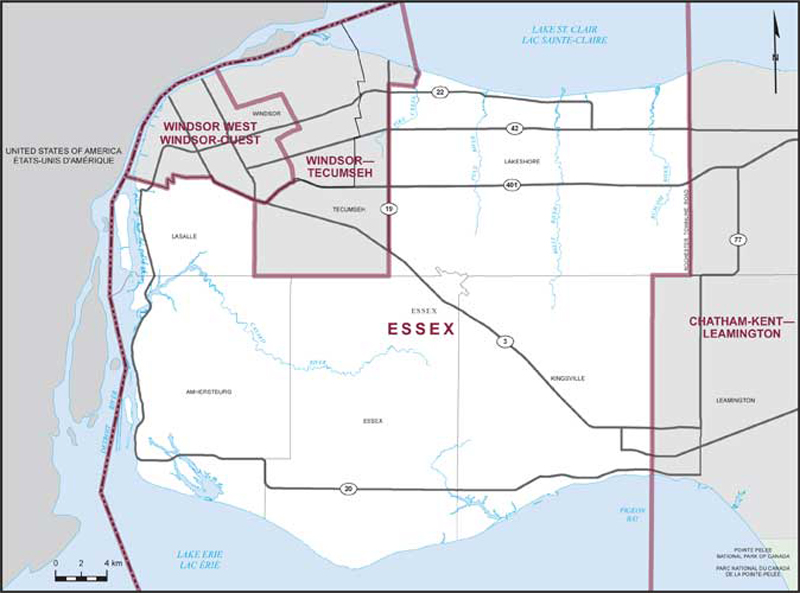
Electoral District:
EssexProvince/Territory:
Ontario-
Population:
134,656 -
Area:
1,097 km² -
Population density:
123.00/km² -
Population change:
+7.3% -
Average age:
42 -
Average income:
$59,700 -
Voter turnout:
67%
Language spoken most often at home:
-
English:
123,760 -
French:
665 -
Indigenous language:
0 -
Most popular other language:
-
Punjabi (Panjabi):
1,005
-
-
All others:
6,020
-
-
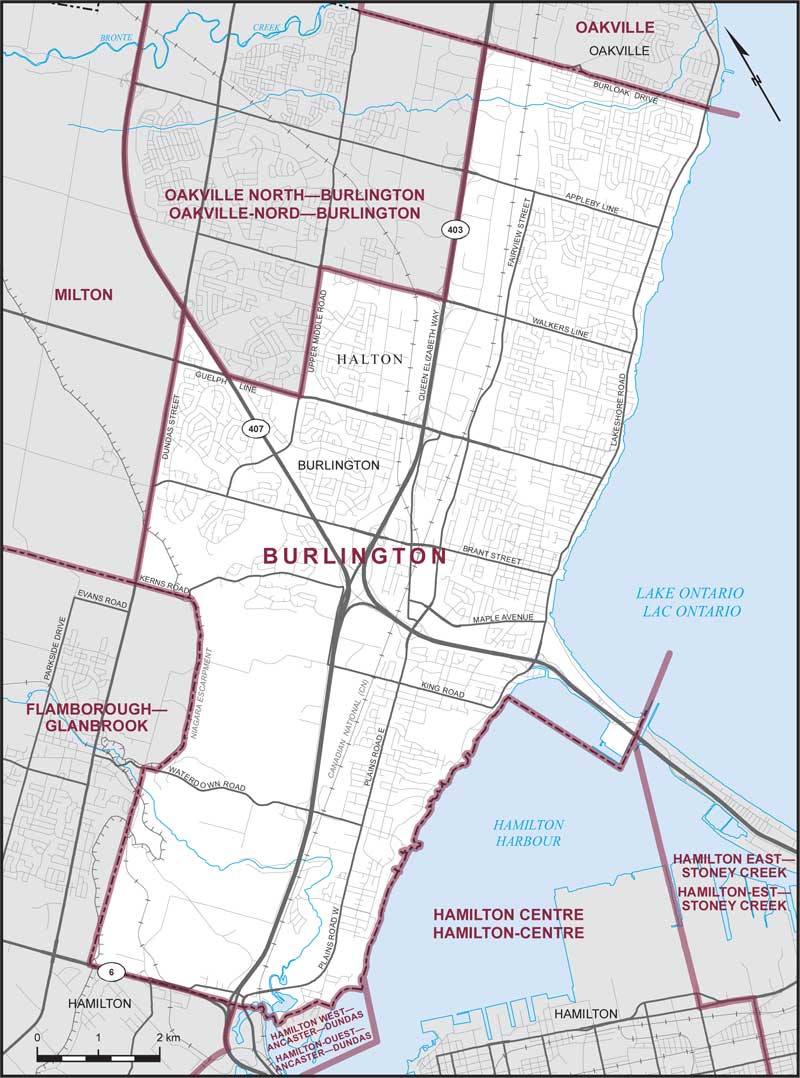
Electoral District:
BurlingtonProvince/Territory:
Ontario-
Population:
125,435 -
Area:
76 km² -
Population density:
1,651.00/km² -
Population change:
+1.8% -
Average age:
46 -
Average income:
$66,100 -
Voter turnout:
70%
Language spoken most often at home:
-
English:
111,130 -
French:
495 -
Indigenous language:
0 -
Most popular other language:
-
Spanish:
1,165
-
-
All others:
7,735
-
-
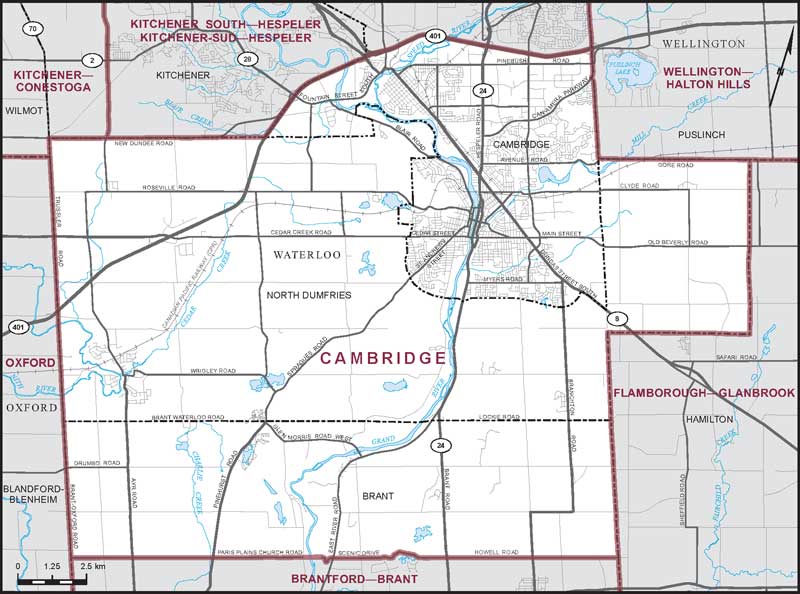
Electoral District:
CambridgeProvince/Territory:
Ontario-
Population:
121,301 -
Area:
348 km² -
Population density:
349.00/km² -
Population change:
+5.1% -
Average age:
41 -
Average income:
$51,650 -
Voter turnout:
61%
Language spoken most often at home:
-
English:
103,075 -
French:
340 -
Indigenous language:
0 -
Most popular other language:
-
Portuguese:
2,245
-
-
All others:
10,770
-
-
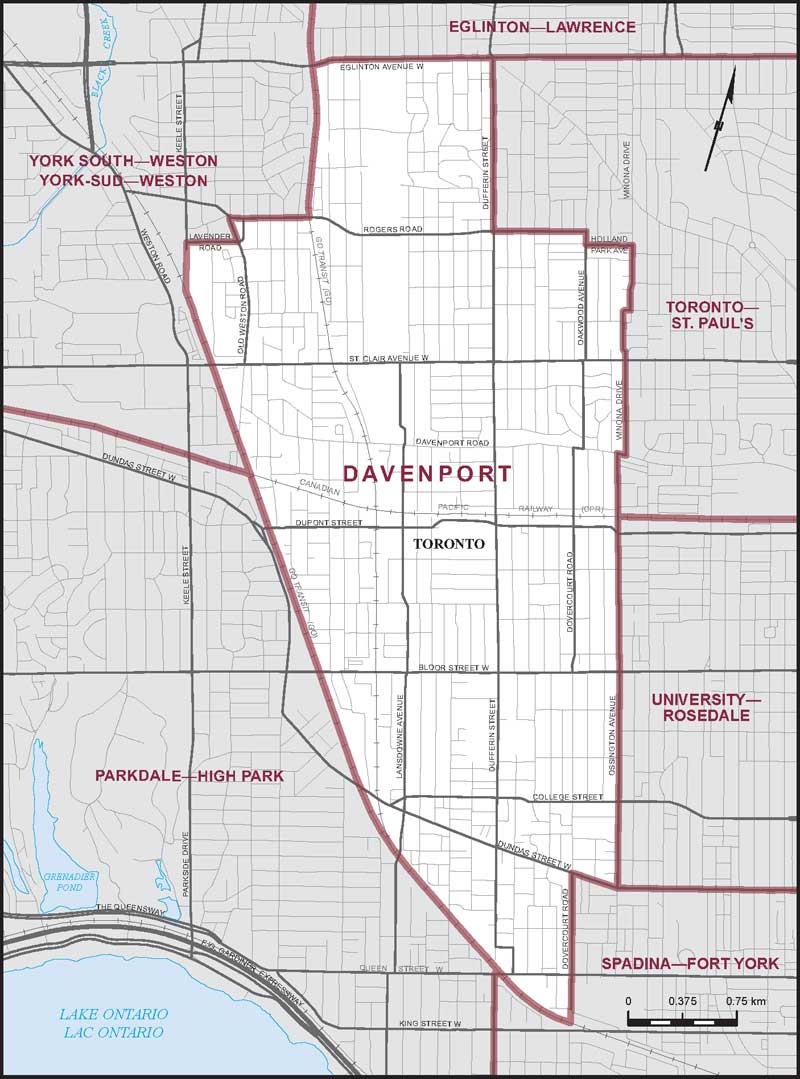
Electoral District:
DavenportProvince/Territory:
Ontario-
Population:
105,946 -
Area:
12 km² -
Population density:
8,769.00/km² -
Population change:
-2.3% -
Average age:
41 -
Average income:
$55,550 -
Voter turnout:
61%
Language spoken most often at home:
-
English:
75,835 -
French:
765 -
Indigenous language:
5 -
Most popular other language:
-
Portuguese:
10,095
-
-
All others:
13,325
-
-
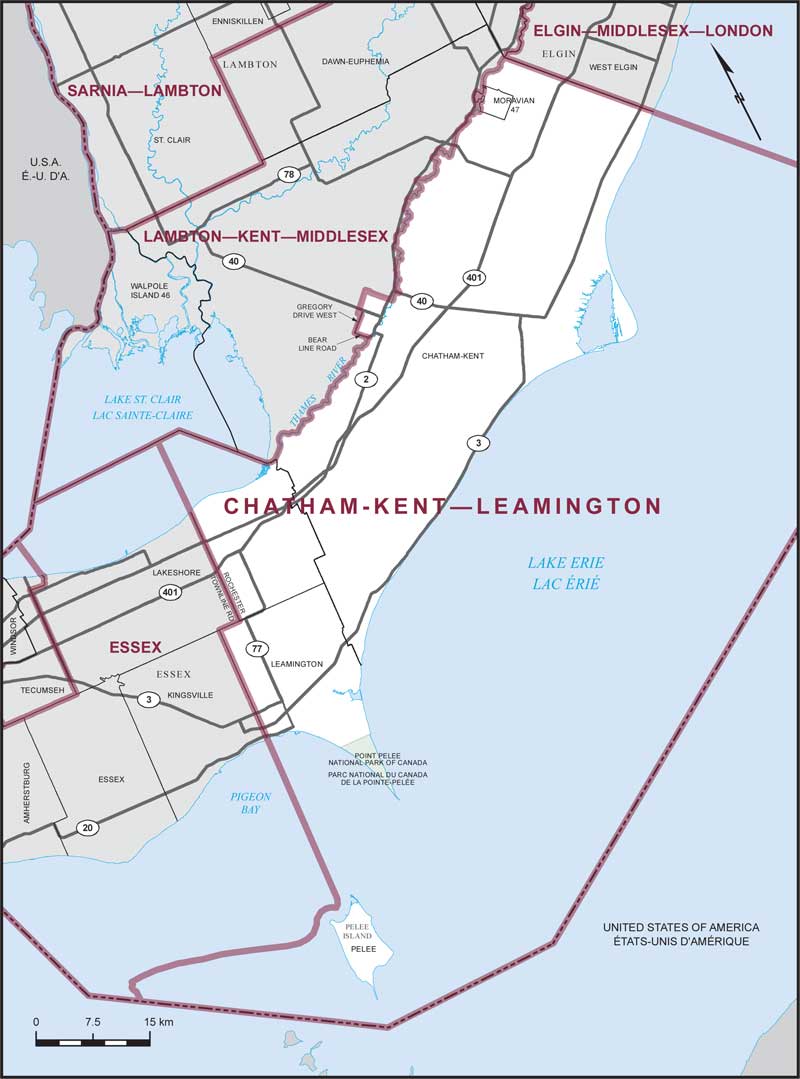
Electoral District:
Chatham-Kent—LeamingtonProvince/Territory:
Ontario-
Population:
113,654 -
Area:
2,040 km² -
Population density:
56.00/km² -
Population change:
+3.7% -
Average age:
44 -
Average income:
$47,480 -
Voter turnout:
64%
Language spoken most often at home:
-
English:
101,340 -
French:
530 -
Indigenous language:
5 -
Most popular other language:
-
German:
1,645
-
-
All others:
6,895
-
-
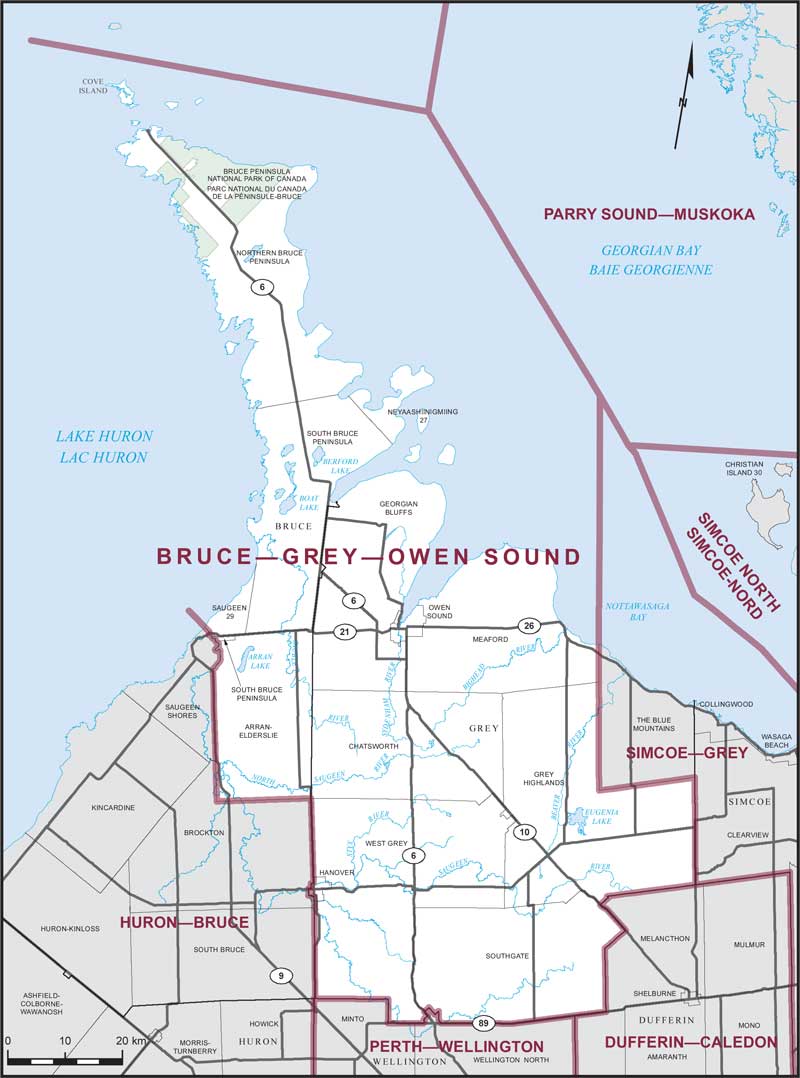
Electoral District:
Bruce—Grey—Owen SoundProvince/Territory:
Ontario-
Population:
113,348 -
Area:
6,089 km² -
Population density:
19.00/km² -
Population change:
+5.3% -
Average age:
46 -
Average income:
$48,760 -
Voter turnout:
64%
Language spoken most often at home:
-
English:
106,760 -
French:
185 -
Indigenous language:
15 -
Most popular other language:
-
German & Pennsylvania German:
2,735
-
-
All others:
1,710
-
-
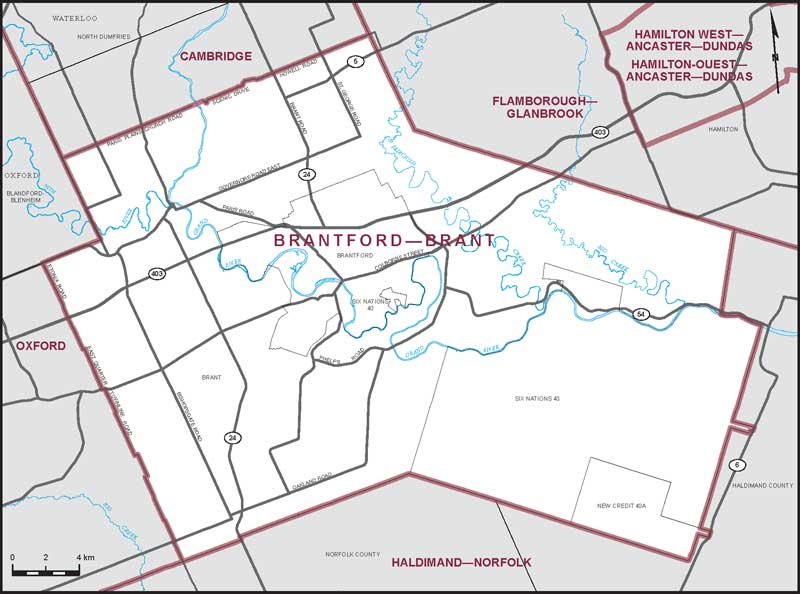
Electoral District:
Brantford—BrantProvince/Territory:
Ontario-
Population:
140,139 -
Area:
829 km² -
Population density:
169.00/km² -
Population change:
+7.6% -
Average age:
42 -
Average income:
$49,800 -
Voter turnout:
60%
Language spoken most often at home:
-
English:
127,930 -
French:
280 -
Indigenous language:
5 -
Most popular other language:
-
Punjabi (Panjabi):
1,985
-
-
All others:
5,840
-
-
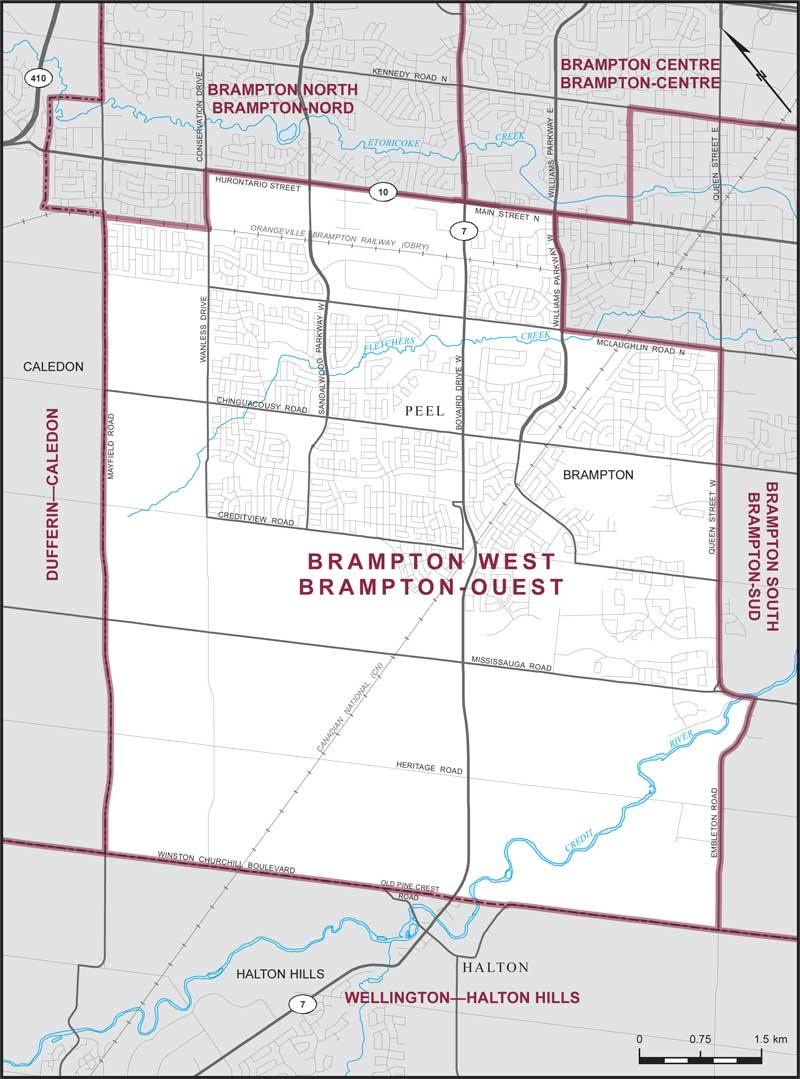
Electoral District:
Brampton WestProvince/Territory:
Ontario-
Population:
162,353 -
Area:
56 km² -
Population density:
2,802.00/km² -
Population change:
+24.9% -
Average age:
35 -
Average income:
$46,640 -
Voter turnout:
54%
Language spoken most often at home:
-
English:
87,035 -
French:
705 -
Indigenous language:
0 -
Most popular other language:
-
Punjabi (Panjabi):
26,490
-
-
All others:
27,730
-
-
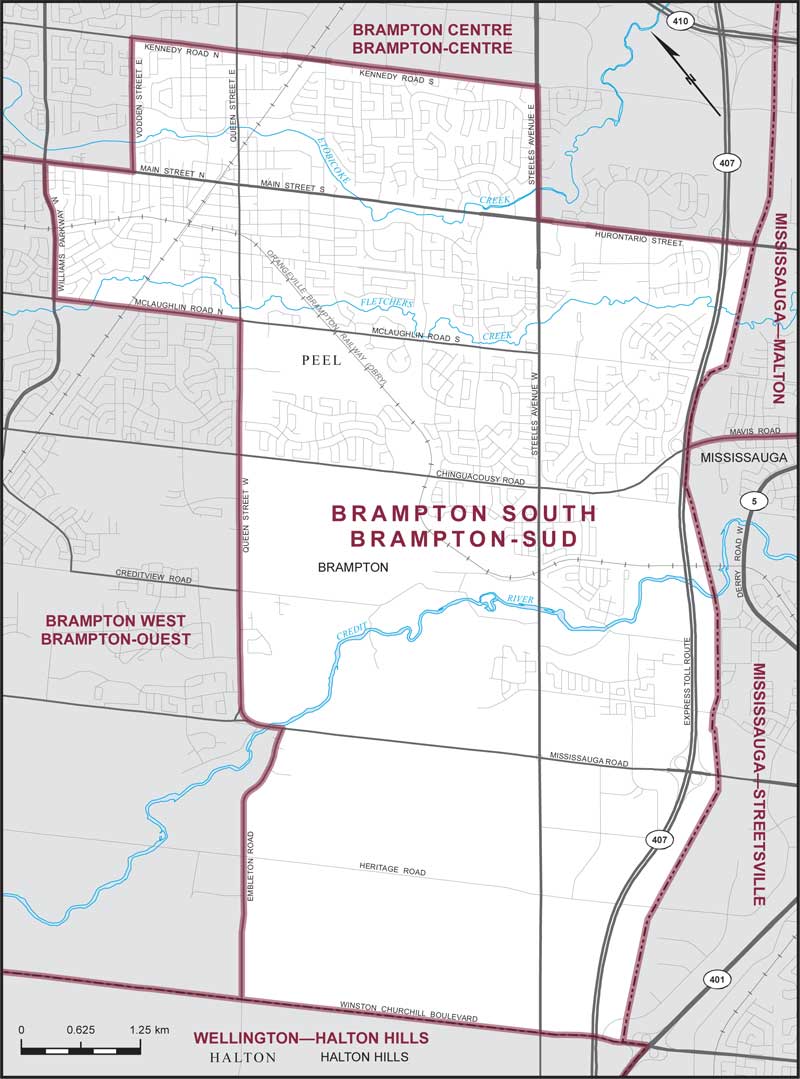
Electoral District:
Brampton SouthProvince/Territory:
Ontario-
Population:
132,752 -
Area:
47 km² -
Population density:
2,847.00/km² -
Population change:
+9.5% -
Average age:
39 -
Average income:
$45,920 -
Voter turnout:
55%
Language spoken most often at home:
-
English:
74,085 -
French:
430 -
Indigenous language:
0 -
Most popular other language:
-
Punjabi (Panjabi):
20,130
-
-
All others:
22,115
-
-
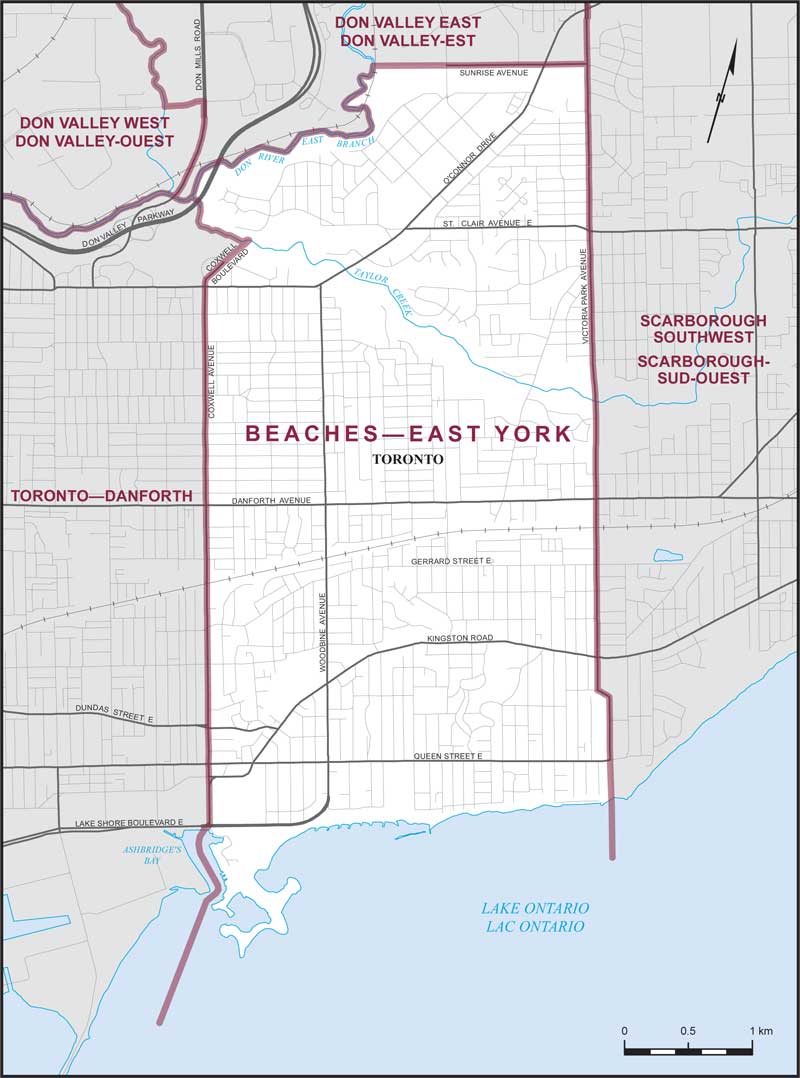
Electoral District:
Beaches—East YorkProvince/Territory:
Ontario-
Population:
109,359 -
Area:
17 km² -
Population density:
6,532.00/km² -
Population change:
-0.1% -
Average age:
41 -
Average income:
$69,500 -
Voter turnout:
65%
Language spoken most often at home:
-
English:
88,495 -
French:
955 -
Indigenous language:
5 -
Most popular other language:
-
Bengali:
2,220
-
-
All others:
11,865
-
-
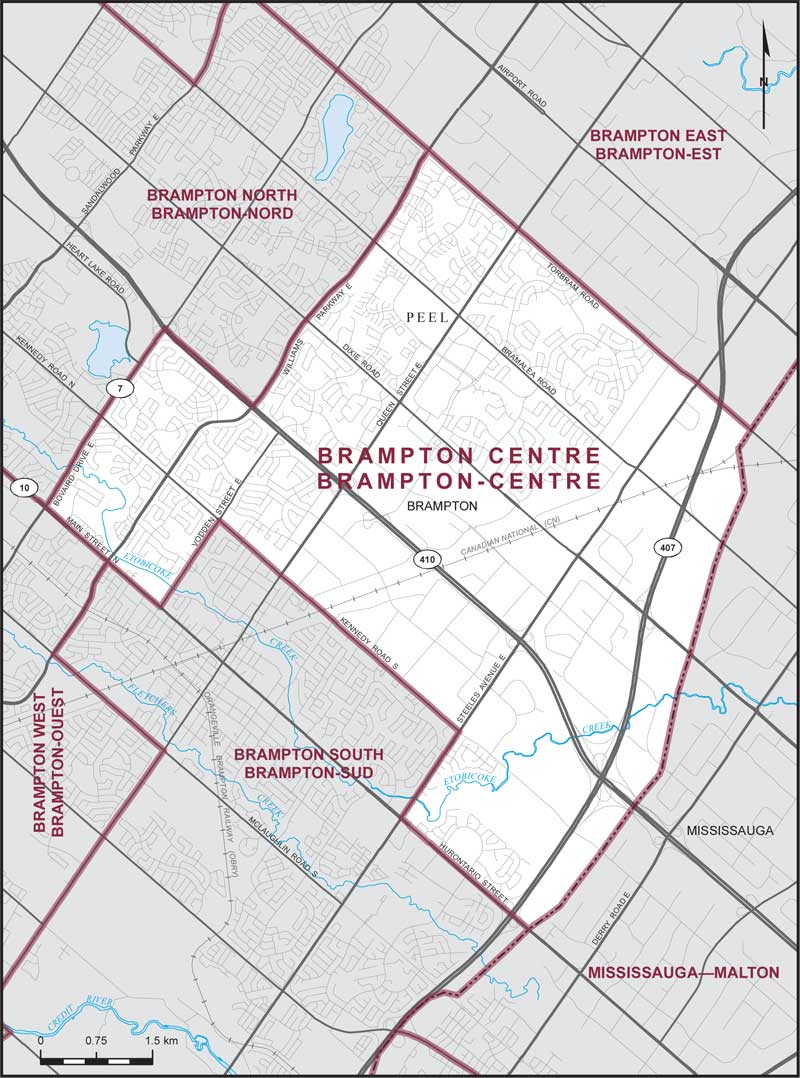
Electoral District:
Brampton CentreProvince/Territory:
Ontario-
Population:
104,557 -
Area:
44 km² -
Population density:
2,397.00/km² -
Population change:
+2.2% -
Average age:
39 -
Average income:
$43,680 -
Voter turnout:
54%
Language spoken most often at home:
-
English:
68,310 -
French:
450 -
Indigenous language:
0 -
Most popular other language:
-
Punjabi (Panjabi):
8,120
-
-
All others:
17,695
-
-
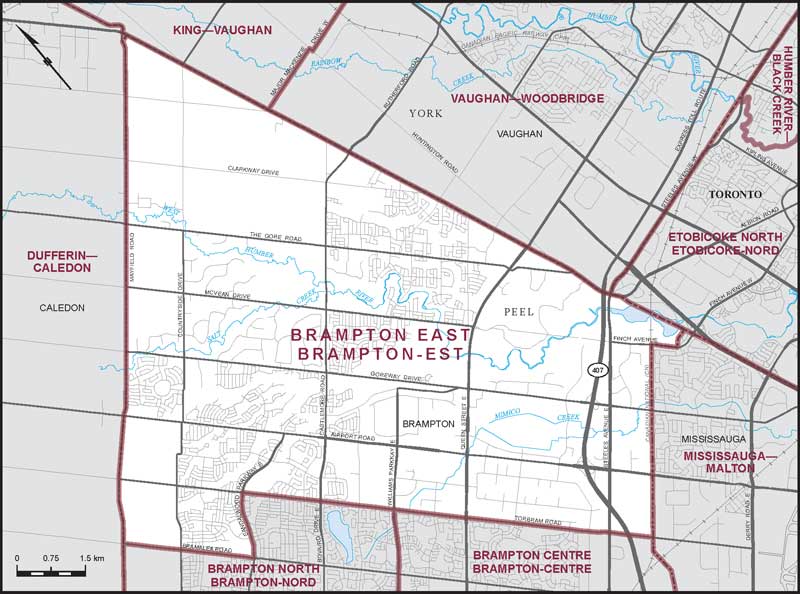
Electoral District:
Brampton EastProvince/Territory:
Ontario-
Population:
131,677 -
Area:
85 km² -
Population density:
1,559.00/km² -
Population change:
+7.9% -
Average age:
37 -
Average income:
$44,160 -
Voter turnout:
54%
Language spoken most often at home:
-
English:
56,785 -
French:
215 -
Indigenous language:
0 -
Most popular other language:
-
Punjabi (Panjabi):
36,550
-
-
All others:
20,865
-
-
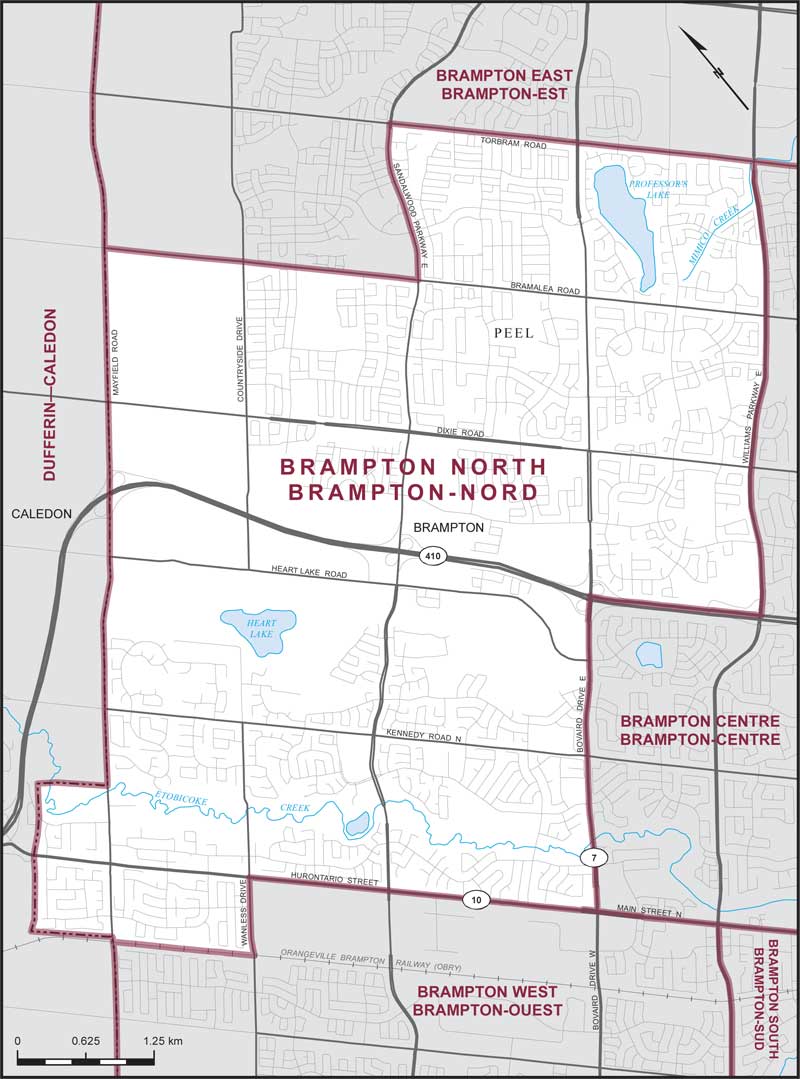
Electoral District:
Brampton NorthProvince/Territory:
Ontario-
Population:
125,141 -
Area:
33 km² -
Population density:
3,769.00/km² -
Population change:
+5.9% -
Average age:
39 -
Average income:
$46,080 -
Voter turnout:
58%
Language spoken most often at home:
-
English:
71,460 -
French:
325 -
Indigenous language:
0 -
Most popular other language:
-
Punjabi (Panjabi):
22,860
-
-
All others:
17,400
-
-
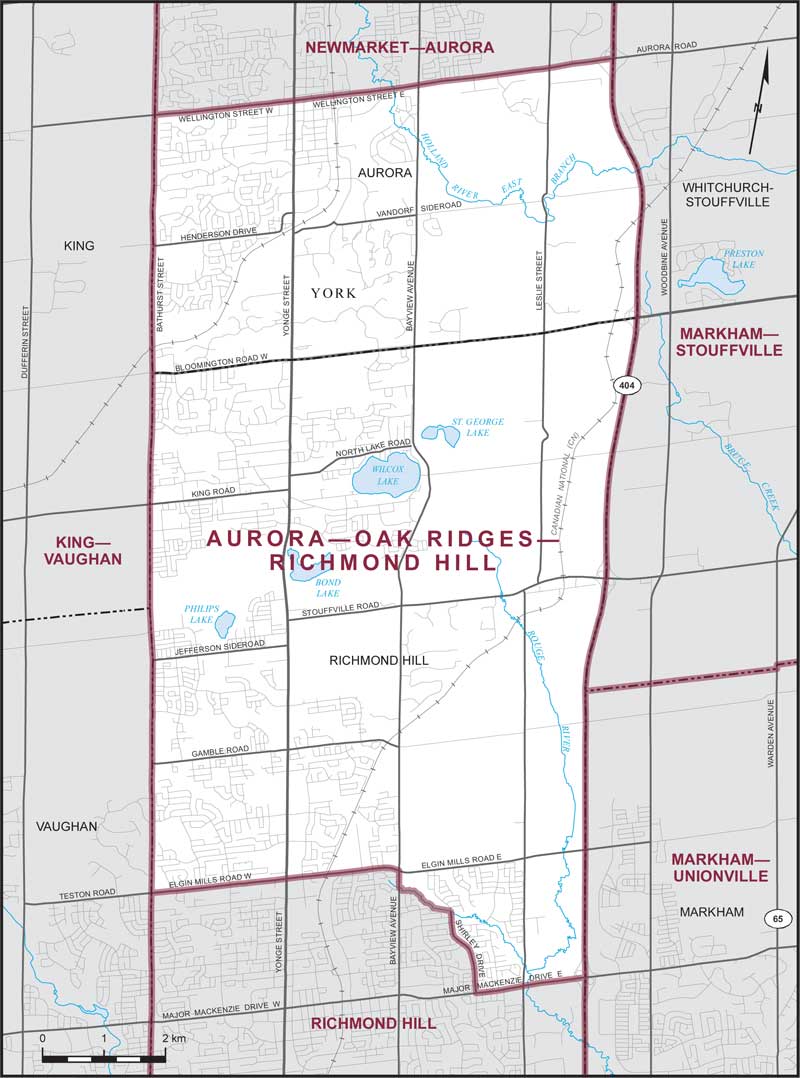
Electoral District:
Aurora—Oak Ridges—Richmond HillProvince/Territory:
Ontario-
Population:
118,883 -
Area:
94 km² -
Population density:
1,258.00/km² -
Population change:
+3.2% -
Average age:
41 -
Average income:
$63,900 -
Voter turnout:
55%
Language spoken most often at home:
-
English:
68,695 -
French:
305 -
Indigenous language:
0 -
Most popular other language:
-
Mandarin & Yue (Cantonese):
20,035
-
-
All others:
20,345
-
-
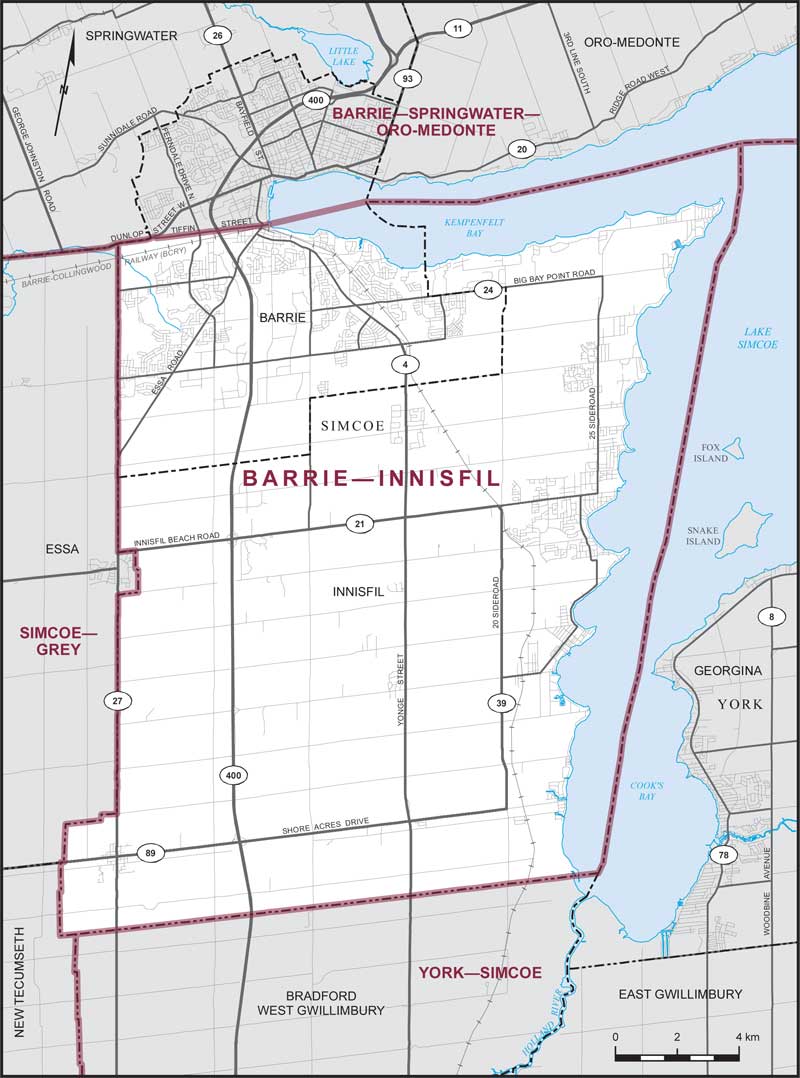
Electoral District:
Barrie—InnisfilProvince/Territory:
Ontario-
Population:
120,378 -
Area:
331 km² -
Population density:
364.00/km² -
Population change:
+10.1% -
Average age:
40 -
Average income:
$54,200 -
Voter turnout:
59%
Language spoken most often at home:
-
English:
107,005 -
French:
555 -
Indigenous language:
0 -
Most popular other language:
-
Russian:
1,515
-
-
All others:
7,685
-