Federal Electoral District Fact Sheets
-
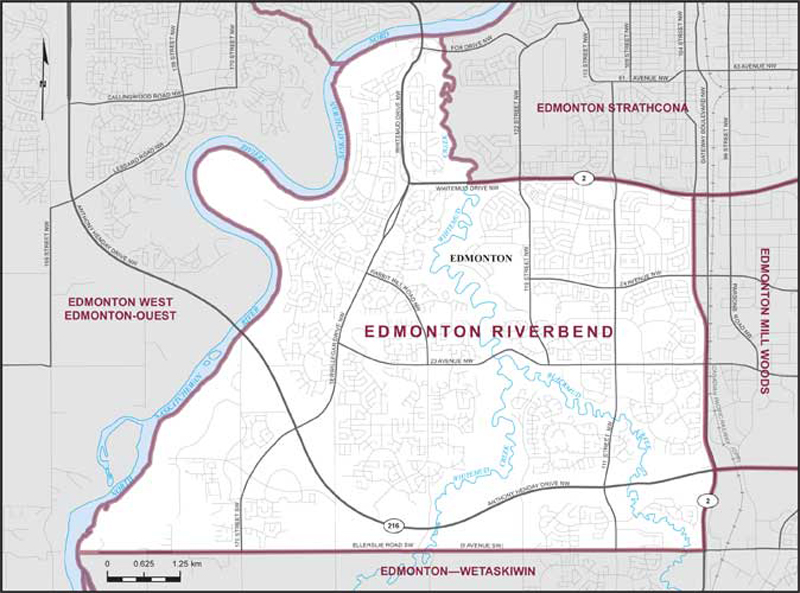
Electoral District:
Edmonton RiverbendProvince/Territory:
Alberta-
Population:
111,578 -
Area:
126 km² -
Population density:
886.00/km² -
Population change:
n/a -
Average age:
38 -
Average income:
$71,800 -
Voter turnout:
65%
Language spoken most often at home:
-
English:
82,350 -
French:
505 -
Indigenous language:
20 -
Most popular other language:
-
Mandarin:
4,800
-
-
All others:
17,035
-
-
Electoral District:
Edmonton NorthwestProvince/Territory:
Alberta-
Population:
112,964 -
Area:
104 km² -
Population density:
1,086.00/km² -
Population change:
n/a -
Average age:
37 -
Average income:
$54,450 -
Voter turnout:
59%
Language spoken most often at home:
-
English:
82,210 -
French:
580 -
Indigenous language:
15 -
Most popular other language:
-
Tagalog (Pilipino, Filipino):
3,895
-
-
All others:
16,540
-
-
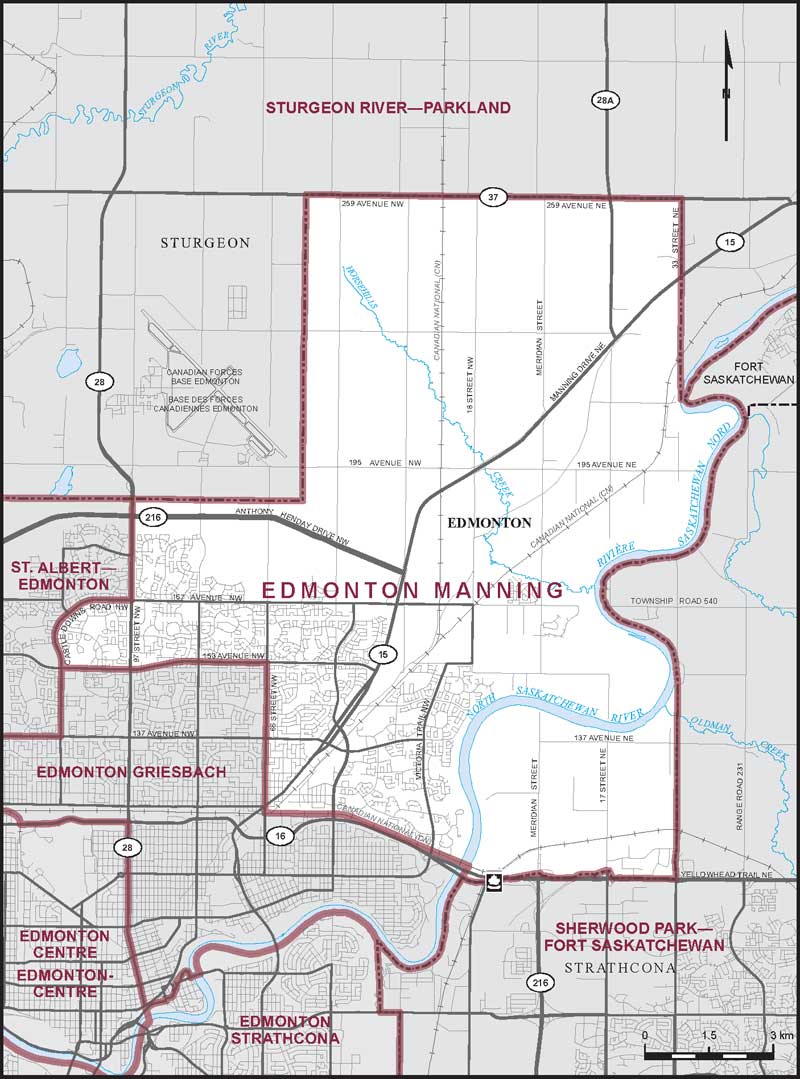
Electoral District:
Edmonton ManningProvince/Territory:
Alberta-
Population:
112,180 -
Area:
151 km² -
Population density:
743.00/km² -
Population change:
n/a -
Average age:
37 -
Average income:
$51,650 -
Voter turnout:
55%
Language spoken most often at home:
-
English:
83,445 -
French:
910 -
Indigenous language:
45 -
Most popular other language:
-
Punjabi (Panjabi):
2,940
-
-
All others:
17,245
-
-
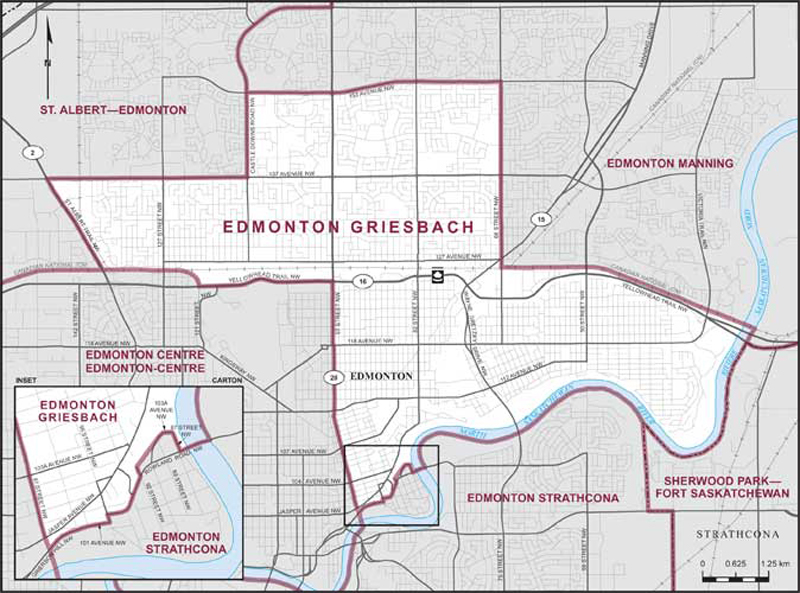
Electoral District:
Edmonton GriesbachProvince/Territory:
Alberta-
Population:
111,126 -
Area:
44 km² -
Population density:
2,526.00/km² -
Population change:
n/a -
Average age:
41 -
Average income:
$47,240 -
Voter turnout:
53%
Language spoken most often at home:
-
English:
84,335 -
French:
635 -
Indigenous language:
105 -
Most popular other language:
-
Arabic:
2,625
-
-
All others:
15,820
-
-
Electoral District:
Edmonton GatewayProvince/Territory:
Alberta-
Population:
110,184 -
Area:
64 km² -
Population density:
1,722.00/km² -
Population change:
n/a -
Average age:
36 -
Average income:
$56,600 -
Voter turnout:
62%
Language spoken most often at home:
-
English:
74,890 -
French:
750 -
Indigenous language:
20 -
Most popular other language:
-
Punjabi (Panjabi):
4,135
-
-
All others:
21,565
-
-
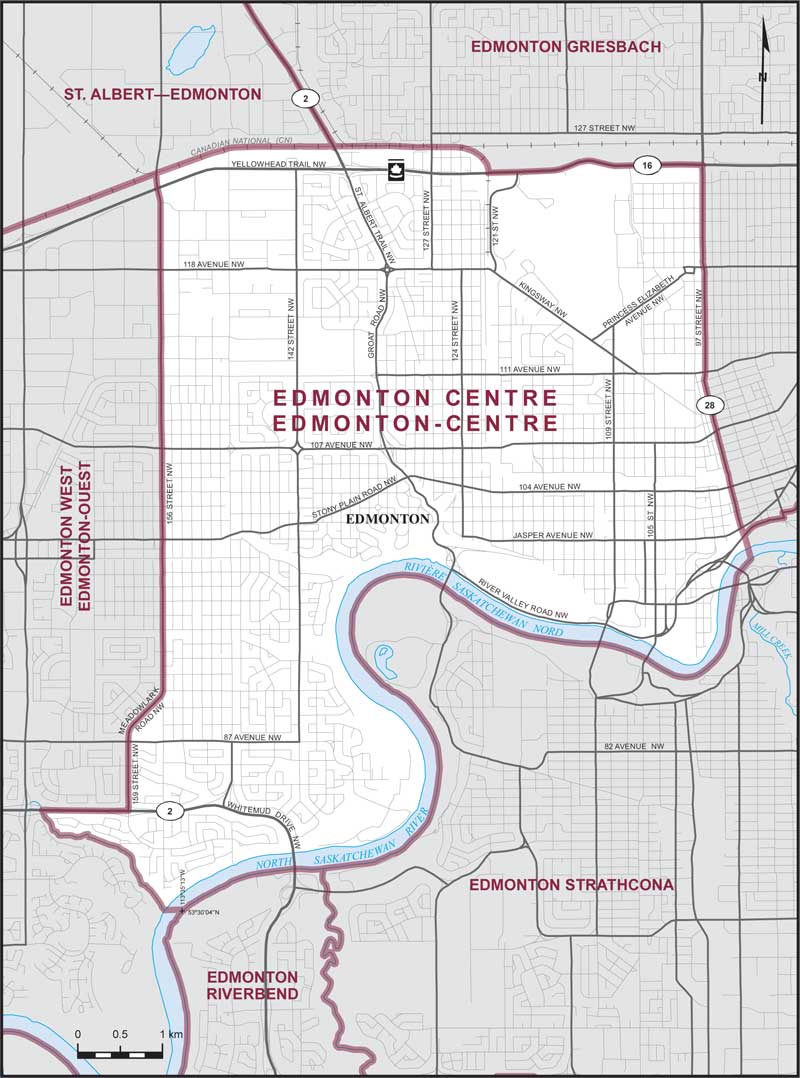
Electoral District:
Edmonton CentreProvince/Territory:
Alberta-
Population:
115,160 -
Area:
46 km² -
Population density:
2,503.00/km² -
Population change:
n/a -
Average age:
41 -
Average income:
$54,750 -
Voter turnout:
60%
Language spoken most often at home:
-
English:
92,375 -
French:
755 -
Indigenous language:
125 -
Most popular other language:
-
Tagalog (Pilipino, Filipino):
2,295
-
-
All others:
13,135
-
-
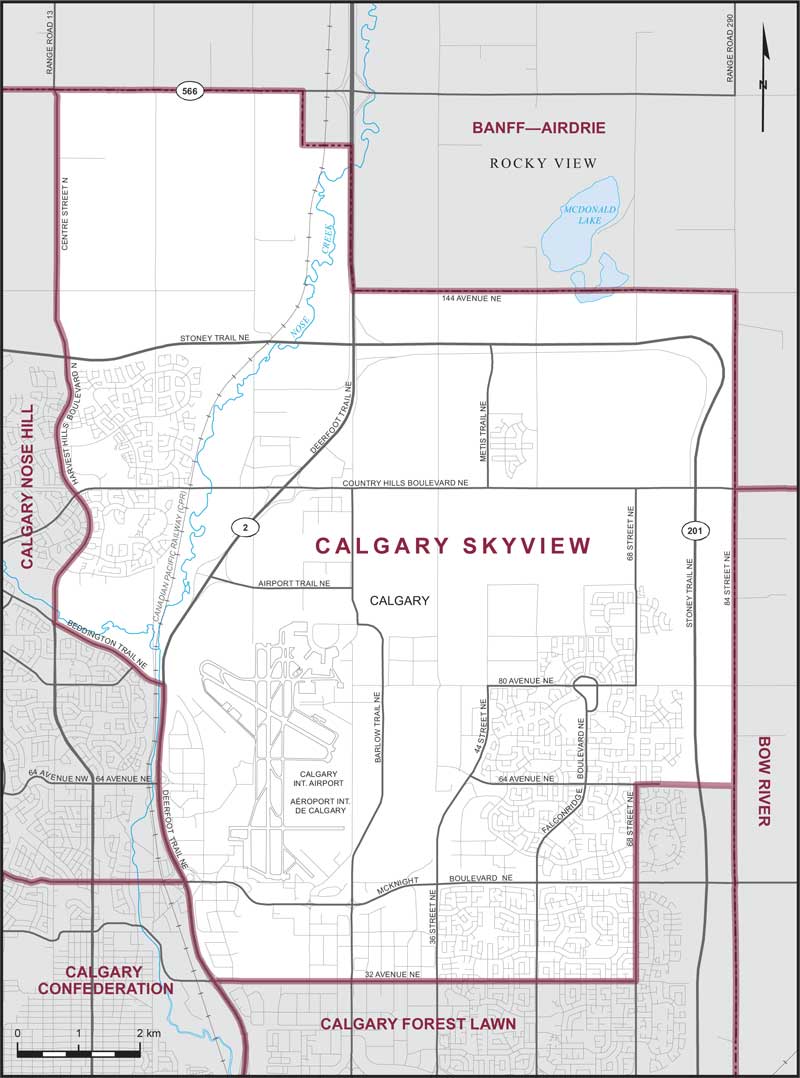
Electoral District:
Calgary SkyviewProvince/Territory:
Alberta-
Population:
115,277 -
Area:
87 km² -
Population density:
1,325.00/km² -
Population change:
n/a -
Average age:
34 -
Average income:
$52,300 -
Voter turnout:
56%
Language spoken most often at home:
-
English:
65,115 -
French:
450 -
Indigenous language:
5 -
Most popular other language:
-
Punjabi (Panjabi):
11,780
-
-
All others:
25,965
-
-
Electoral District:
Calgary Signal HillProvince/Territory:
Alberta-
Population:
120,203 -
Area:
64 km² -
Population density:
1,878.00/km² -
Population change:
n/a -
Average age:
40 -
Average income:
$82,900 -
Voter turnout:
68%
Language spoken most often at home:
-
English:
96,375 -
French:
640 -
Indigenous language:
10 -
Most popular other language:
-
Mandarin:
2,725
-
-
All others:
14,495
-
-
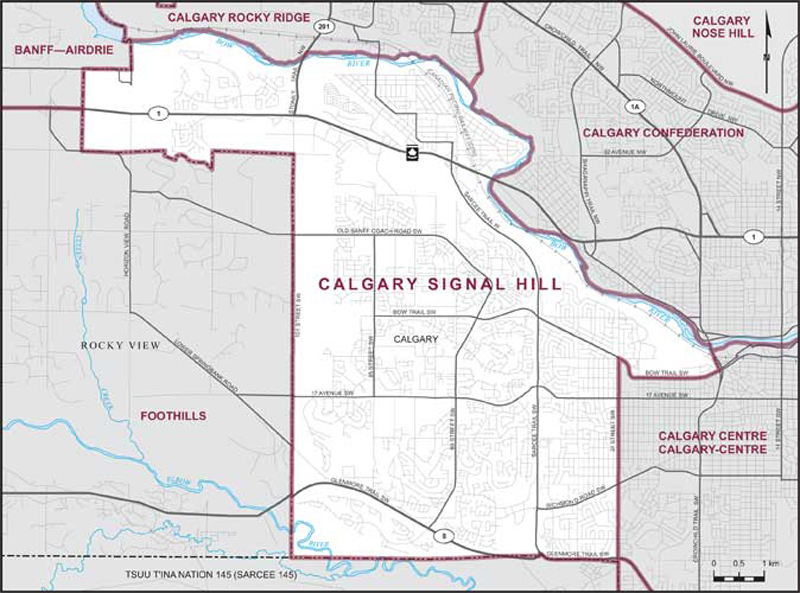
Electoral District:
Calgary ShepardProvince/Territory:
Alberta-
Population:
115,093 -
Area:
106 km² -
Population density:
1,086.00/km² -
Population change:
n/a -
Average age:
34 -
Average income:
$69,400 -
Voter turnout:
65%
Language spoken most often at home:
-
English:
94,560 -
French:
515 -
Indigenous language:
0 -
Most popular other language:
-
Tagalog (Pilipino, Filipino):
2,625
-
-
All others:
12,105
-
-
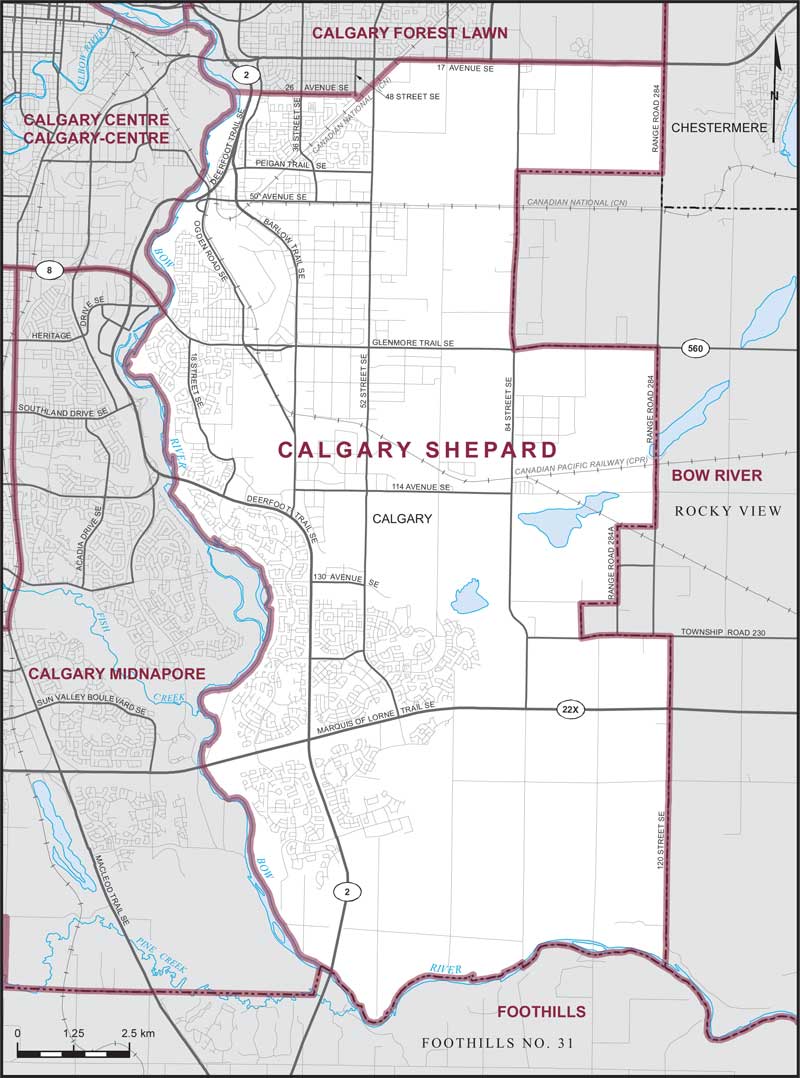
Electoral District:
Calgary Nose HillProvince/Territory:
Alberta-
Population:
117,677 -
Area:
62 km² -
Population density:
1,898.00/km² -
Population change:
n/a -
Average age:
41 -
Average income:
$57,200 -
Voter turnout:
63%
Language spoken most often at home:
-
English:
87,205 -
French:
410 -
Indigenous language:
10 -
Most popular other language:
-
Yue (Cantonese):
6,410
-
-
All others:
17,225
-
-
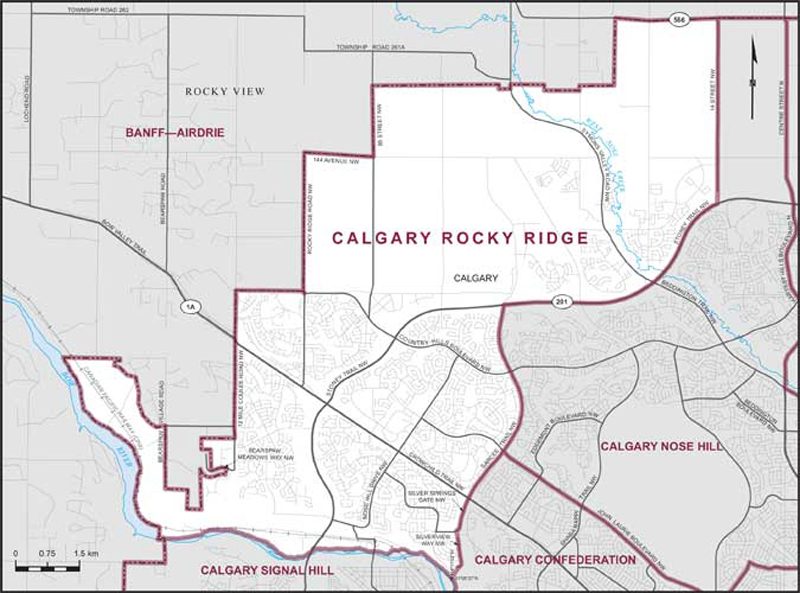
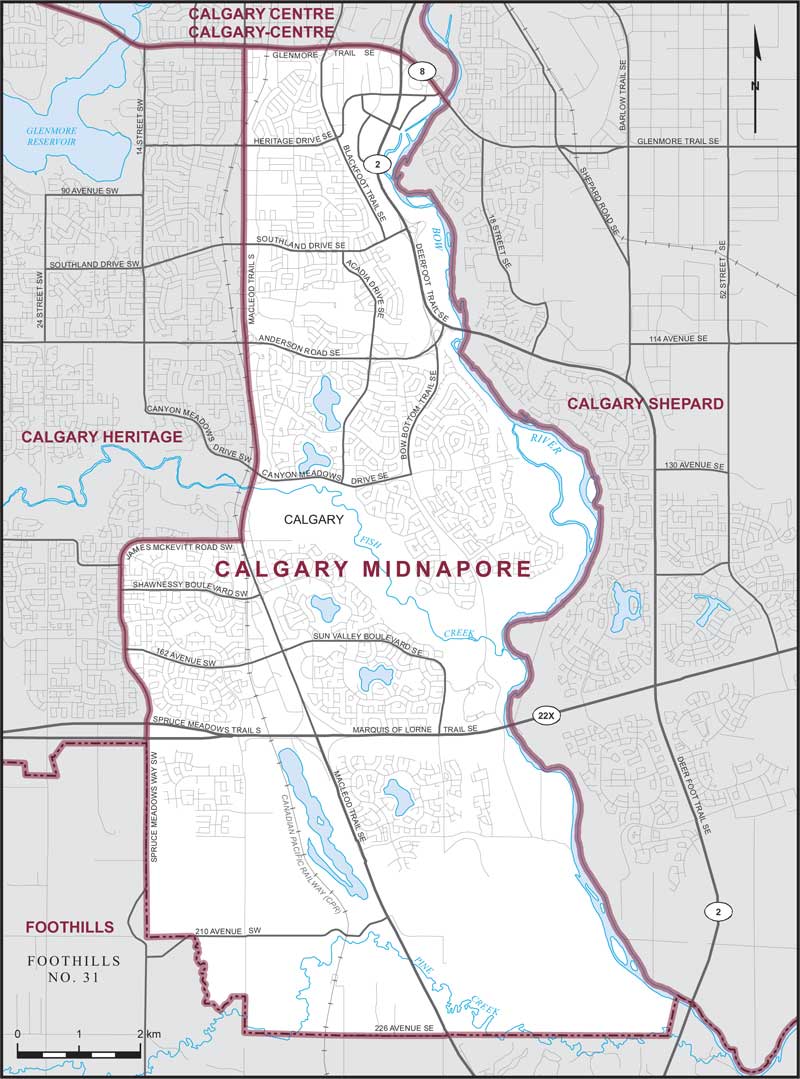
Electoral District:
Calgary MidnaporeProvince/Territory:
Alberta-
Population:
118,694 -
Area:
80 km² -
Population density:
1,484.00/km² -
Population change:
n/a -
Average age:
40 -
Average income:
$65,000 -
Voter turnout:
68%
Language spoken most often at home:
-
English:
97,920 -
French:
510 -
Indigenous language:
15 -
Most popular other language:
-
Tagalog (Pilipino, Filipino):
2,905
-
-
All others:
11,640
-
-
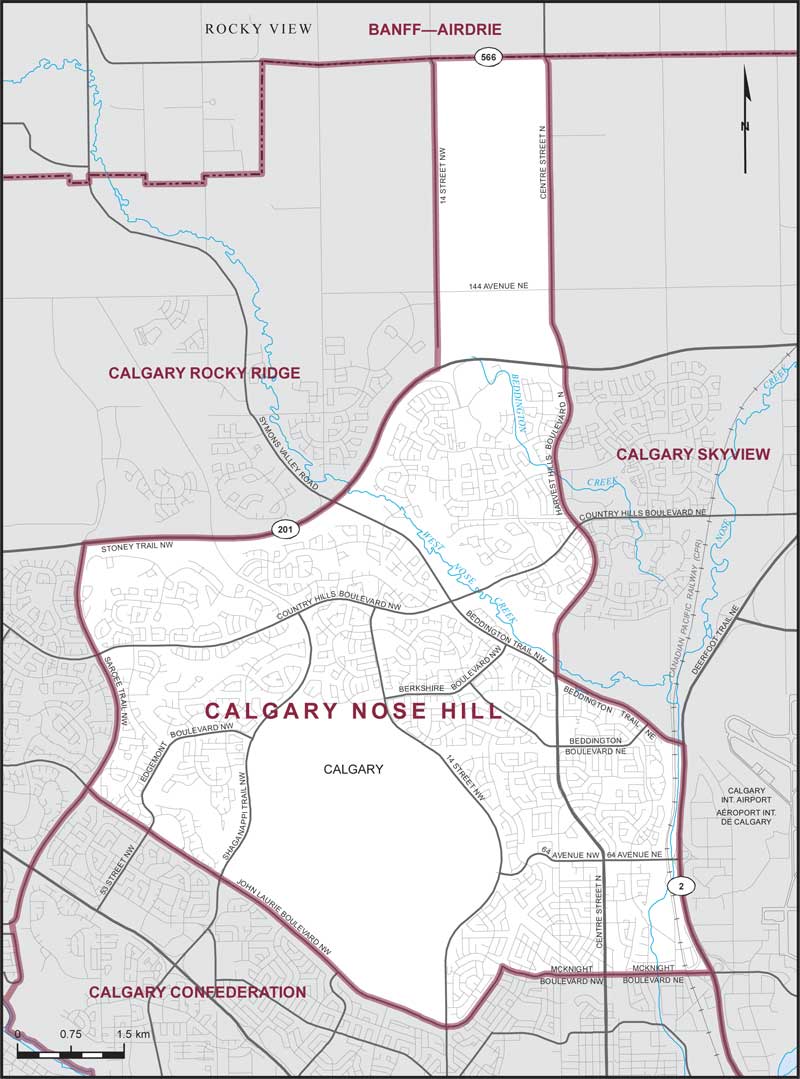
Electoral District:
Calgary McKnightProvince/Territory:
Alberta-
Population:
123,148 -
Area:
74 km² -
Population density:
1,664.00/km² -
Population change:
n/a -
Average age:
37 -
Average income:
$40,440 -
Voter turnout:
52%
Language spoken most often at home:
-
English:
61,275 -
French:
390 -
Indigenous language:
10 -
Most popular other language:
-
Punjabi (Panjabi):
20,550
-
-
All others:
27,845
-
-
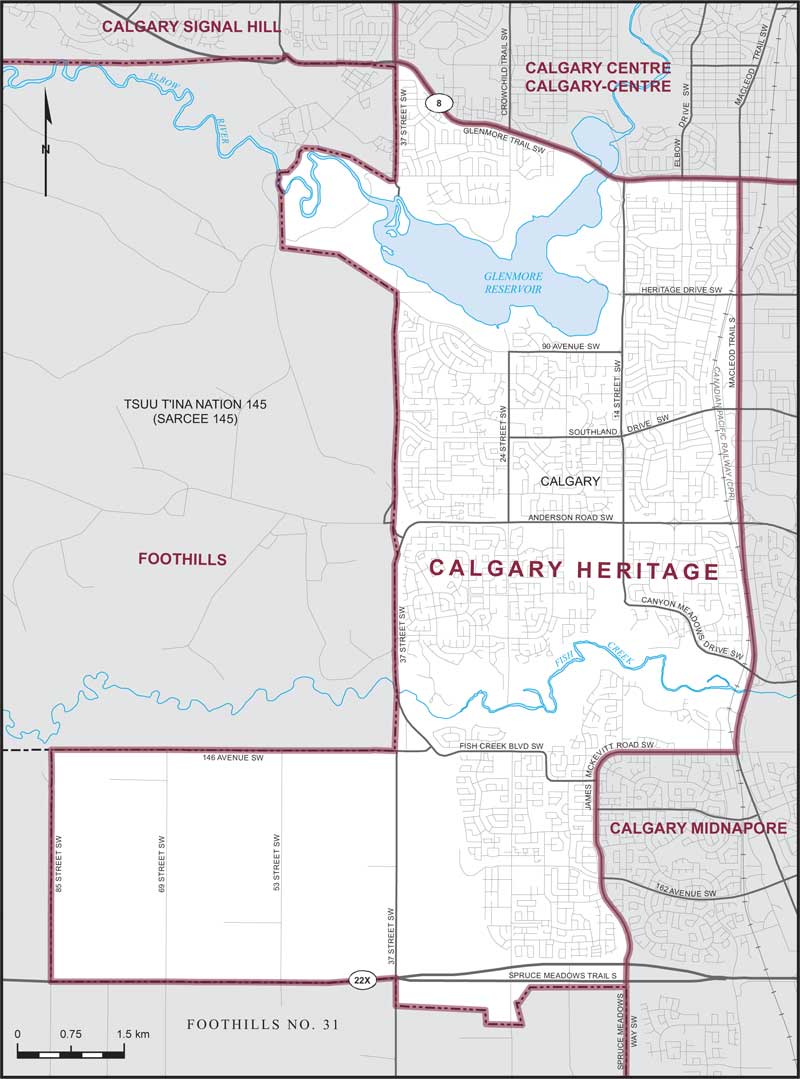
Electoral District:
Calgary HeritageProvince/Territory:
Alberta-
Population:
119,557 -
Area:
70 km² -
Population density:
1,708.00/km² -
Population change:
n/a -
Average age:
42 -
Average income:
$64,400 -
Voter turnout:
66%
Language spoken most often at home:
-
English:
94,735 -
French:
485 -
Indigenous language:
10 -
Most popular other language:
-
Tagalog (Pilipino, Filipino):
3,685
-
-
All others:
14,345
-
-
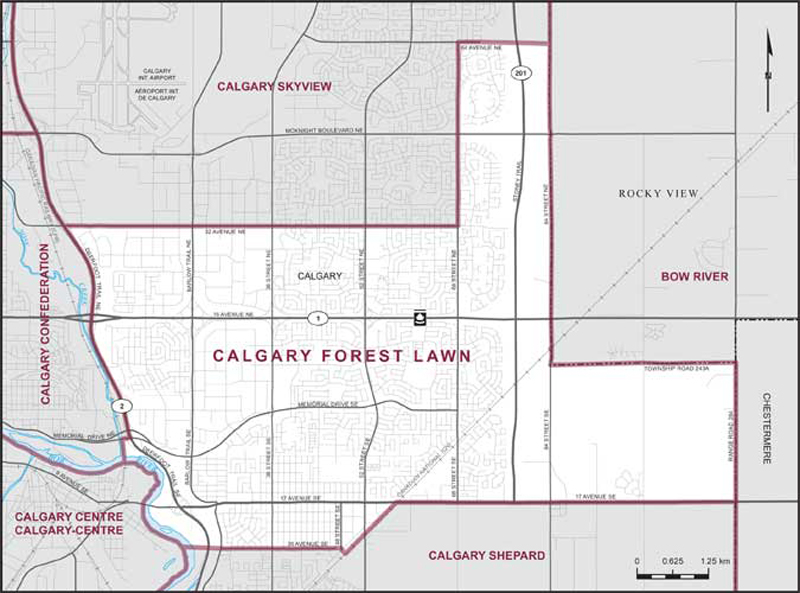
Electoral District:
Calgary EastProvince/Territory:
Alberta-
Population:
119,550 -
Area:
108 km² -
Population density:
1,107.00/km² -
Population change:
n/a -
Average age:
40 -
Average income:
$46,880 -
Voter turnout:
53%
Language spoken most often at home:
-
English:
89,785 -
French:
505 -
Indigenous language:
15 -
Most popular other language:
-
Tagalog (Pilipino, Filipino):
4,355
-
-
All others:
17,885
-
-
Electoral District:
Calgary CrowfootProvince/Territory:
Alberta-
Population:
117,541 -
Area:
73 km² -
Population density:
1,610.00/km² -
Population change:
n/a -
Average age:
39 -
Average income:
$66,400 -
Voter turnout:
68%
Language spoken most often at home:
-
English:
89,725 -
French:
500 -
Indigenous language:
5 -
Most popular other language:
-
Mandarin:
3,685
-
-
All others:
16,225
-
-
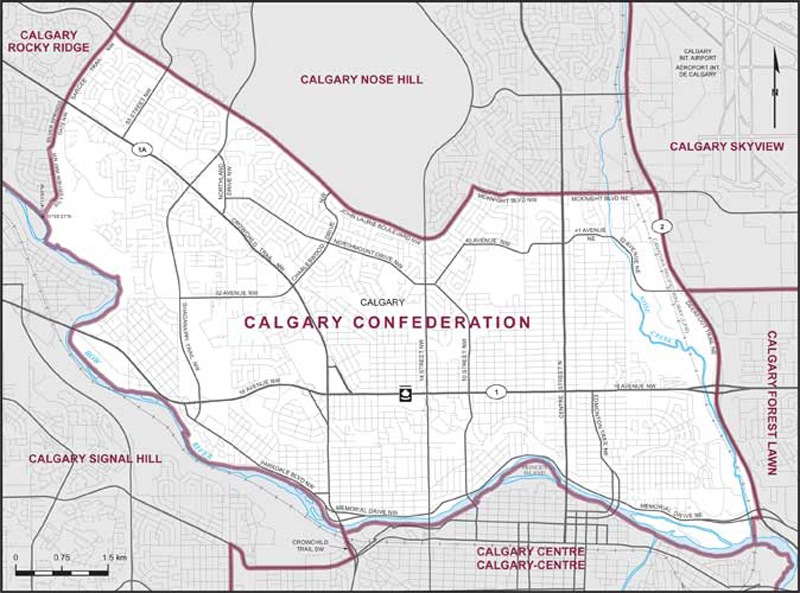
Electoral District:
Calgary ConfederationProvince/Territory:
Alberta-
Population:
119,508 -
Area:
52 km² -
Population density:
2,298.00/km² -
Population change:
n/a -
Average age:
41 -
Average income:
$75,400 -
Voter turnout:
67%
Language spoken most often at home:
-
English:
101,670 -
French:
555 -
Indigenous language:
10 -
Most popular other language:
-
Mandarin:
1,990
-
-
All others:
9,470
-
