
1867–2021
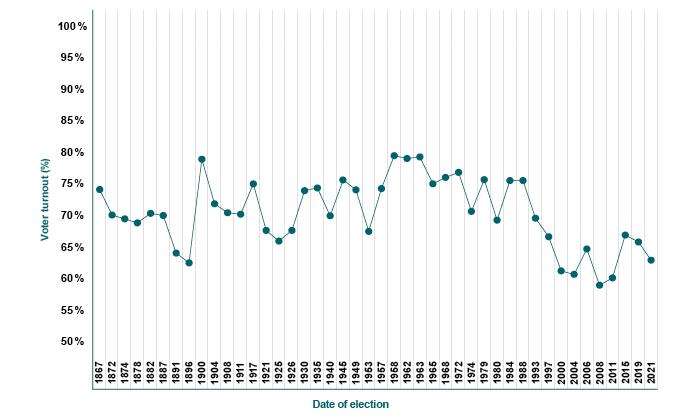
The line graph provides the following statistics:
Date of election | Voter turnout (%) |
|---|---|
1867 | 73.1 |
1872 | 70.3 |
1874 | 69.6 |
1878 | 69.1 |
1882 | 70.3 |
1887 | 70.1 |
1891 | 64.4 |
1896 | 62.9 |
1900 | 77.4 |
1904 | 71.6 |
1908 | 70.3 |
1911 | 70.2 |
1917 | 75.0 |
1921 | 67.7 |
1925 | 66.4 |
1926 | 67.7 |
1930 | 73.5 |
1935 | 74.2 |
1940 | 69.9 |
1945 | 75.3 |
1949 | 73.8 |
1953 | 67.5 |
1957 | 74.1 |
1958 | 79.4 |
1962 | 79.0 |
1963 | 79.2 |
1965 | 74.8 |
1968 | 75.7 |
1972 | 76.7 |
1974 | 71.0 |
1979 | 75.7 |
1980 | 69.3 |
1984 | 75.3 |
1988 | 75.3 |
1993 | 69.6 |
1997 | 67.0 |
2000 | 61.2 |
2004 | 60.9 |
2006 | 64.7 |
2008 | 58.8 |
2011 | 61.1 |
2015 | 68.3 |
| 2019 | 67.0 |
| 2021 | 62.6 |