Federal Electoral District Fact Sheets
-
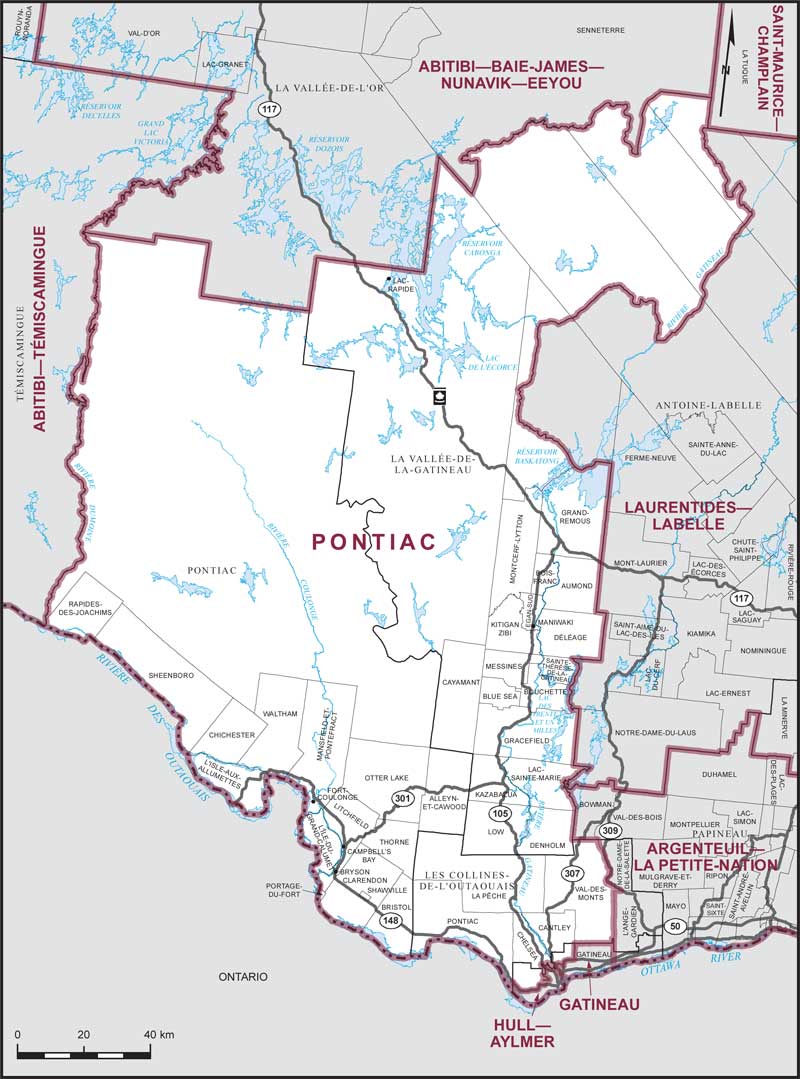
Electoral District:
Pontiac—Kitigan ZibiProvince/Territory:
Québec-
Population:
111,138 -
Area:
26,513 km² -
Population density:
4.00/km² -
Population change:
n/a -
Average age:
40 -
Average income:
$56,550 -
Voter turnout:
69%
Language spoken most often at home:
-
English:
34,020 -
French:
66,540 -
Indigenous language:
65 -
Most popular other language:
-
Arabic:
980
-
-
All others:
3,600
-
-
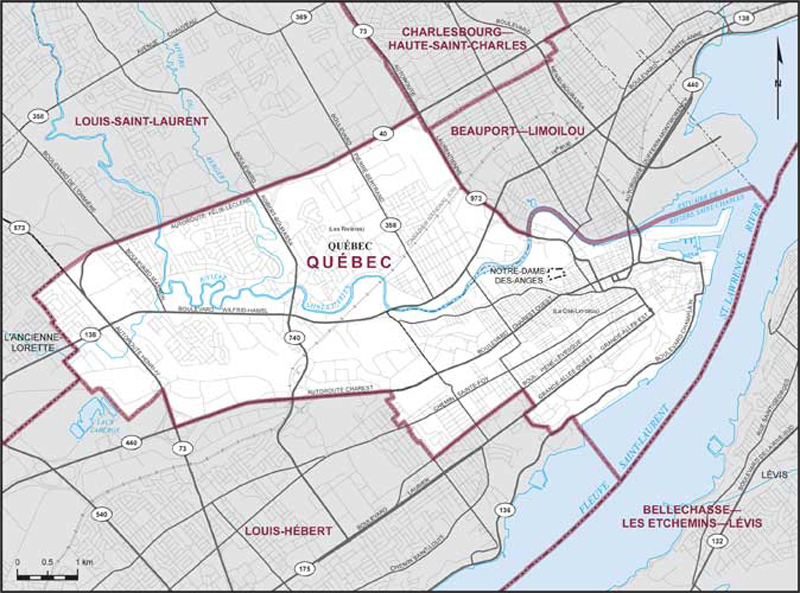
Electoral District:
Québec CentreProvince/Territory:
Québec-
Population:
103,977 -
Area:
37 km² -
Population density:
2,810.00/km² -
Population change:
n/a -
Average age:
46 -
Average income:
$50,960 -
Voter turnout:
70%
Language spoken most often at home:
-
English:
1,915 -
French:
93,205 -
Indigenous language:
35 -
Most popular other language:
-
Spanish:
1,210
-
-
All others:
2,695
-
-
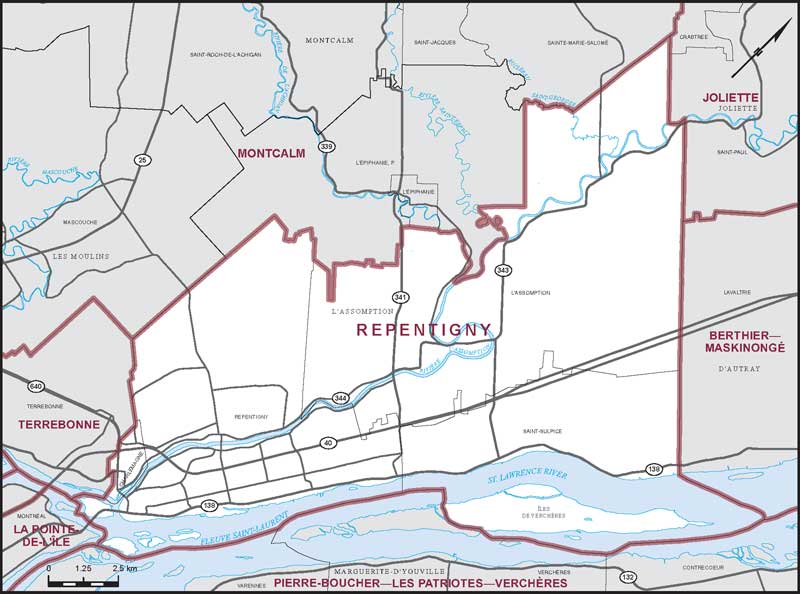
Electoral District:
RepentignyProvince/Territory:
Québec-
Population:
111,373 -
Area:
141 km² -
Population density:
790.00/km² -
Population change:
n/a -
Average age:
43 -
Average income:
$52,400 -
Voter turnout:
71%
Language spoken most often at home:
-
English:
1,930 -
French:
102,085 -
Indigenous language:
5 -
Most popular other language:
-
Spanish:
1,220
-
-
All others:
2,425
-
-
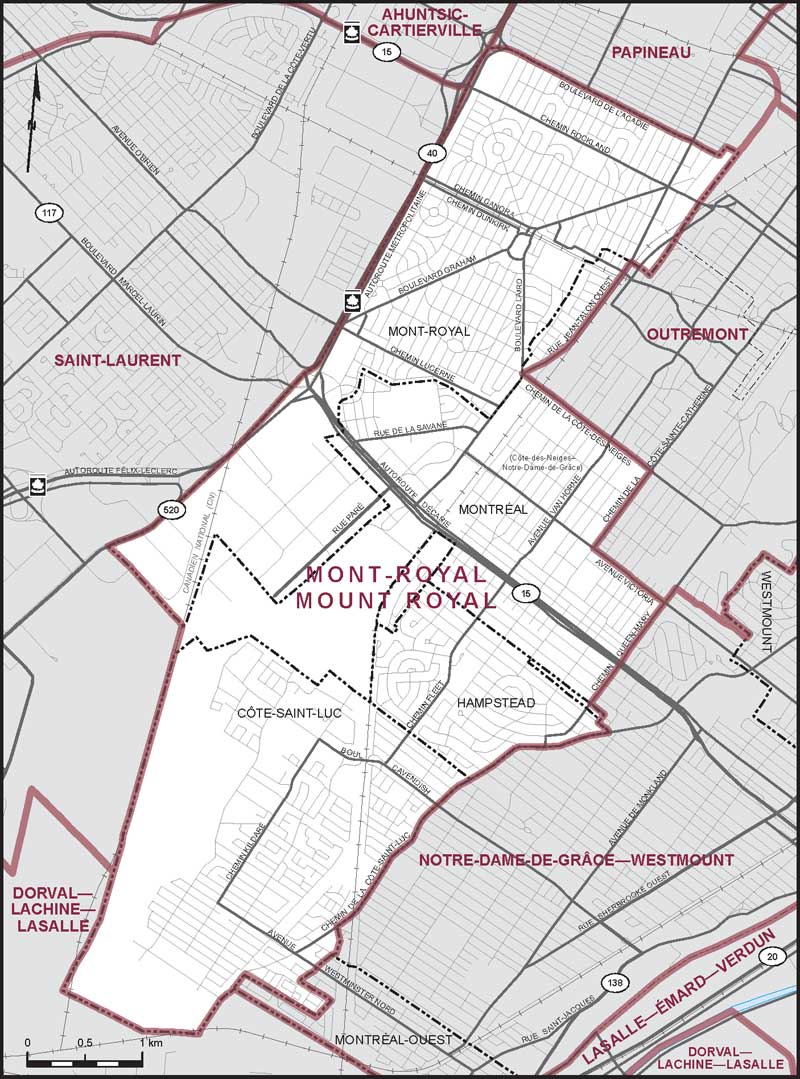
Electoral District:
Notre-Dame-de-Grâce—WestmountProvince/Territory:
Québec-
Population:
111,377 -
Area:
17 km² -
Population density:
6,552.00/km² -
Population change:
n/a -
Average age:
42 -
Average income:
$83,200 -
Voter turnout:
67%
Language spoken most often at home:
-
English:
55,300 -
French:
27,780 -
Indigenous language:
10 -
Most popular other language:
-
Mandarin:
2,520
-
-
All others:
15,405
-
-
Electoral District:
Mont-Saint-Bruno—L'AcadieProvince/Territory:
Québec-
Population:
111,323 -
Area:
205 km² -
Population density:
543.00/km² -
Population change:
n/a -
Average age:
42 -
Average income:
$64,300 -
Voter turnout:
78%
Language spoken most often at home:
-
English:
6,060 -
French:
95,260 -
Indigenous language:
0 -
Most popular other language:
-
Spanish:
1,480
-
-
All others:
3,635
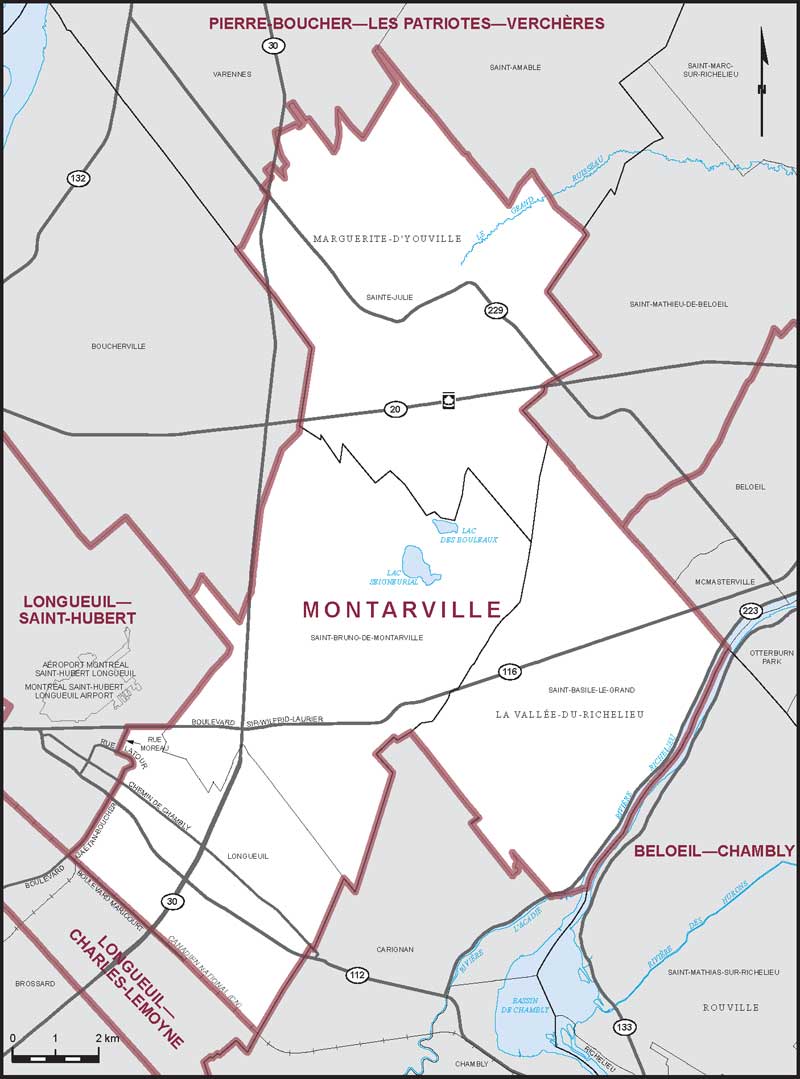
-
-
Electoral District:
MontcalmProvince/Territory:
Québec-
Population:
111,954 -
Area:
730 km² -
Population density:
153.00/km² -
Population change:
n/a -
Average age:
40 -
Average income:
$49,240 -
Voter turnout:
64%
Language spoken most often at home:
-
English:
1,925 -
French:
105,630 -
Indigenous language:
0 -
Most popular other language:
-
Spanish:
645
-
-
All others:
945
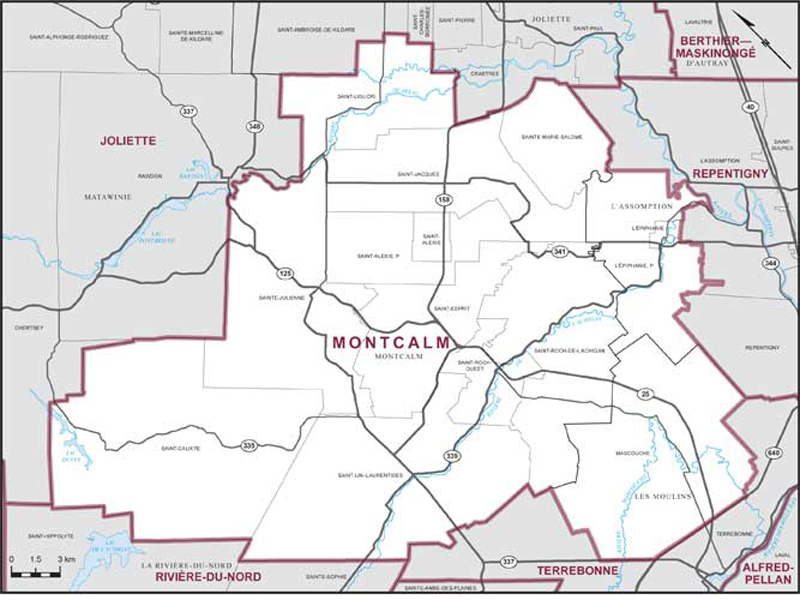
-
-
Electoral District:
Montmorency—CharlevoixProvince/Territory:
Québec-
Population:
101,119 -
Area:
11,282 km² -
Population density:
9.00/km² -
Population change:
n/a -
Average age:
44 -
Average income:
$53,800 -
Voter turnout:
72%
Language spoken most often at home:
-
English:
625 -
French:
97,905 -
Indigenous language:
0 -
Most popular other language:
-
Spanish:
160
-
-
All others:
360
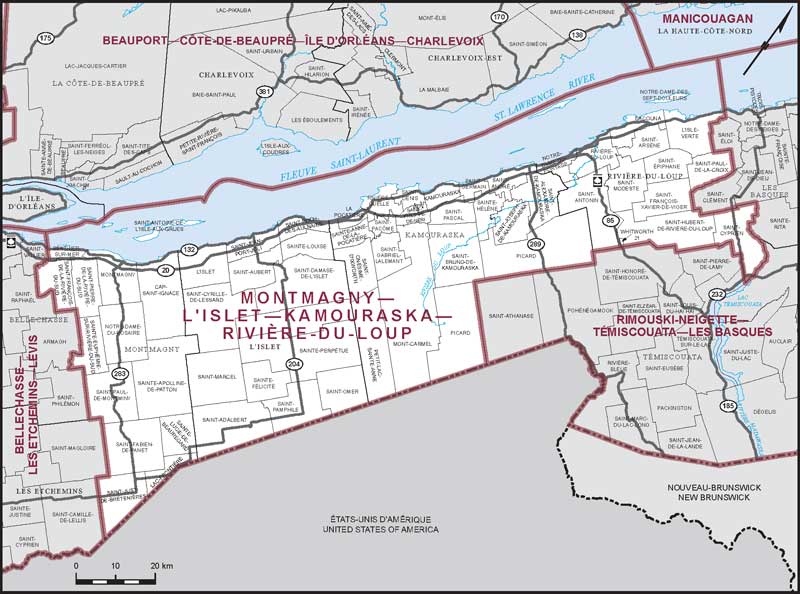
-
-
Electoral District:
Longueuil—Charles-LeMoyneProvince/Territory:
Québec-
Population:
112,257 -
Area:
37 km² -
Population density:
3,034.00/km² -
Population change:
n/a -
Average age:
41 -
Average income:
$44,240 -
Voter turnout:
63%
Language spoken most often at home:
-
English:
11,910 -
French:
79,835 -
Indigenous language:
0 -
Most popular other language:
-
Spanish:
3,745
-
-
All others:
9,210
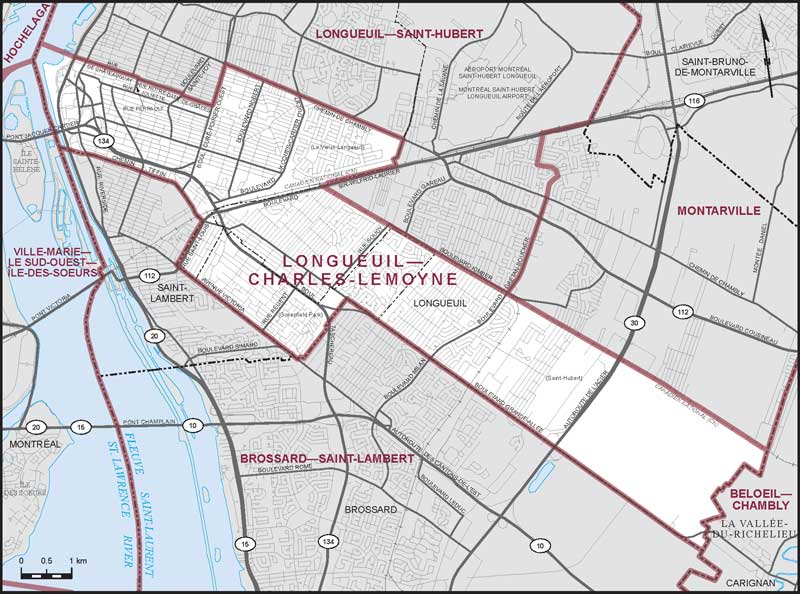
-
-
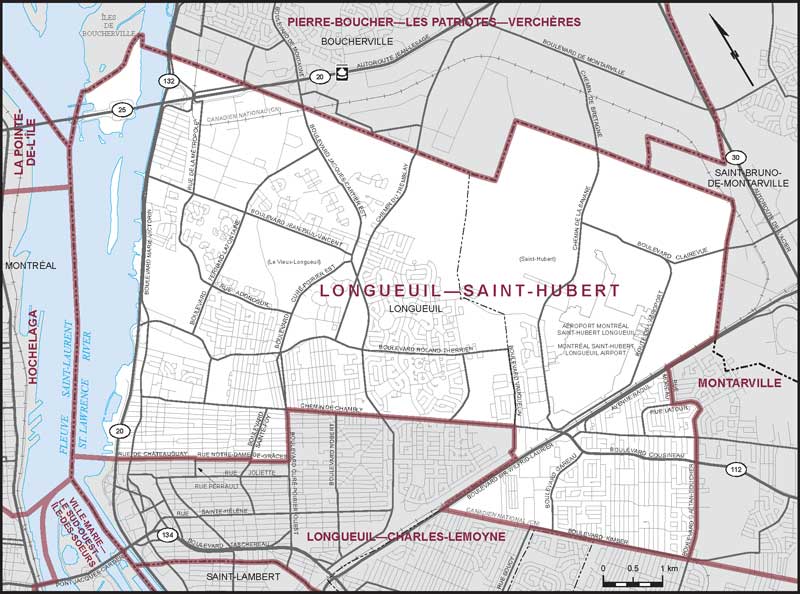
Electoral District:
Longueuil—Saint-HubertProvince/Territory:
Québec-
Population:
115,082 -
Area:
55 km² -
Population density:
2,092.00/km² -
Population change:
n/a -
Average age:
43 -
Average income:
$52,400 -
Voter turnout:
70%
Language spoken most often at home:
-
English:
5,235 -
French:
92,425 -
Indigenous language:
0 -
Most popular other language:
-
Spanish:
3,320
-
-
All others:
6,655
-
-
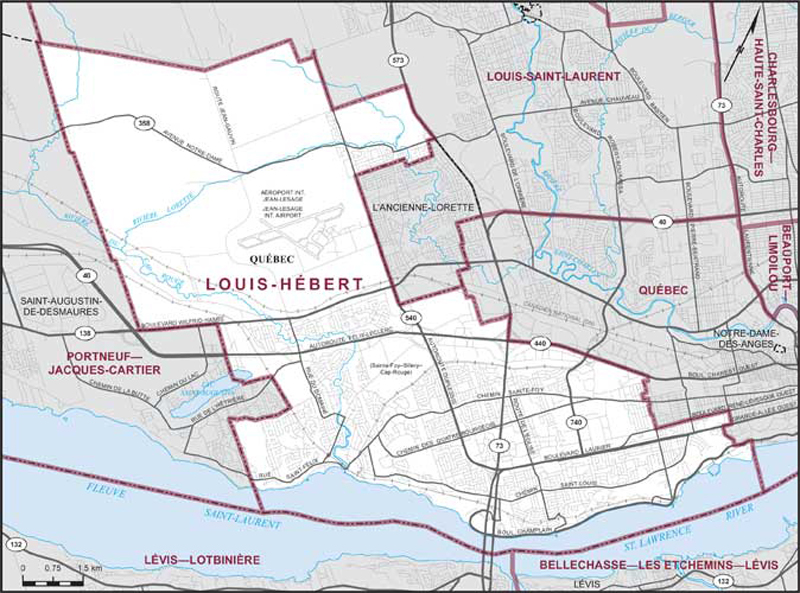
Electoral District:
Louis-HébertProvince/Territory:
Québec-
Population:
106,117 -
Area:
92 km² -
Population density:
1,153.00/km² -
Population change:
n/a -
Average age:
44 -
Average income:
$59,600 -
Voter turnout:
77%
Language spoken most often at home:
-
English:
1,895 -
French:
93,430 -
Indigenous language:
35 -
Most popular other language:
-
Spanish:
1,700
-
-
All others:
4,555
-
-
Electoral District:
Marc-Aurèle-FortinProvince/Territory:
Québec-
Population:
104,636 -
Area:
53 km² -
Population density:
1,974.00/km² -
Population change:
n/a -
Average age:
40 -
Average income:
$55,050 -
Voter turnout:
70%
Language spoken most often at home:
-
English:
11,180 -
French:
71,270 -
Indigenous language:
5 -
Most popular other language:
-
Arabic:
3,570
-
-
All others:
9,735
-
-
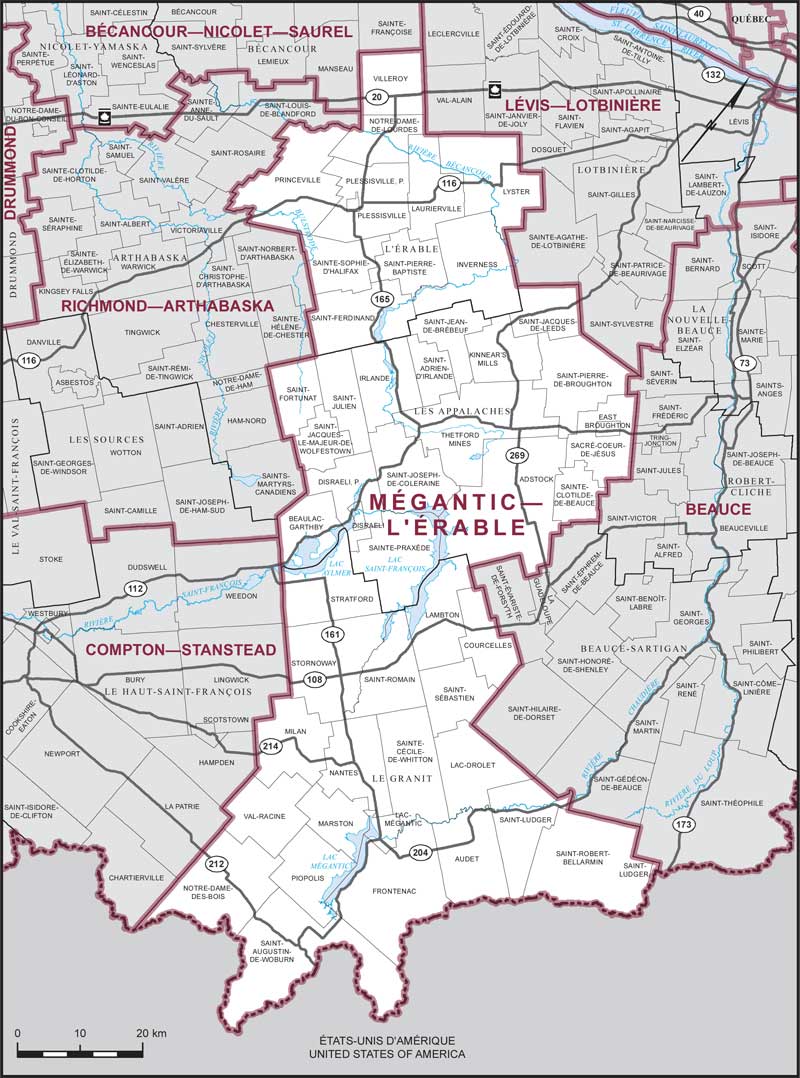
Electoral District:
Mégantic—L'Érable—LotbinièreProvince/Territory:
Québec-
Population:
103,114 -
Area:
6,898 km² -
Population density:
15.00/km² -
Population change:
n/a -
Average age:
47 -
Average income:
$42,000 -
Voter turnout:
70%
Language spoken most often at home:
-
English:
825 -
French:
99,335 -
Indigenous language:
0 -
Most popular other language:
-
Spanish:
550
-
-
All others:
375
-
-
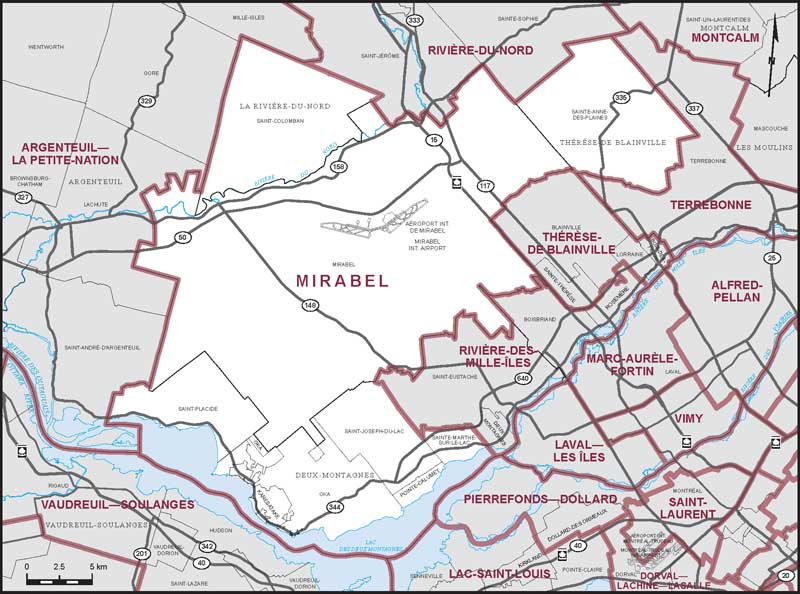
Electoral District:
MirabelProvince/Territory:
Québec-
Population:
100,598 -
Area:
669 km² -
Population density:
150.00/km² -
Population change:
n/a -
Average age:
38 -
Average income:
$53,250 -
Voter turnout:
69%
Language spoken most often at home:
-
English:
3,475 -
French:
92,150 -
Indigenous language:
0 -
Most popular other language:
-
Spanish:
595
-
-
All others:
1,840
-
-
Electoral District:
Mount RoyalProvince/Territory:
Québec-
Population:
112,706 -
Area:
23 km² -
Population density:
4,900.00/km² -
Population change:
n/a -
Average age:
41 -
Average income:
$63,500 -
Voter turnout:
66%
Language spoken most often at home:
-
English:
46,555 -
French:
25,820 -
Indigenous language:
0 -
Most popular other language:
-
Tagalog (Pilipino, Filipino):
3,995
-
-
All others:
23,700
-
-
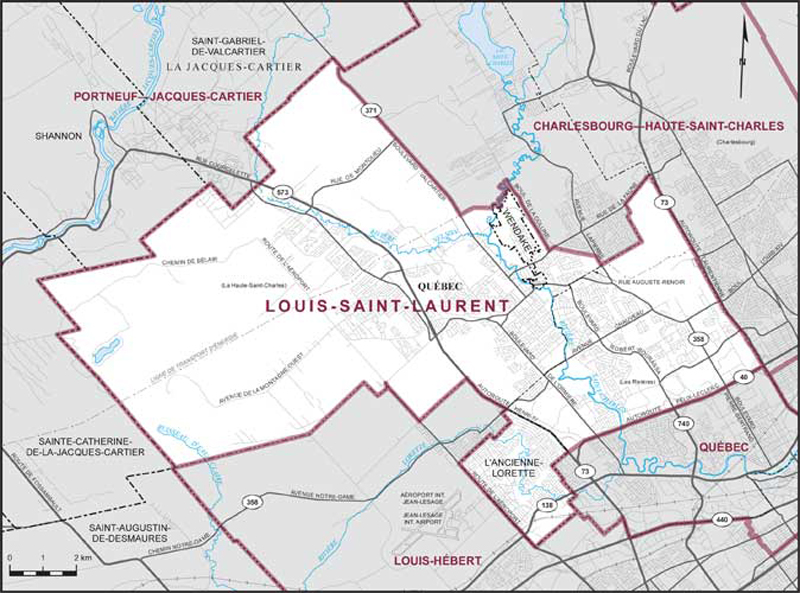
Electoral District:
Louis-Saint-Laurent—AkiawenhrahkProvince/Territory:
Québec-
Population:
113,220 -
Area:
125 km² -
Population density:
906.00/km² -
Population change:
n/a -
Average age:
43 -
Average income:
$54,500 -
Voter turnout:
73%
Language spoken most often at home:
-
English:
1,175 -
French:
107,150 -
Indigenous language:
120 -
Most popular other language:
-
Spanish:
755
-
-
All others:
1,300
-
-
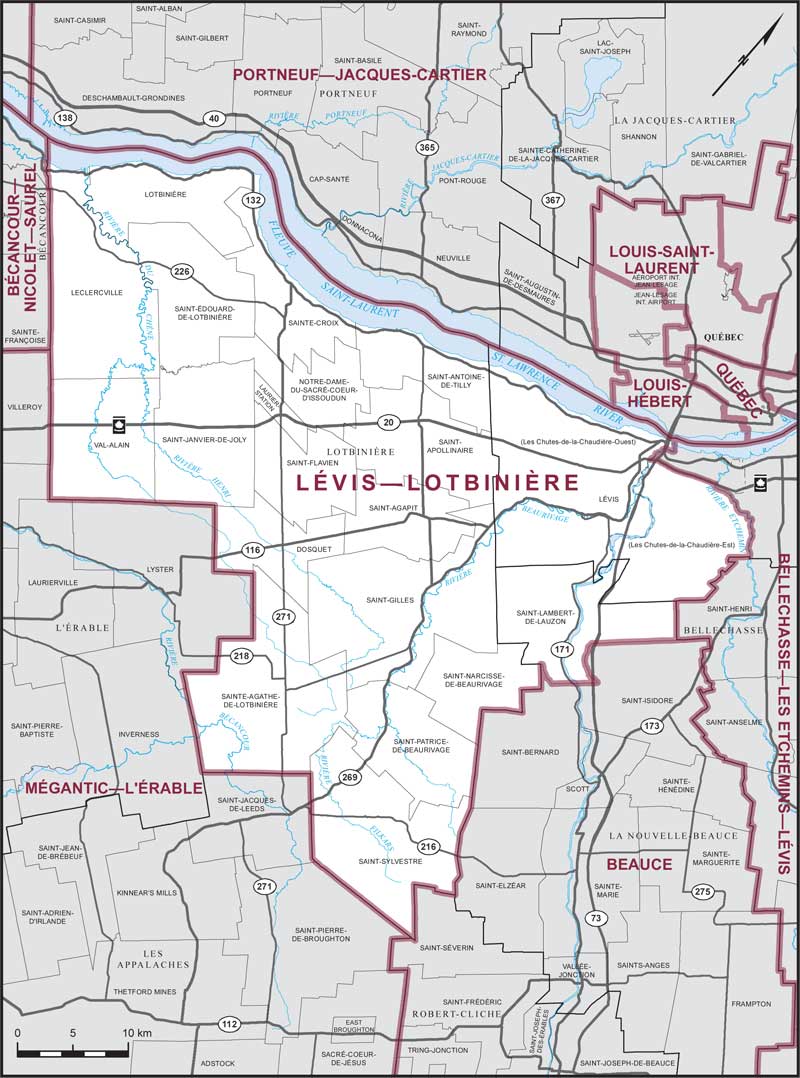
Electoral District:
Lévis—LotbinièreProvince/Territory:
Québec-
Population:
112,830 -
Area:
1,106 km² -
Population density:
102.00/km² -
Population change:
n/a -
Average age:
41 -
Average income:
$56,300 -
Voter turnout:
77%
Language spoken most often at home:
-
English:
875 -
French:
109,165 -
Indigenous language:
0 -
Most popular other language:
-
Spanish:
355
-
-
All others:
540
-

