Federal Electoral District Fact Sheets
-
Electoral District:
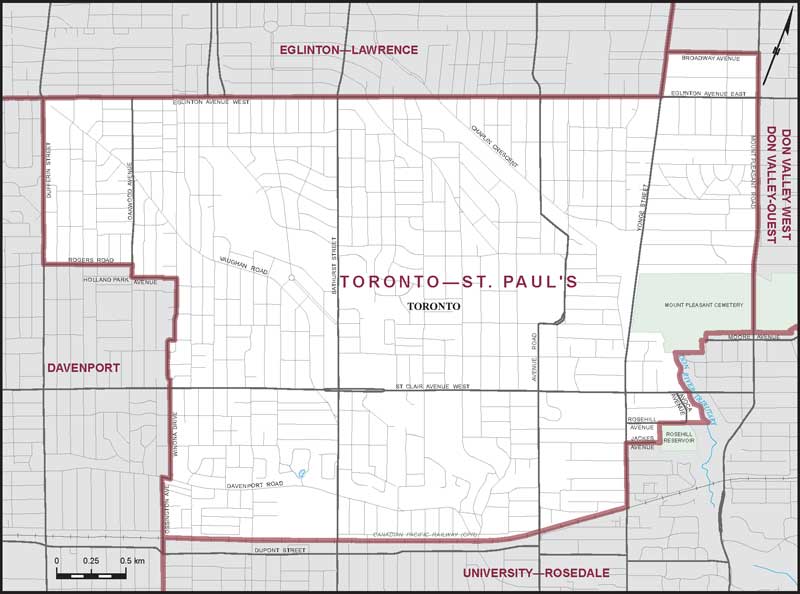
Taiaiako’n—Parkdale—High ParkProvince/Territory:
Ontario-
Population:
117,873 -
Area:
17 km² -
Population density:
6,934.00/km² -
Population change:
n/a -
Average age:
41 -
Average income:
$70,700 -
Voter turnout:
71%
Language spoken most often at home:
-
English:
93,935 -
French:
960 -
Indigenous language:
5 -
Most popular other language:
-
Spanish:
1,525
-
-
All others:
14,775
-
-
Electoral District:
Sudbury East—Manitoulin—Nickel BeltProvince/Territory:
Ontario-
Population:
99,827 -
Area:
32,305 km² -
Population density:
3.00/km² -
Population change:
n/a -
Average age:
45 -
Average income:
$51,300 -
Voter turnout:
70%
Language spoken most often at home:
-
English:
76,965 -
French:
18,350 -
Indigenous language:
425 -
Most popular other language:
-
German:
120
-
-
All others:
470
-
-
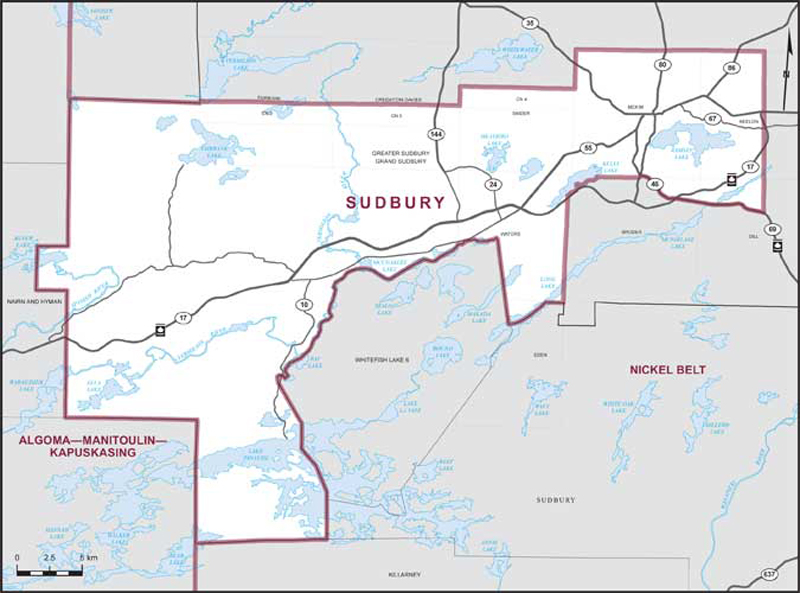
Electoral District:
SudburyProvince/Territory:
Ontario-
Population:
114,384 -
Area:
912 km² -
Population density:
125.00/km² -
Population change:
n/a -
Average age:
43 -
Average income:
$55,050 -
Voter turnout:
69%
Language spoken most often at home:
-
English:
97,645 -
French:
7,865 -
Indigenous language:
35 -
Most popular other language:
-
Italian:
530
-
-
All others:
3,470
-
-
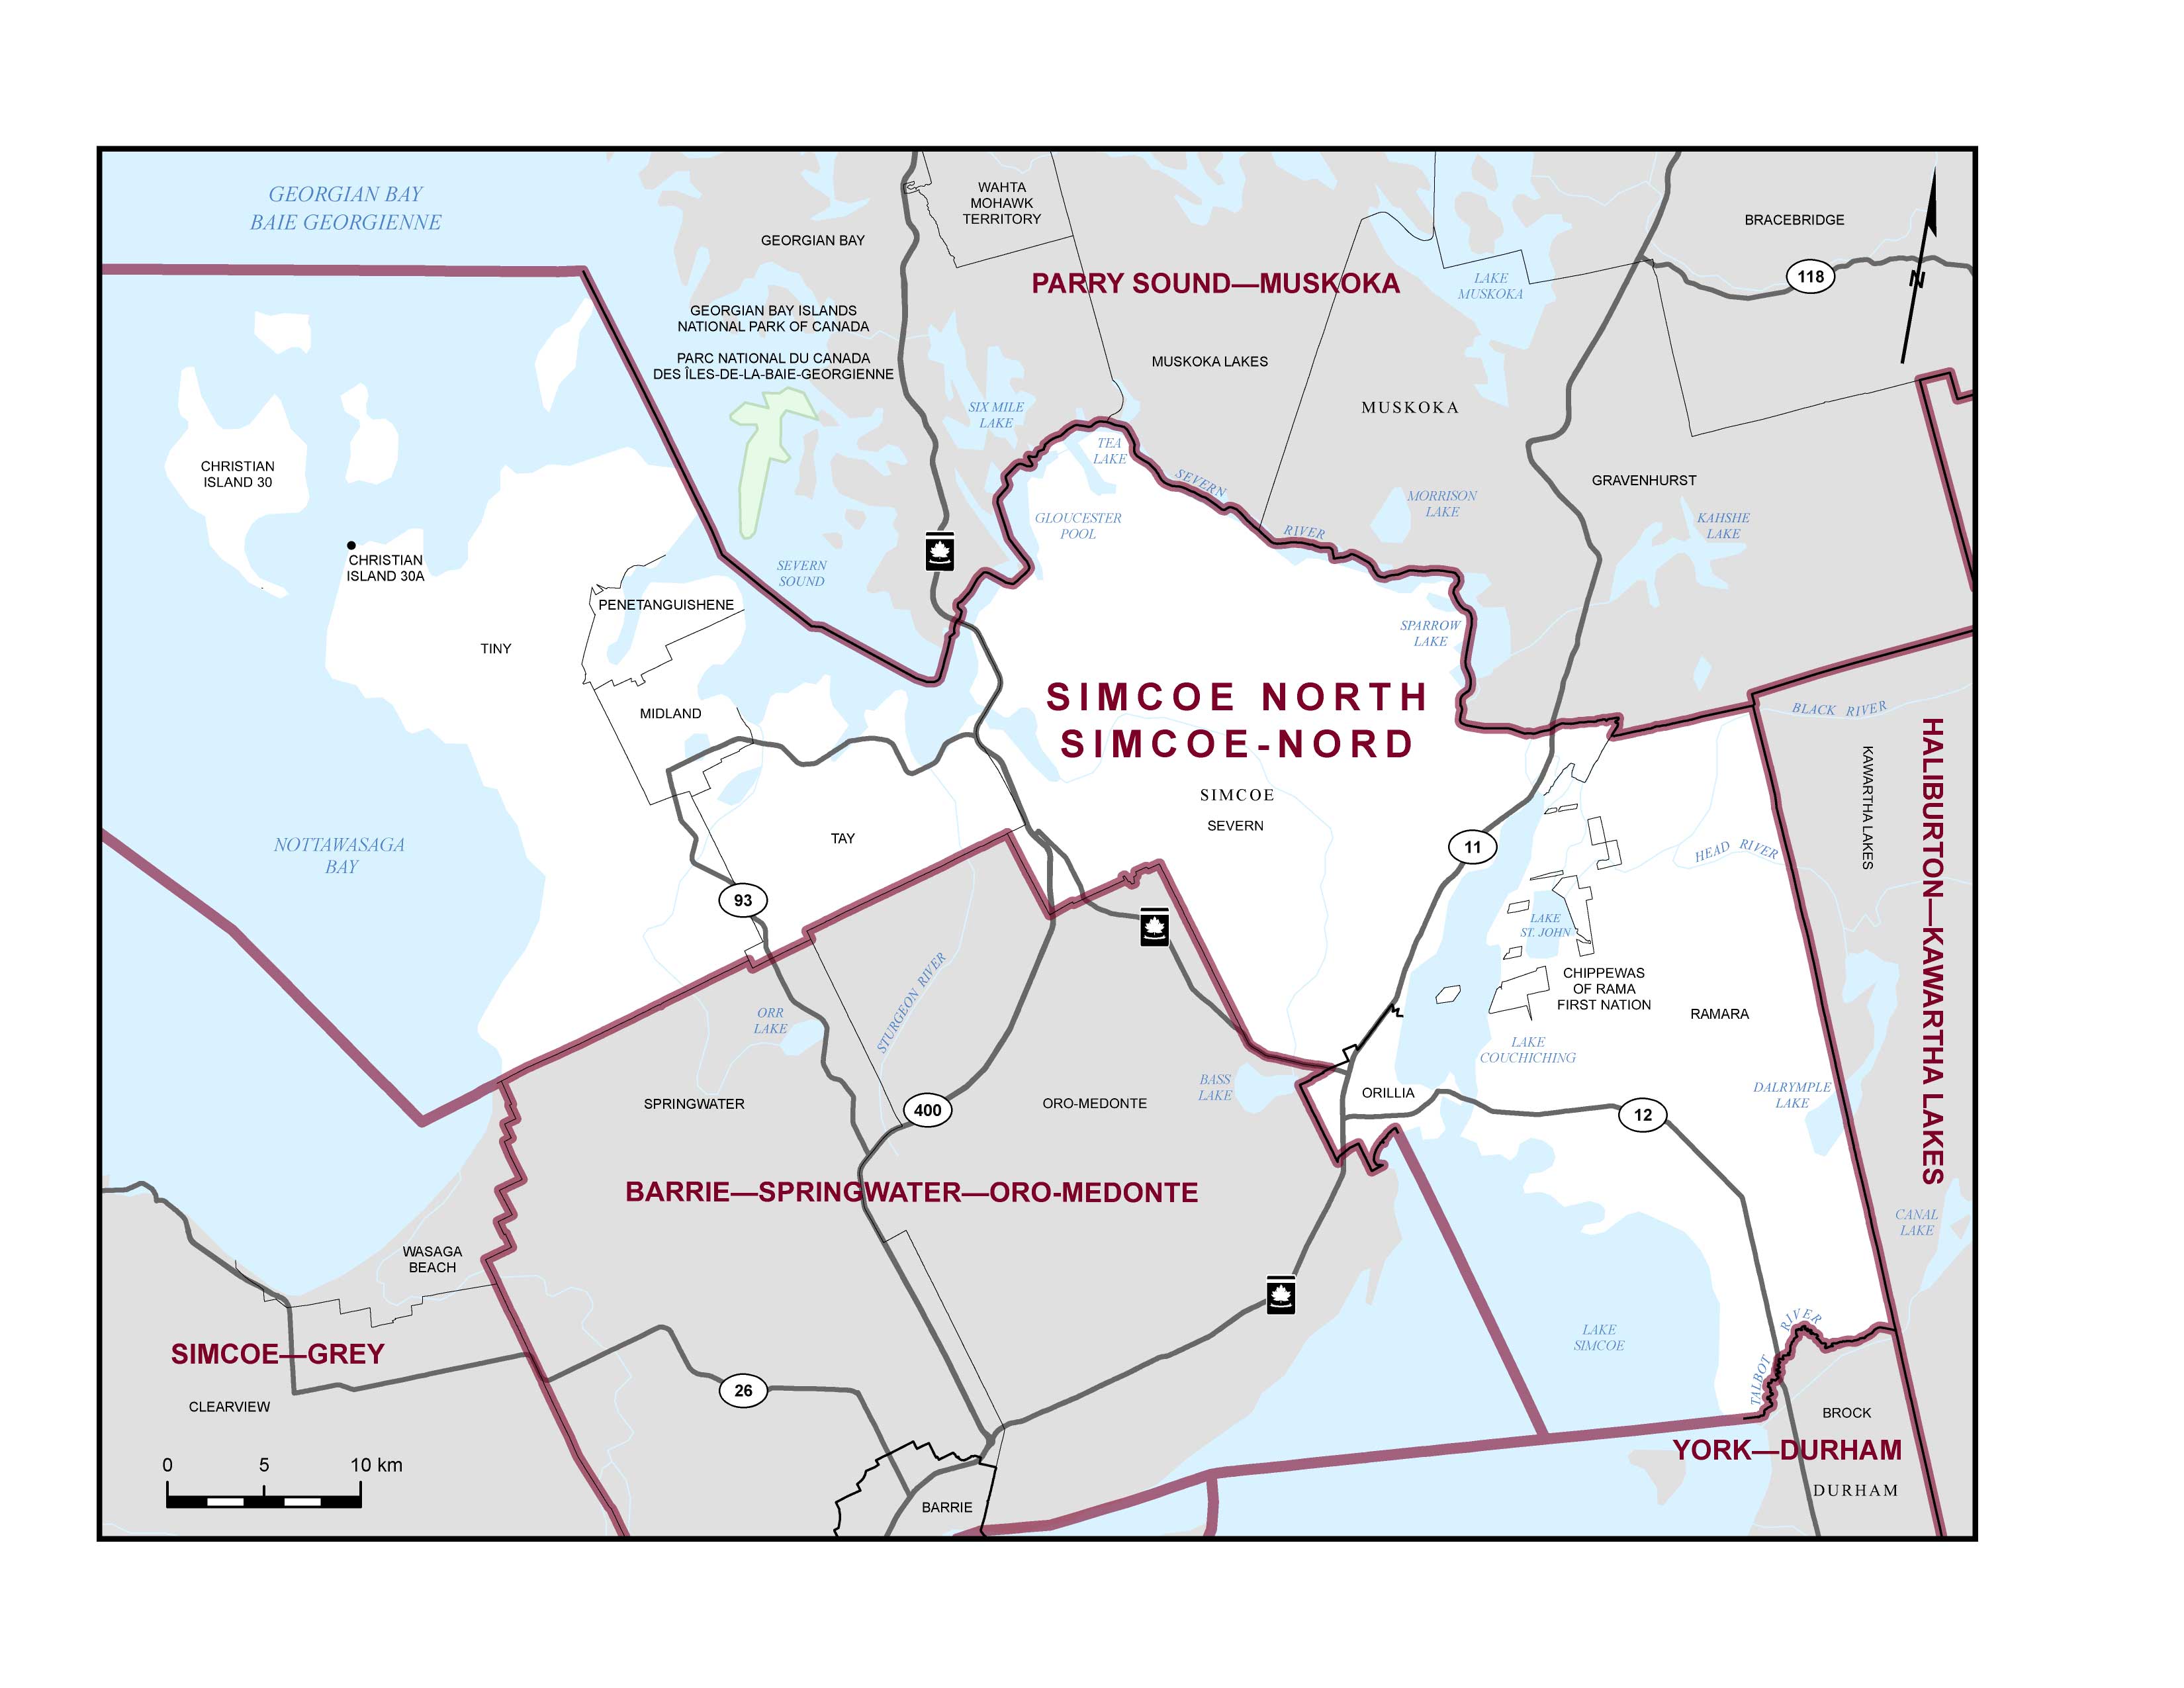
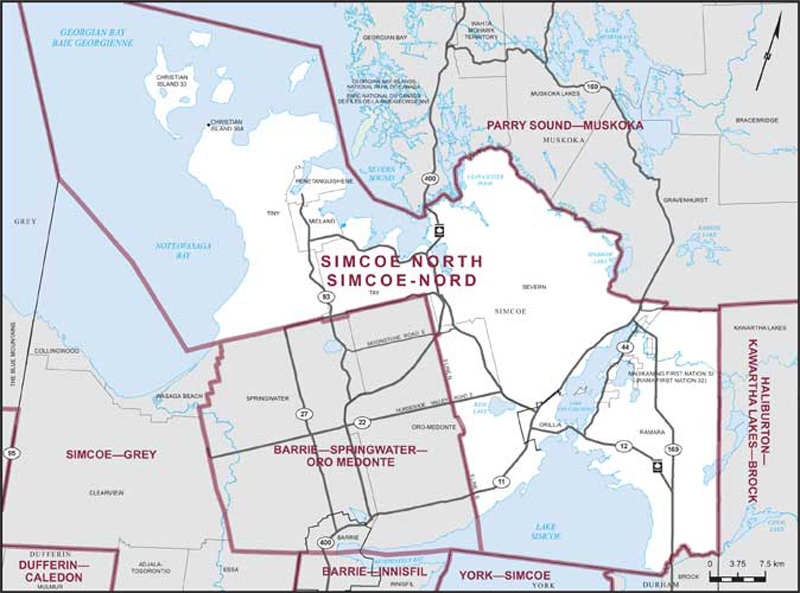
Electoral District:
Simcoe NorthProvince/Territory:
Ontario-
Population:
112,022 -
Area:
1,563 km² -
Population density:
72.00/km² -
Population change:
n/a -
Average age:
47 -
Average income:
$48,040 -
Voter turnout:
69%
Language spoken most often at home:
-
English:
106,010 -
French:
700 -
Indigenous language:
25 -
Most popular other language:
-
Polish:
210
-
-
All others:
1,840
-
-
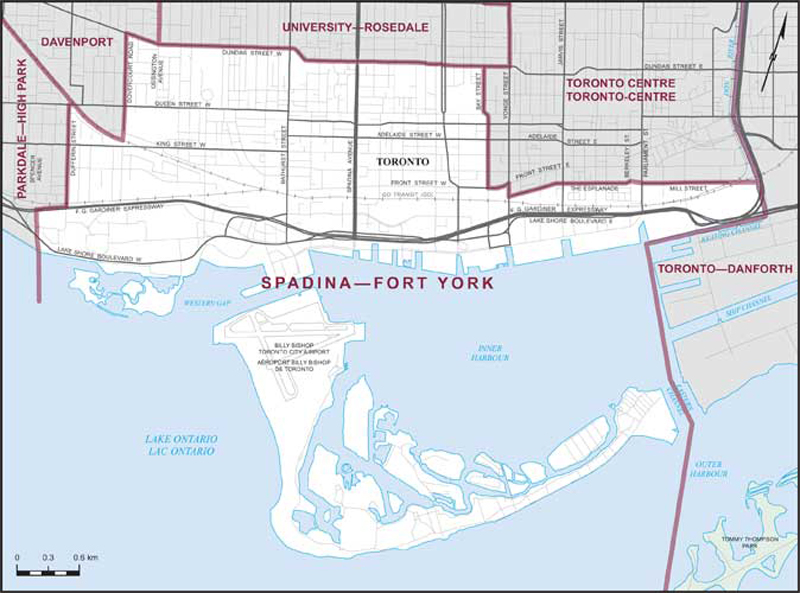
Electoral District:
Spadina—HarbourfrontProvince/Territory:
Ontario-
Population:
105,739 -
Area:
10 km² -
Population density:
10,574.00/km² -
Population change:
n/a -
Average age:
36 -
Average income:
$82,300 -
Voter turnout:
65%
Language spoken most often at home:
-
English:
82,835 -
French:
1,120 -
Indigenous language:
0 -
Most popular other language:
-
Mandarin:
3,655
-
-
All others:
11,785
-
-
Electoral District:
St. CatharinesProvince/Territory:
Ontario-
Population:
119,873 -
Area:
62 km² -
Population density:
1,933.00/km² -
Population change:
n/a -
Average age:
45 -
Average income:
$47,240 -
Voter turnout:
69%
Language spoken most often at home:
-
English:
105,810 -
French:
630 -
Indigenous language:
5 -
Most popular other language:
-
Spanish:
1,590
-
-
All others:
7,170
-
-
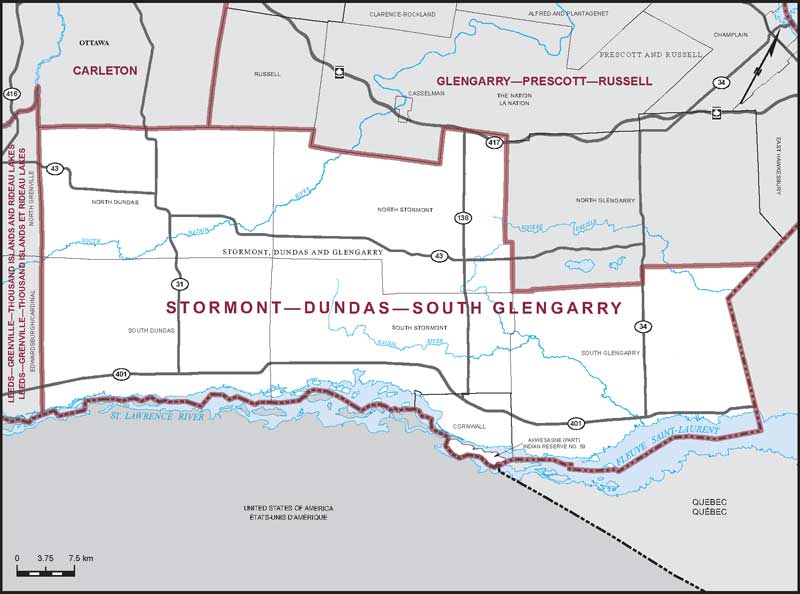
Electoral District:
Stormont—Dundas—GlengarryProvince/Territory:
Ontario-
Population:
114,637 -
Area:
3,309 km² -
Population density:
35.00/km² -
Population change:
n/a -
Average age:
45 -
Average income:
$46,960 -
Voter turnout:
69%
Language spoken most often at home:
-
English:
96,770 -
French:
10,700 -
Indigenous language:
15 -
Most popular other language:
-
Urdu:
595
-
-
All others:
2,055
-
-
Electoral District:
Simcoe—GreyProvince/Territory:
Ontario-
Population:
107,836 -
Area:
1,583 km² -
Population density:
68.00/km² -
Population change:
n/a -
Average age:
46 -
Average income:
$56,900 -
Voter turnout:
71%
Language spoken most often at home:
-
English:
102,120 -
French:
835 -
Indigenous language:
5 -
Most popular other language:
-
Polish:
355
-
-
All others:
2,560
-
-
Electoral District:
Scarborough—WoburnProvince/Territory:
Ontario-
Population:
110,589 -
Area:
24 km² -
Population density:
4,608.00/km² -
Population change:
n/a -
Average age:
40 -
Average income:
$40,240 -
Voter turnout:
59%
Language spoken most often at home:
-
English:
61,585 -
French:
515 -
Indigenous language:
0 -
Most popular other language:
-
Tamil:
7,115
-
-
All others:
28,760
-
-
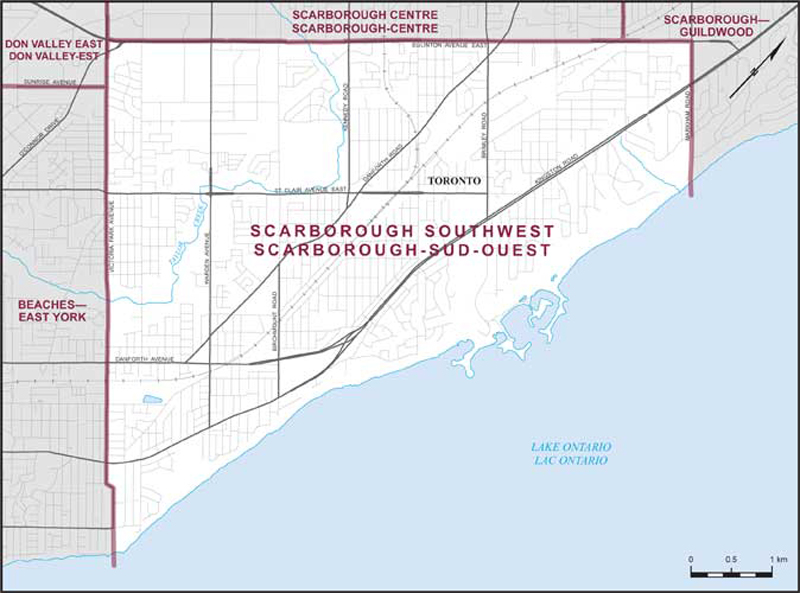
Electoral District:
Scarborough SouthwestProvince/Territory:
Ontario-
Population:
123,232 -
Area:
30 km² -
Population density:
4,108.00/km² -
Population change:
n/a -
Average age:
41 -
Average income:
$48,560 -
Voter turnout:
63%
Language spoken most often at home:
-
English:
81,060 -
French:
690 -
Indigenous language:
5 -
Most popular other language:
-
Bengali:
6,605
-
-
All others:
22,585
-
-
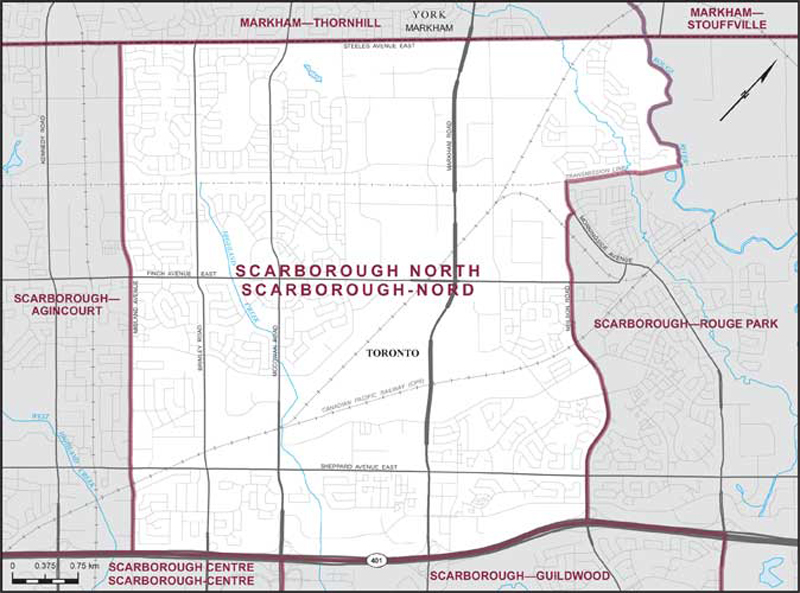
Electoral District:
Scarborough NorthProvince/Territory:
Ontario-
Population:
116,177 -
Area:
34 km² -
Population density:
3,417.00/km² -
Population change:
n/a -
Average age:
43 -
Average income:
$38,680 -
Voter turnout:
60%
Language spoken most often at home:
-
English:
51,325 -
French:
315 -
Indigenous language:
0 -
Most popular other language:
-
Yue (Cantonese):
17,790
-
-
All others:
34,345
-
-
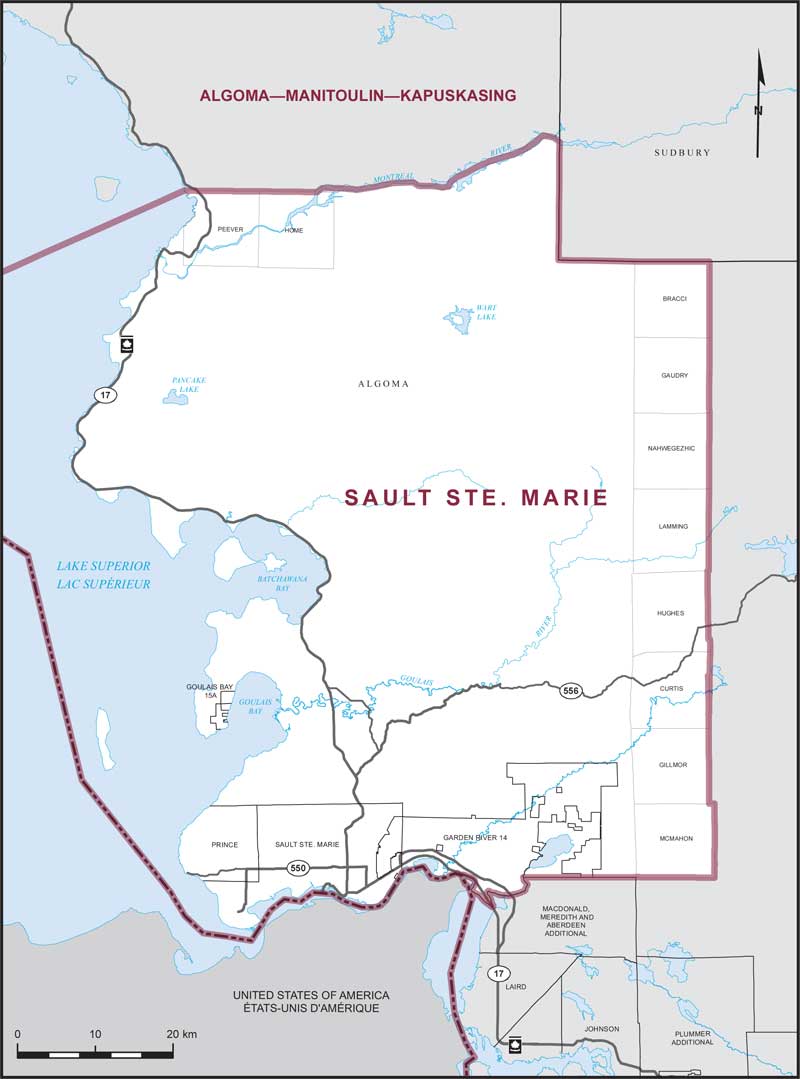
Electoral District:
Sault Ste. Marie—AlgomaProvince/Territory:
Ontario-
Population:
113,772 -
Area:
39,504 km² -
Population density:
3.00/km² -
Population change:
n/a -
Average age:
46 -
Average income:
$48,160 -
Voter turnout:
68%
Language spoken most often at home:
-
English:
106,910 -
French:
1,955 -
Indigenous language:
130 -
Most popular other language:
-
Italian:
655
-
-
All others:
1,860
-
-
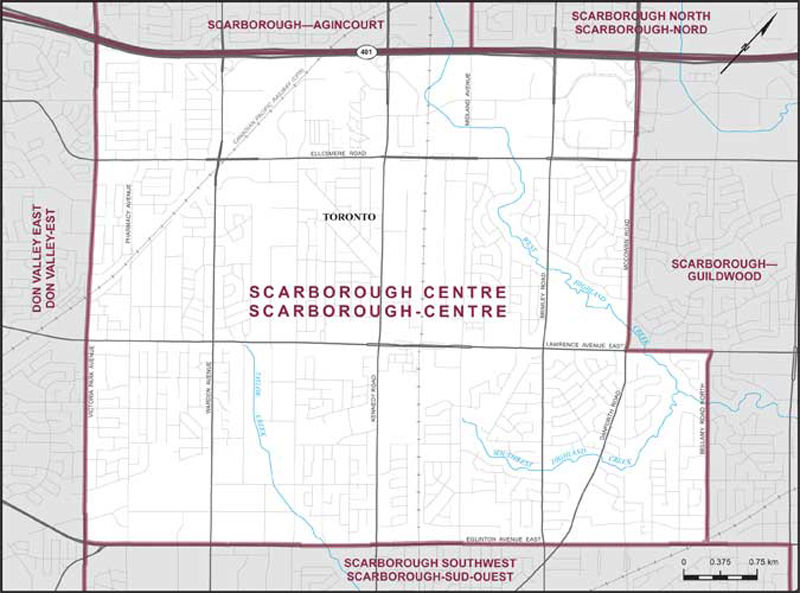
Electoral District:
Scarborough Centre—Don Valley EastProvince/Territory:
Ontario-
Population:
111,377 -
Area:
30 km² -
Population density:
3,713.00/km² -
Population change:
n/a -
Average age:
42 -
Average income:
$45,440 -
Voter turnout:
62%
Language spoken most often at home:
-
English:
67,460 -
French:
625 -
Indigenous language:
0 -
Most popular other language:
-
Tagalog (Pilipino, Filipino):
3,670
-
-
All others:
27,890
-
-
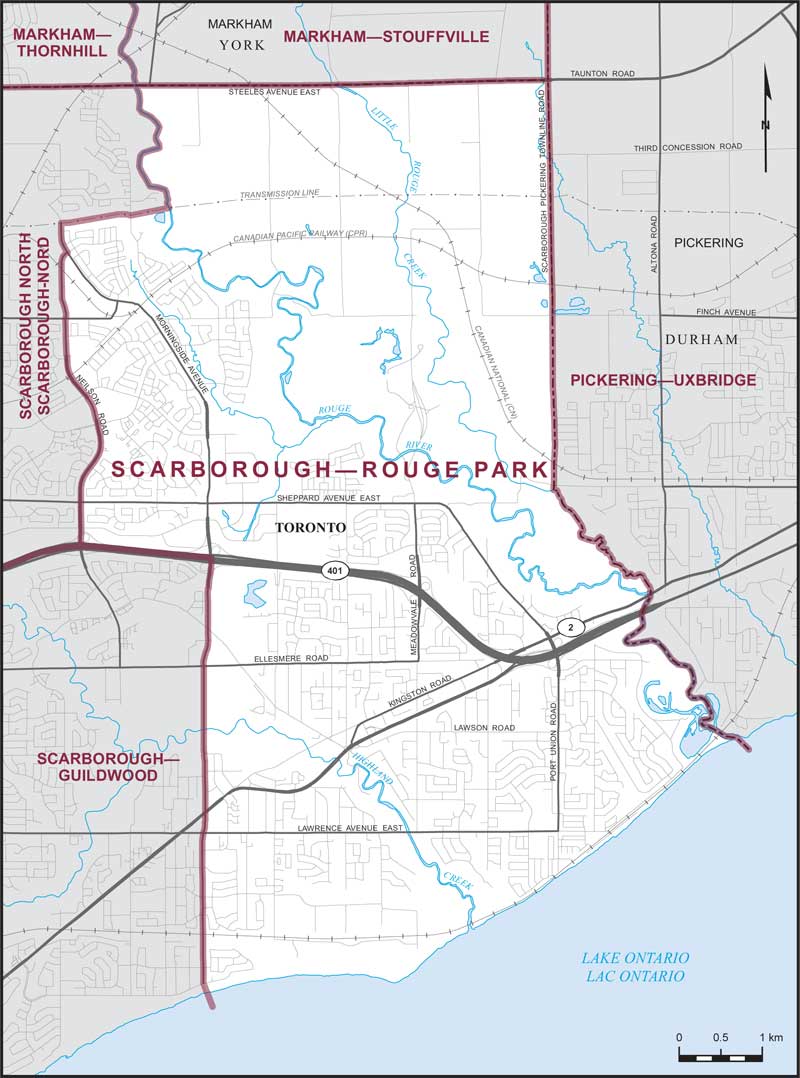
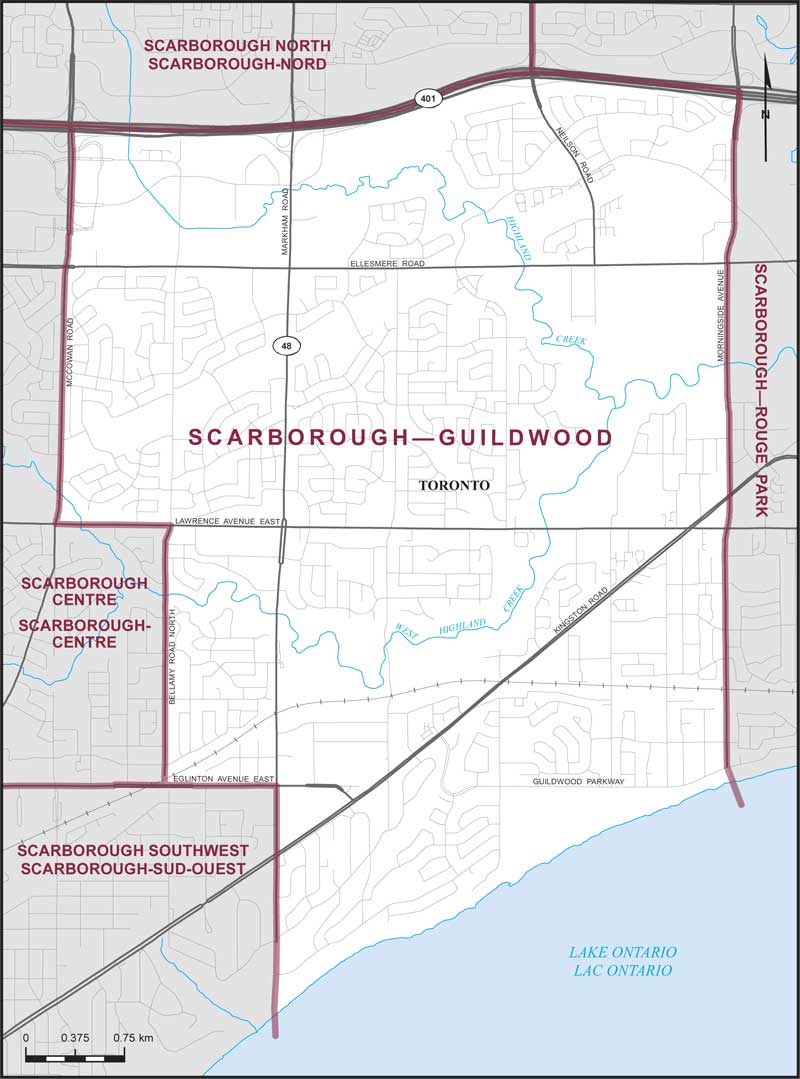
Electoral District:
Scarborough—Guildwood—Rouge ParkProvince/Territory:
Ontario-
Population:
114,100 -
Area:
59 km² -
Population density:
1,934.00/km² -
Population change:
n/a -
Average age:
42 -
Average income:
$48,800 -
Voter turnout:
65%
Language spoken most often at home:
-
English:
79,135 -
French:
560 -
Indigenous language:
0 -
Most popular other language:
-
Tamil:
7,245
-
-
All others:
17,580
-
-
Electoral District:
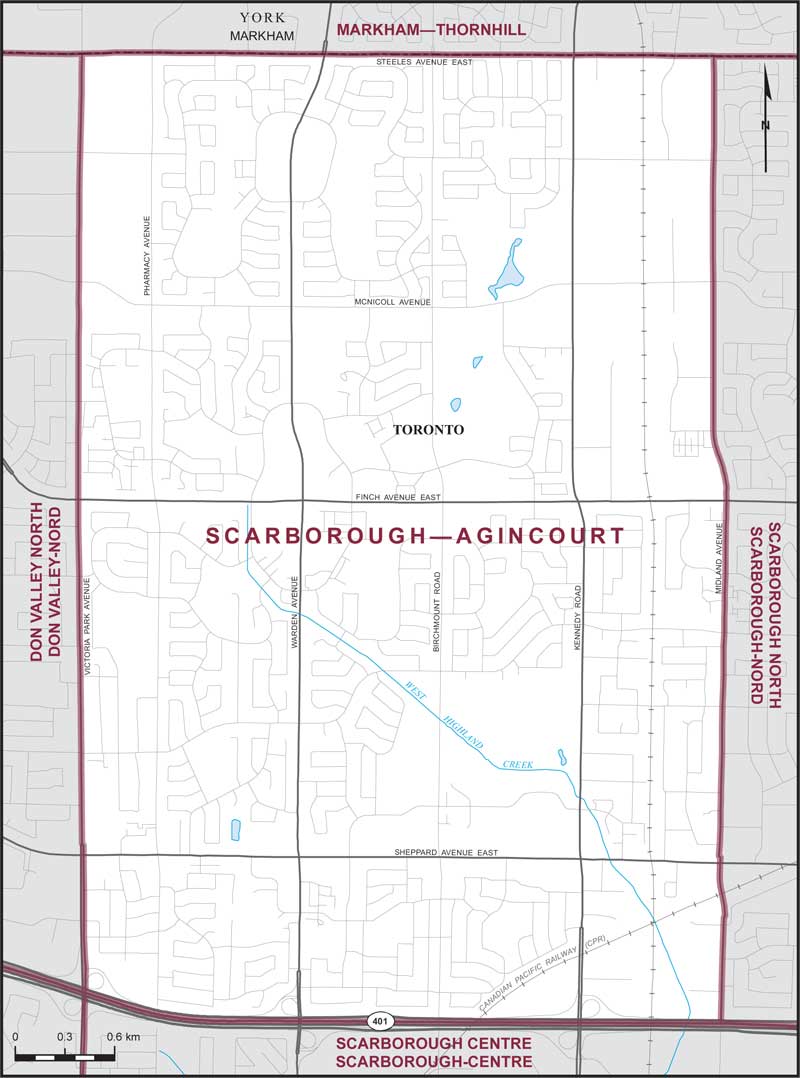
Scarborough—AgincourtProvince/Territory:
Ontario-
Population:
123,969 -
Area:
27 km² -
Population density:
4,591.00/km² -
Population change:
n/a -
Average age:
45 -
Average income:
$42,440 -
Voter turnout:
61%
Language spoken most often at home:
-
English:
55,170 -
French:
410 -
Indigenous language:
0 -
Most popular other language:
-
Mandarin:
18,170
-
-
All others:
38,705
-
-
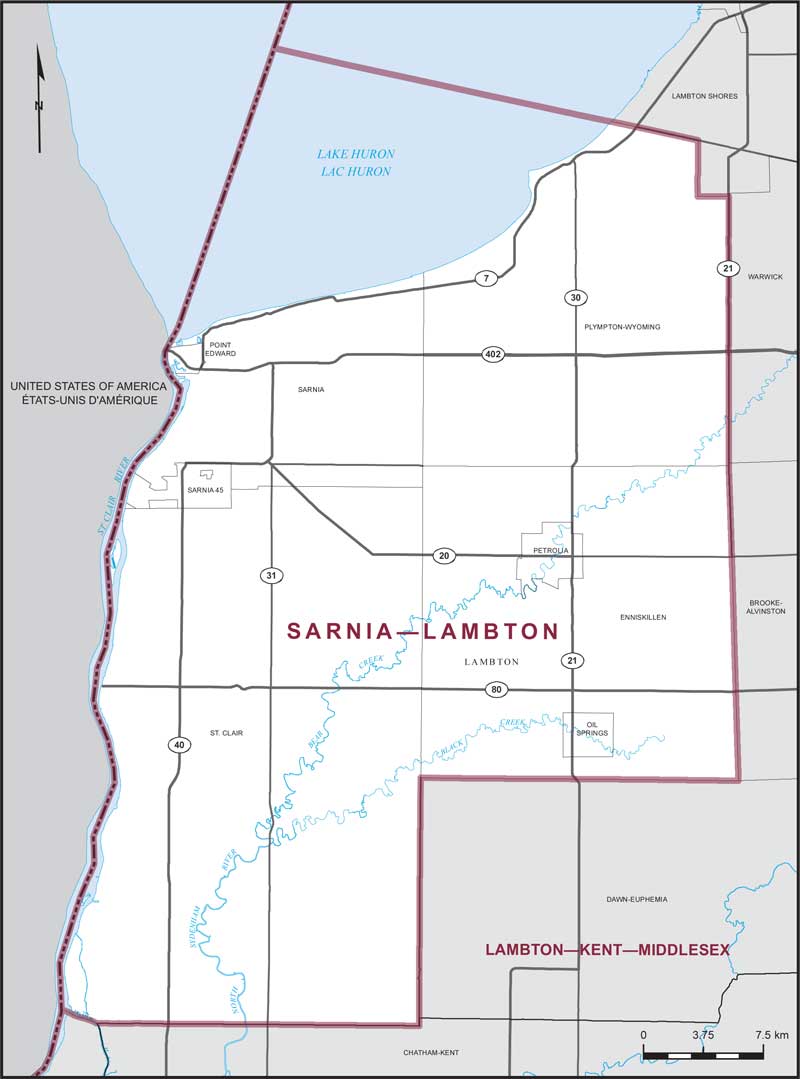
Electoral District:
Sarnia—Lambton—BkejwanongProvince/Territory:
Ontario-
Population:
128,154 -
Area:
3,000 km² -
Population density:
43.00/km² -
Population change:
n/a -
Average age:
45 -
Average income:
$54,550 -
Voter turnout:
72%
Language spoken most often at home:
-
English:
122,240 -
French:
435 -
Indigenous language:
35 -
Most popular other language:
-
Spanish:
355
-
-
All others:
2,615
-