Federal Electoral District Fact Sheets
-
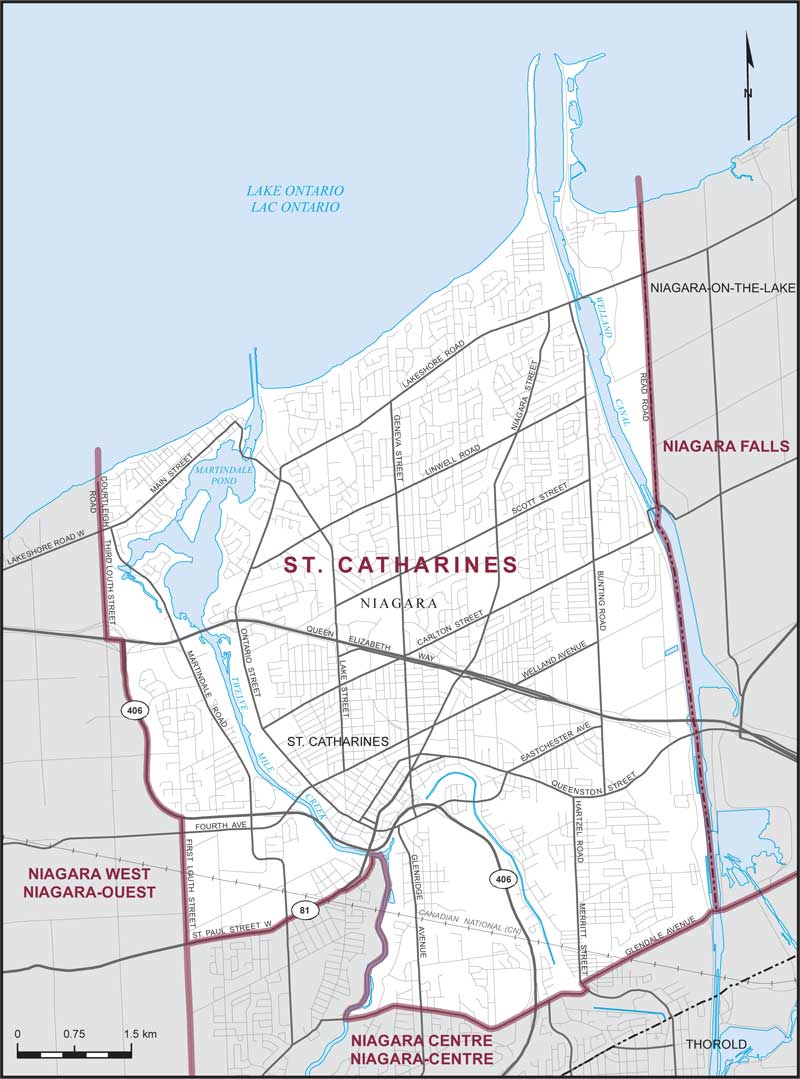
Electoral District:
Richmond Hill SouthProvince/Territory:
Ontario-
Population:
124,748 -
Area:
44 km² -
Population density:
2,835.00/km² -
Population change:
n/a -
Average age:
44 -
Average income:
$54,950 -
Voter turnout:
63%
Language spoken most often at home:
-
English:
60,855 -
French:
240 -
Indigenous language:
0 -
Most popular other language:
-
Yue (Cantonese):
13,840
-
-
All others:
38,980
-
-
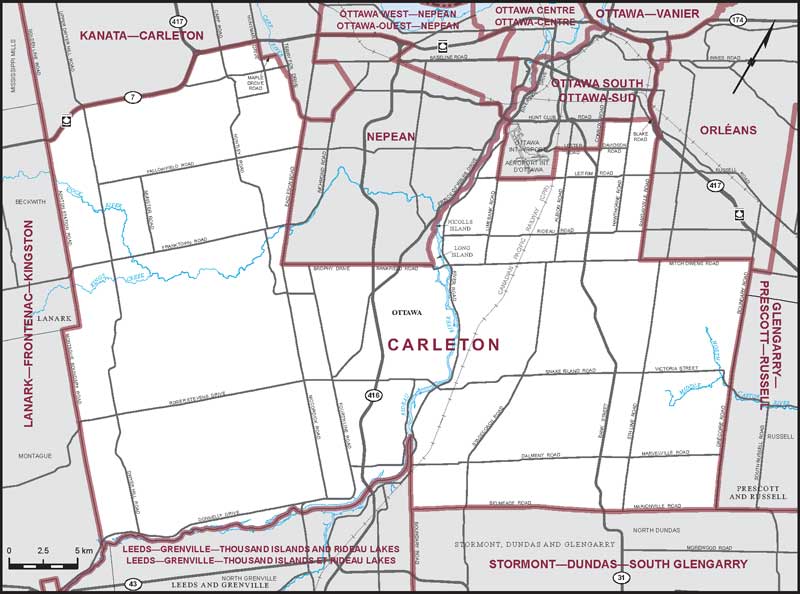
Electoral District:
Prescott—Russell—CumberlandProvince/Territory:
Ontario-
Population:
109,125 -
Area:
2,333 km² -
Population density:
47.00/km² -
Population change:
n/a -
Average age:
43 -
Average income:
$56,100 -
Voter turnout:
76%
Language spoken most often at home:
-
English:
48,240 -
French:
52,760 -
Indigenous language:
5 -
Most popular other language:
-
Spanish:
215
-
-
All others:
1,335
-
-
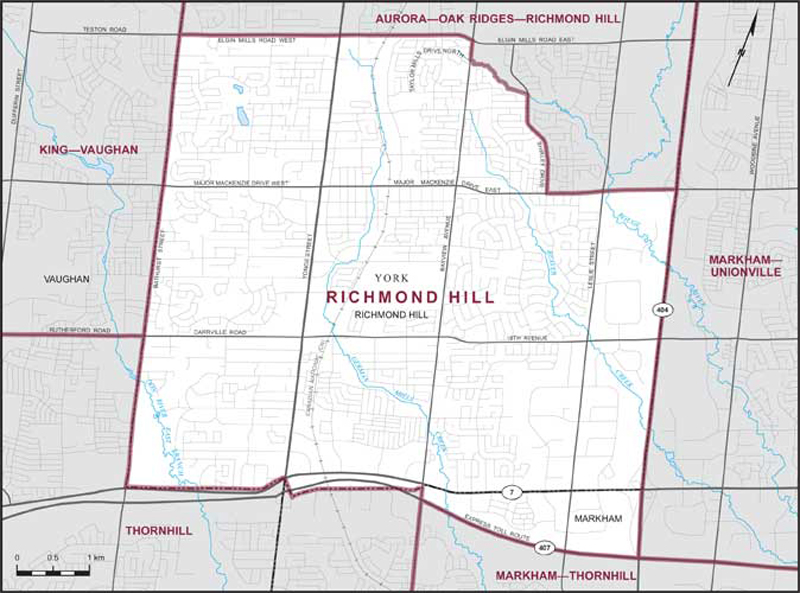
Electoral District:
Pickering—BrooklinProvince/Territory:
Ontario-
Population:
122,430 -
Area:
290 km² -
Population density:
422.00/km² -
Population change:
n/a -
Average age:
40 -
Average income:
$62,750 -
Voter turnout:
70%
Language spoken most often at home:
-
English:
102,515 -
French:
455 -
Indigenous language:
0 -
Most popular other language:
-
Tamil:
2,015
-
-
All others:
11,185
-
-
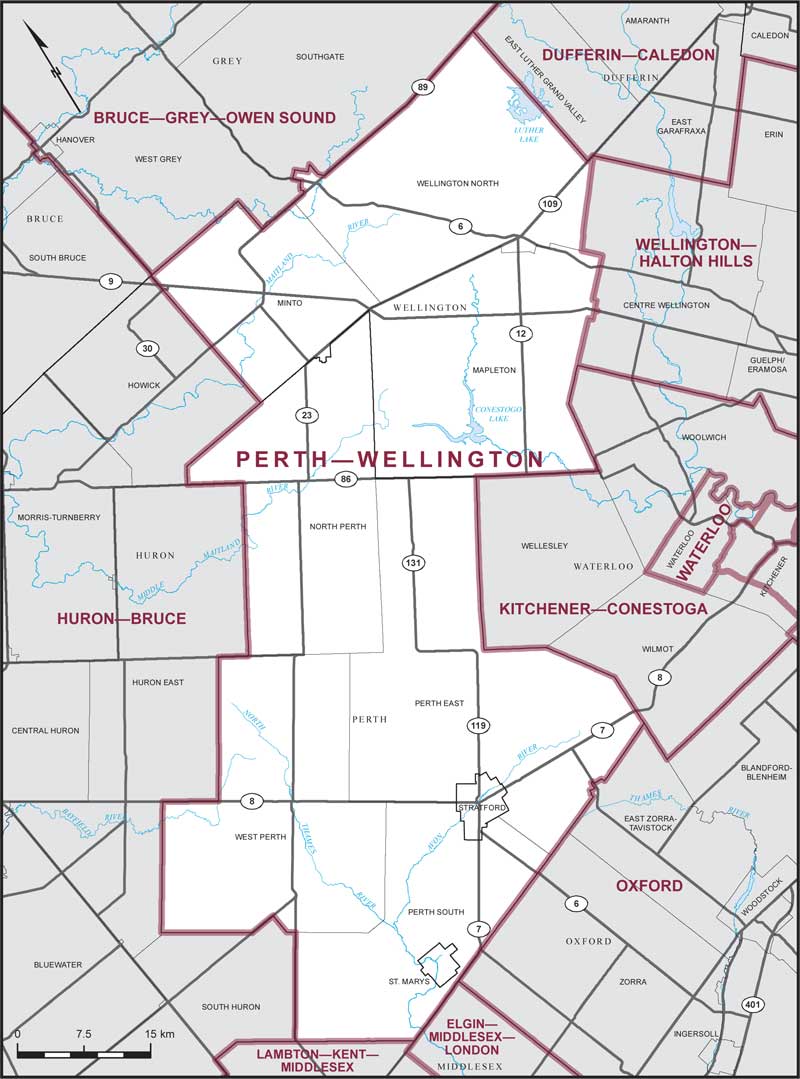
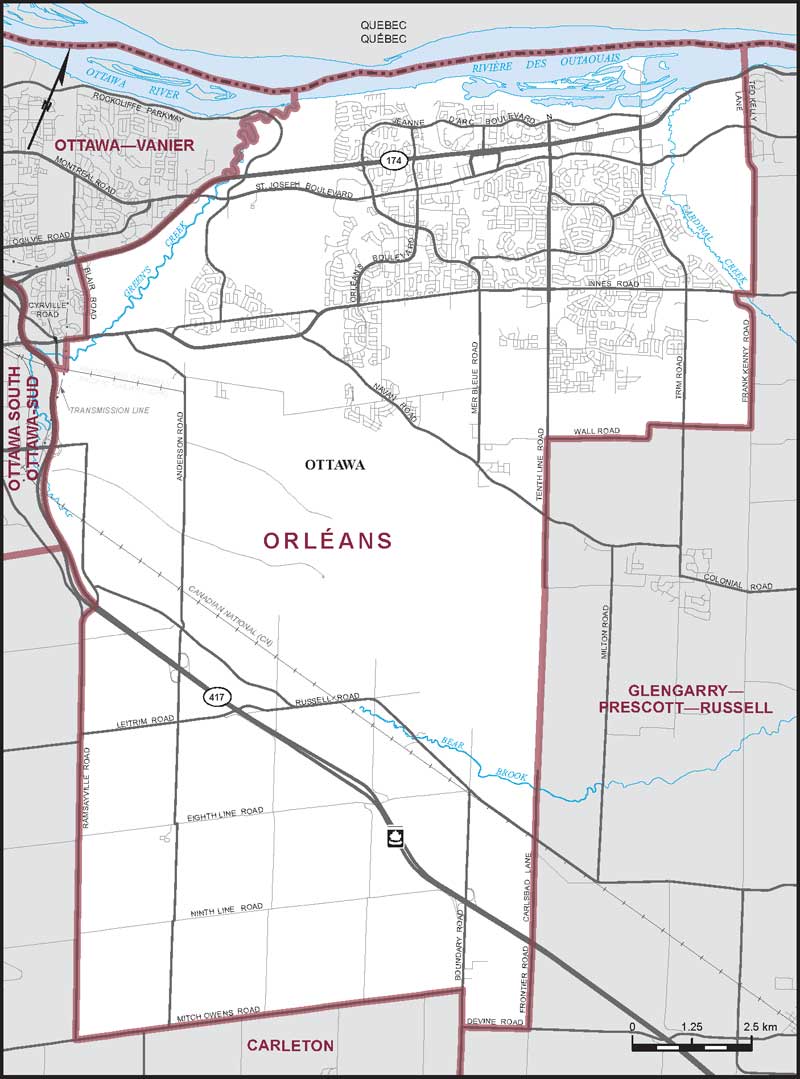
Electoral District:
OxfordProvince/Territory:
Ontario-
Population:
121,781 -
Area:
2,038 km² -
Population density:
60.00/km² -
Population change:
n/a -
Average age:
42 -
Average income:
$50,720 -
Voter turnout:
72%
Language spoken most often at home:
-
English:
113,900 -
French:
230 -
Indigenous language:
0 -
Most popular other language:
-
Punjabi (Panjabi):
1,620
-
-
All others:
3,655
-
-
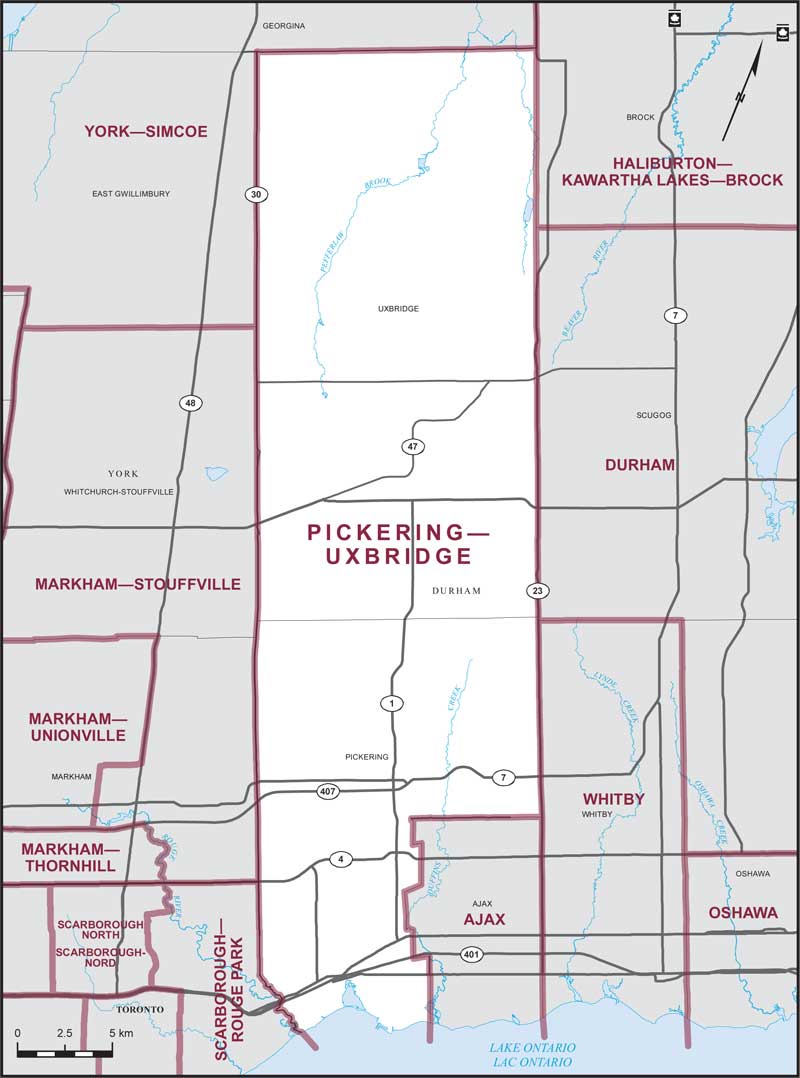
Electoral District:
Perth—WellingtonProvince/Territory:
Ontario-
Population:
113,929 -
Area:
3,580 km² -
Population density:
32.00/km² -
Population change:
n/a -
Average age:
42 -
Average income:
$50,160 -
Voter turnout:
71%
Language spoken most often at home:
-
English:
103,640 -
French:
105 -
Indigenous language:
5 -
Most popular other language:
-
German:
2,585
-
-
All others:
5,010
-
-
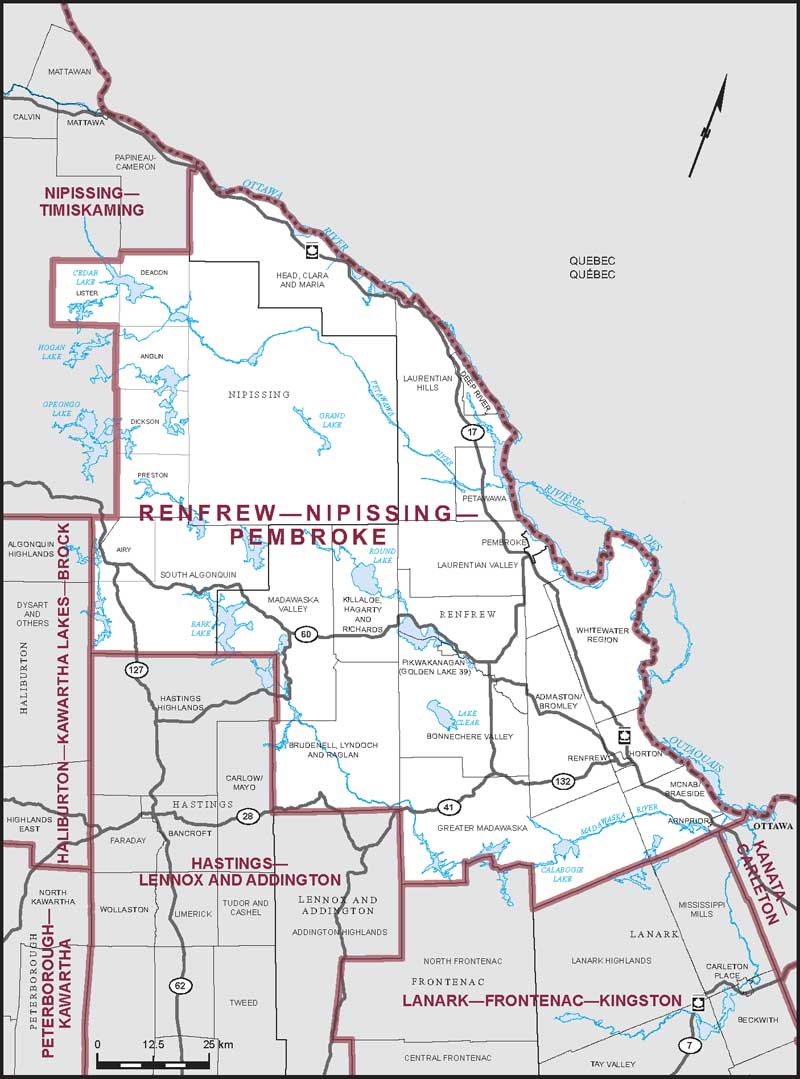
Electoral District:
PeterboroughProvince/Territory:
Ontario-
Population:
128,349 -
Area:
1,895 km² -
Population density:
68.00/km² -
Population change:
n/a -
Average age:
45 -
Average income:
$49,160 -
Voter turnout:
74%
Language spoken most often at home:
-
English:
122,460 -
French:
280 -
Indigenous language:
15 -
Most popular other language:
-
Arabic:
310
-
-
All others:
2,735
-
-
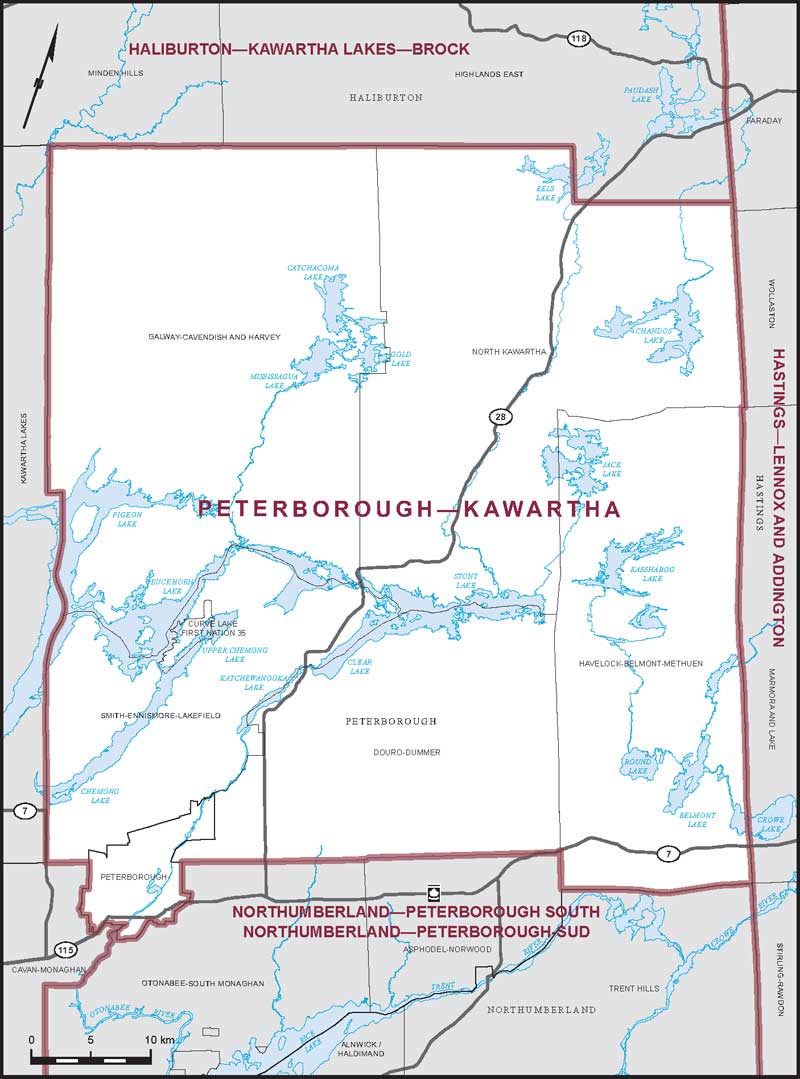
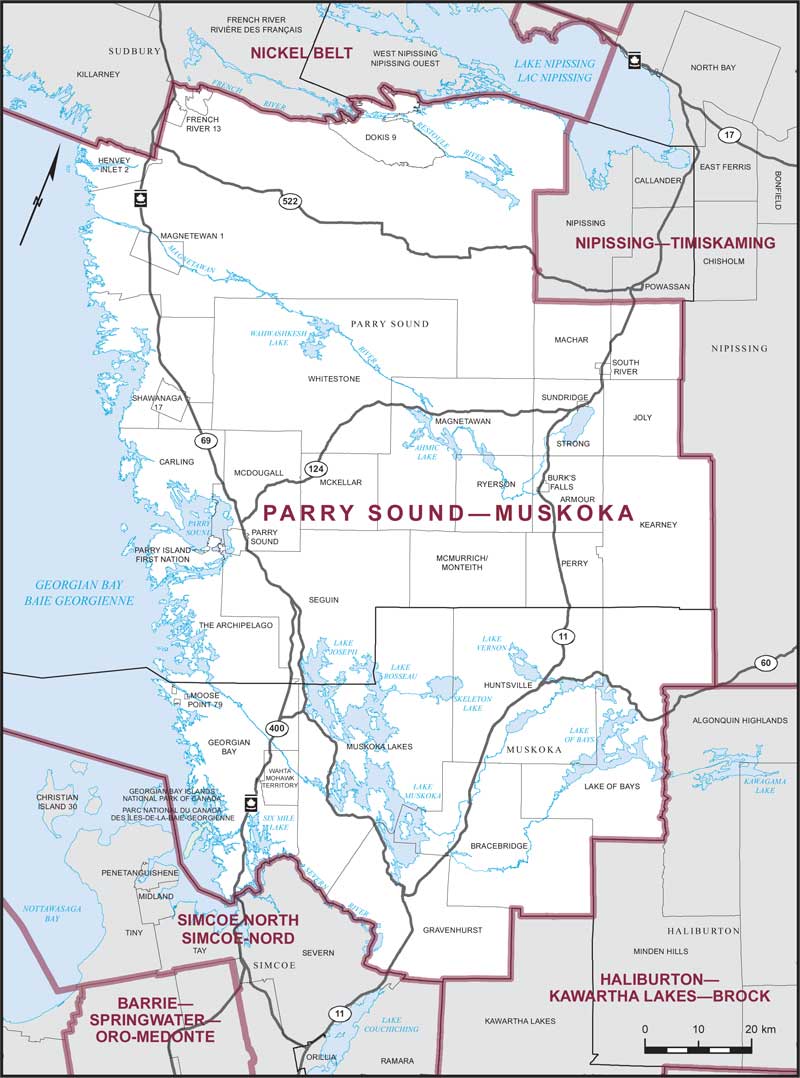
Electoral District:
Parry Sound—MuskokaProvince/Territory:
Ontario-
Population:
104,504 -
Area:
12,239 km² -
Population density:
9.00/km² -
Population change:
n/a -
Average age:
49 -
Average income:
$52,500 -
Voter turnout:
71%
Language spoken most often at home:
-
English:
100,965 -
French:
170 -
Indigenous language:
35 -
Most popular other language:
-
German:
140
-
-
All others:
970
-
-
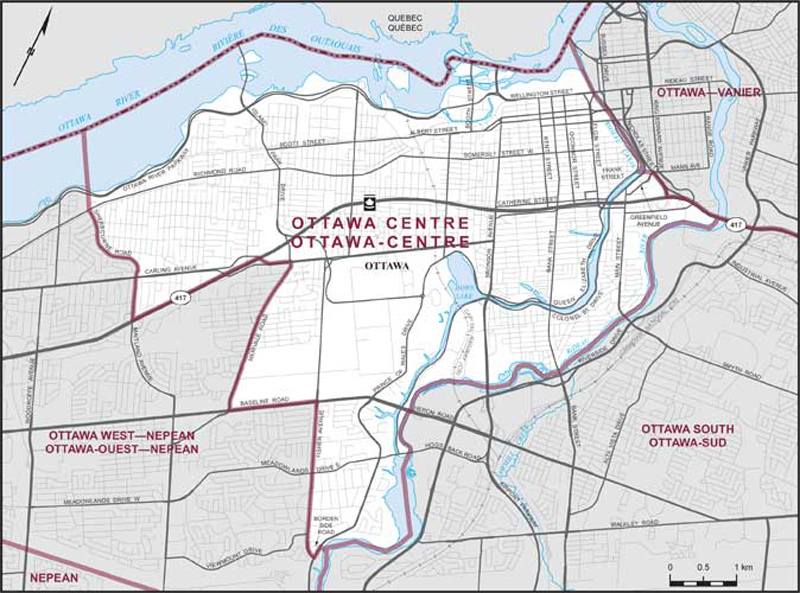
Electoral District:
Oakville EastProvince/Territory:
Ontario-
Population:
108,735 -
Area:
71 km² -
Population density:
1,531.00/km² -
Population change:
n/a -
Average age:
40 -
Average income:
$86,100 -
Voter turnout:
73%
Language spoken most often at home:
-
English:
77,650 -
French:
510 -
Indigenous language:
0 -
Most popular other language:
-
Mandarin:
7,670
-
-
All others:
14,855
-
-
Electoral District:
Oakville WestProvince/Territory:
Ontario-
Population:
105,024 -
Area:
68 km² -
Population density:
1,544.00/km² -
Population change:
n/a -
Average age:
41 -
Average income:
$77,400 -
Voter turnout:
75%
Language spoken most often at home:
-
English:
79,100 -
French:
725 -
Indigenous language:
0 -
Most popular other language:
-
Mandarin:
4,020
-
-
All others:
14,510
-
-
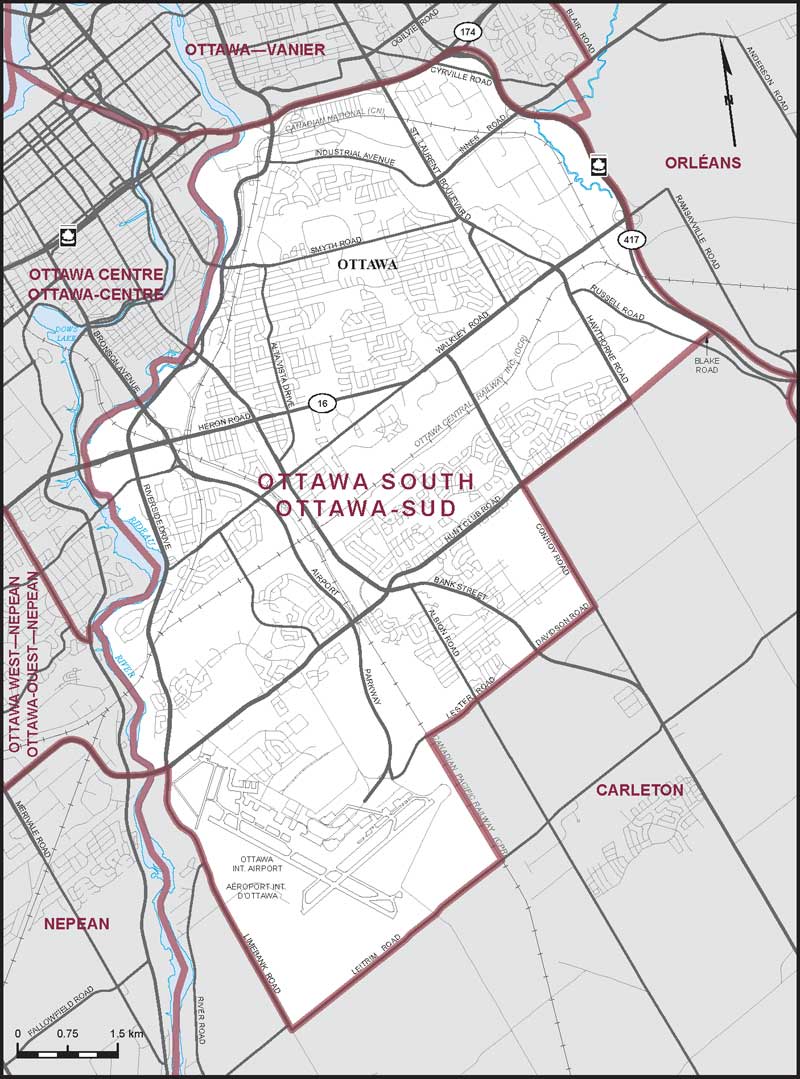
Electoral District:
Ottawa SouthProvince/Territory:
Ontario-
Population:
126,791 -
Area:
96 km² -
Population density:
1,321.00/km² -
Population change:
n/a -
Average age:
40 -
Average income:
$55,800 -
Voter turnout:
69%
Language spoken most often at home:
-
English:
83,345 -
French:
8,495 -
Indigenous language:
15 -
Most popular other language:
-
Arabic:
8,140
-
-
All others:
14,420
-
-
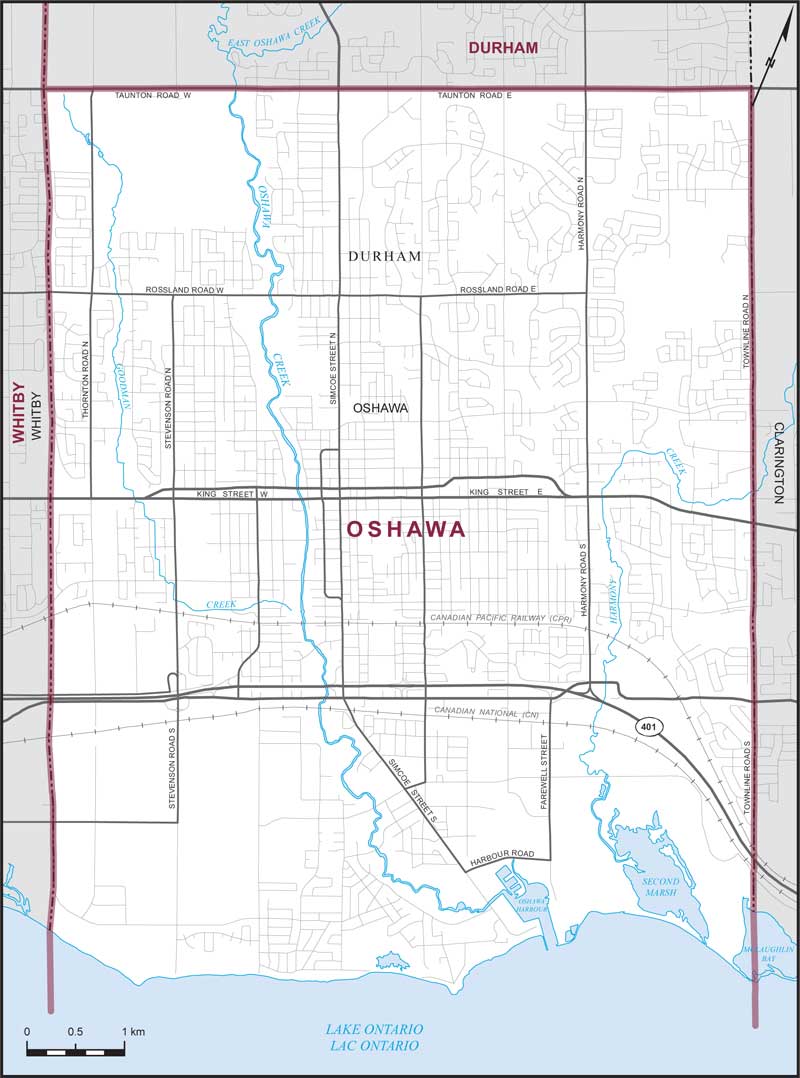
Electoral District:
OshawaProvince/Territory:
Ontario-
Population:
131,067 -
Area:
61 km² -
Population density:
2,149.00/km² -
Population change:
n/a -
Average age:
42 -
Average income:
$47,520 -
Voter turnout:
64%
Language spoken most often at home:
-
English:
118,560 -
French:
830 -
Indigenous language:
5 -
Most popular other language:
-
Urdu:
690
-
-
All others:
6,915
-
-
Electoral District:
Ottawa CentreProvince/Territory:
Ontario-
Population:
126,560 -
Area:
36 km² -
Population density:
3,516.00/km² -
Population change:
n/a -
Average age:
41 -
Average income:
$76,700 -
Voter turnout:
77%
Language spoken most often at home:
-
English:
102,145 -
French:
6,230 -
Indigenous language:
15 -
Most popular other language:
-
Mandarin:
1,520
-
-
All others:
9,605
-
-
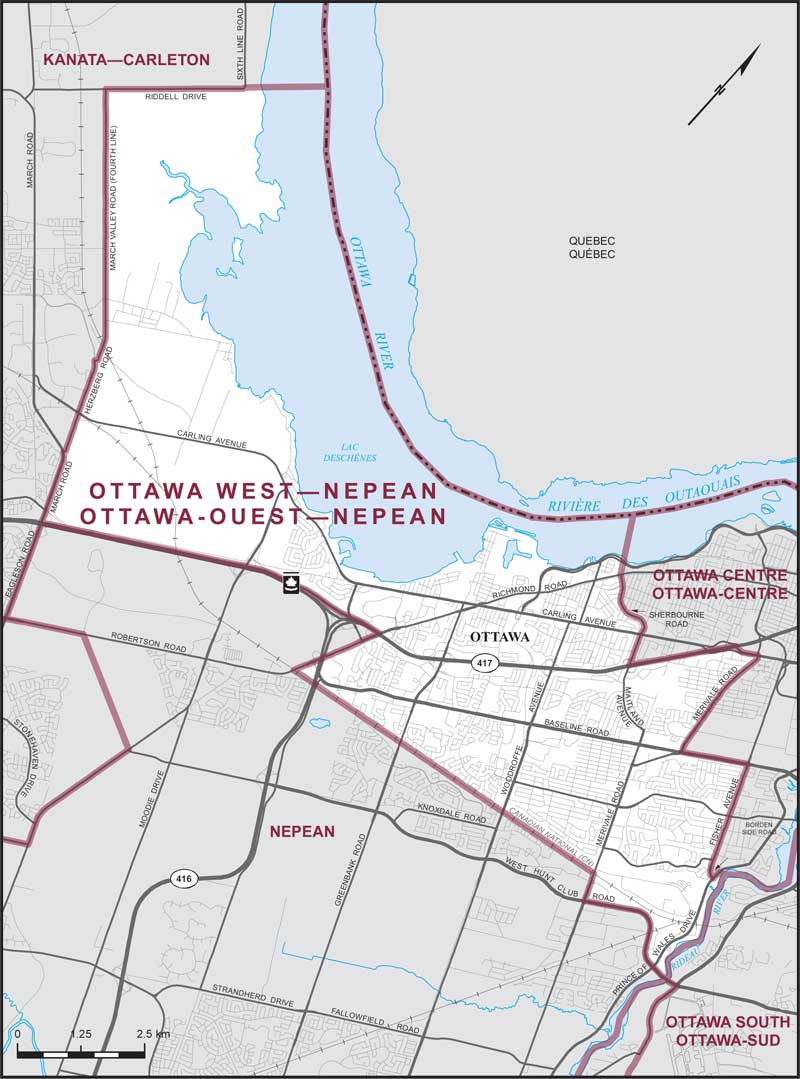
Electoral District:
Ottawa West—NepeanProvince/Territory:
Ontario-
Population:
128,592 -
Area:
44 km² -
Population density:
2,923.00/km² -
Population change:
n/a -
Average age:
43 -
Average income:
$57,200 -
Voter turnout:
72%
Language spoken most often at home:
-
English:
96,090 -
French:
4,240 -
Indigenous language:
40 -
Most popular other language:
-
Arabic:
3,170
-
-
All others:
15,495
-
-
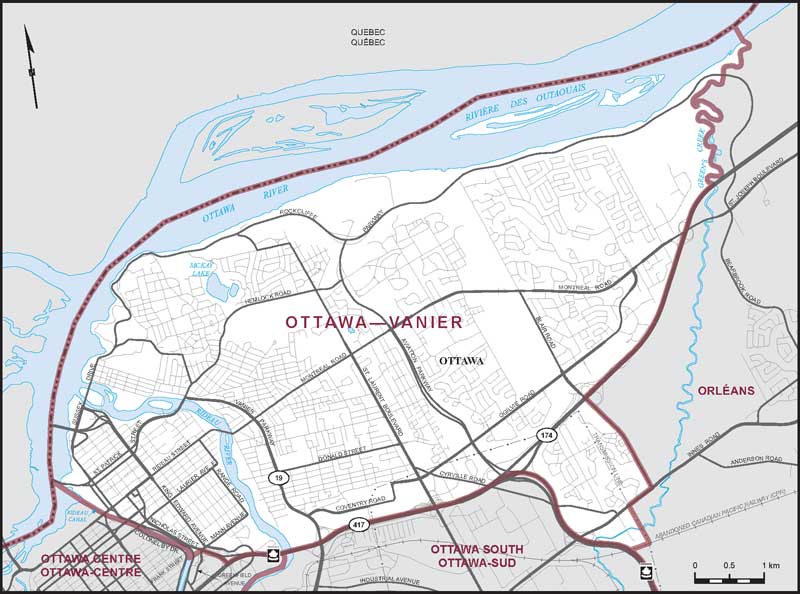
Electoral District:
Ottawa—Vanier—GloucesterProvince/Territory:
Ontario-
Population:
126,999 -
Area:
49 km² -
Population density:
2,592.00/km² -
Population change:
n/a -
Average age:
42 -
Average income:
$57,800 -
Voter turnout:
69%
Language spoken most often at home:
-
English:
79,420 -
French:
21,965 -
Indigenous language:
80 -
Most popular other language:
-
Arabic:
3,155
-
-
All others:
10,640
-
-
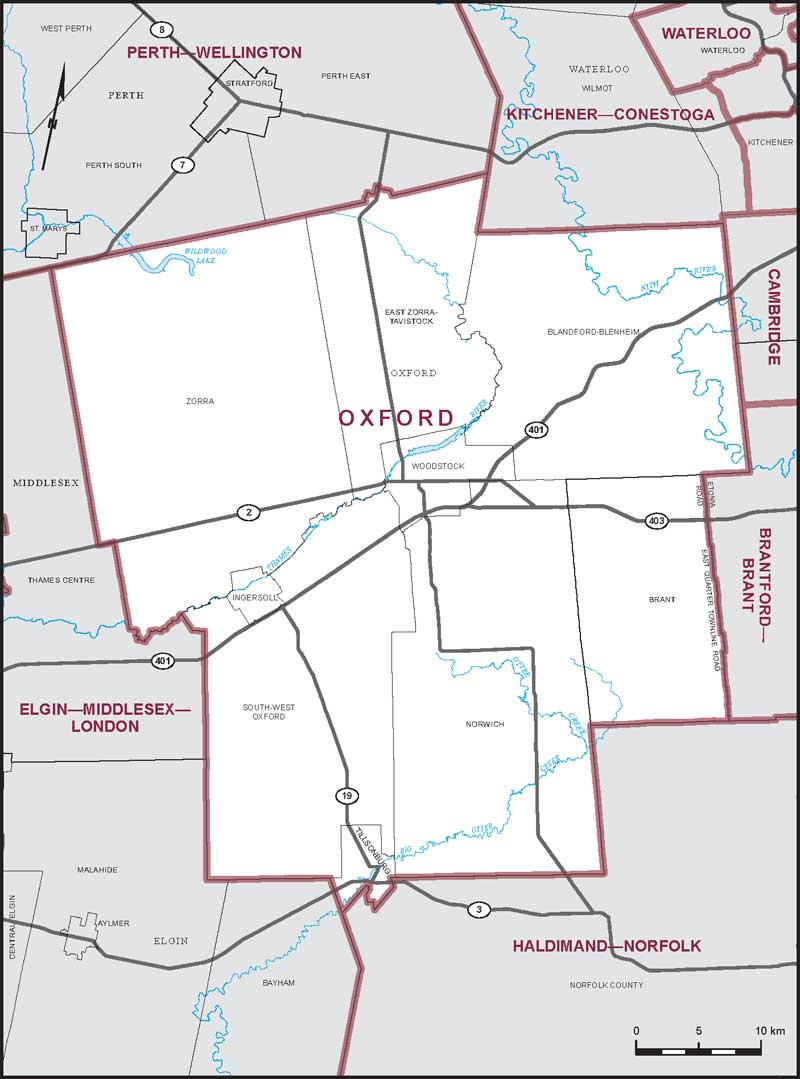
Electoral District:
OrléansProvince/Territory:
Ontario-
Population:
126,918 -
Area:
68 km² -
Population density:
1,866.00/km² -
Population change:
n/a -
Average age:
41 -
Average income:
$64,700 -
Voter turnout:
77%
Language spoken most often at home:
-
English:
78,680 -
French:
27,325 -
Indigenous language:
5 -
Most popular other language:
-
Arabic:
2,590
-
-
All others:
7,805
-
-
Electoral District:
Northumberland—ClarkeProvince/Territory:
Ontario-
Population:
106,574 -
Area:
2,211 km² -
Population density:
48.00/km² -
Population change:
n/a -
Average age:
47 -
Average income:
$53,400 -
Voter turnout:
75%
Language spoken most often at home:
-
English:
102,565 -
French:
310 -
Indigenous language:
5 -
Most popular other language:
-
Spanish:
150
-
-
All others:
1,425
-

