How does youth voting compare to that of other age groups? That’s the inquiry question students explore in Elections by the Numbers, an educational resource for secondary students. This learning resource has recently been updated to include voter turnout data from the 2019 federal election and a new activity sheet to further build numeracy skills.
In this updated version, students engage in a more challenging analysis and thoughtful reflection with voter turnout data from the past three federal elections (instead of two). The variation in youth voter turnout is quite noticeable from one election to the next. Through examining real-world data, students will see that young people tend to vote less than older demographics. Their task will be to interpret the meaning behind the trends, make connections and create effective data representation.
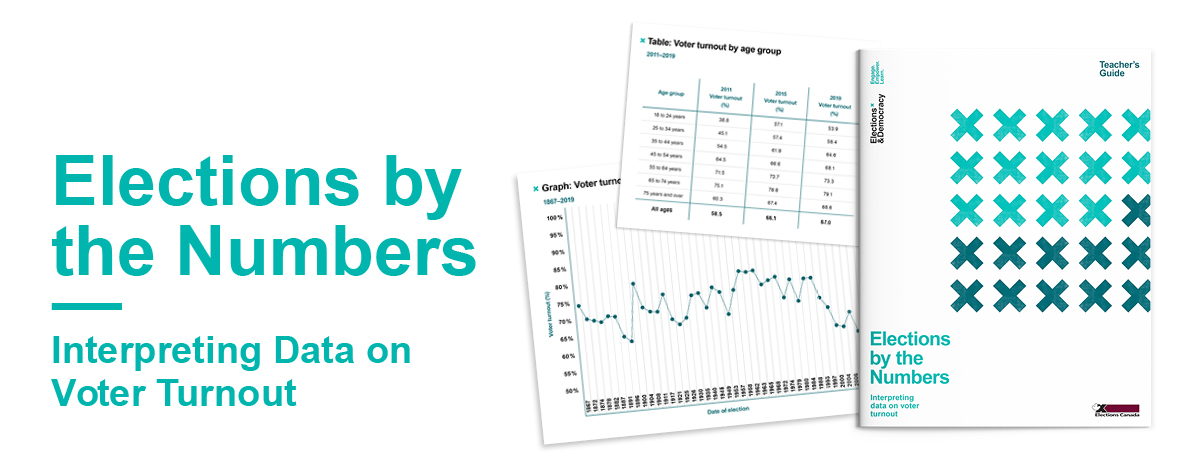
Students work in small groups to review data from a graph and a table. To help them better understand the meaning behind the data and boost their numeracy skills, they complete the new activity sheet, “Change in voter turnout,” where they calculate both the percentage-point change and the percent change for each age group.
Then students work collaboratively to brainstorm an effective way to represent the data and create a concept. All types of representation are encouraged: a graph, chart, image, infographic, etc.
To consolidate their learning, students explain the rationale for their decision and reflect on the meaning behind the trends.

Like Elections Canada’s other educational resources, Elections by the Numbers is inquiry-based, hands-on, interactive, student-centred, non-partisan and free of charge. It’s also cross-curricular, with links to a variety of subjects including mathematics, data management, language arts and social studies.
Teachers can order or download the Teacher’s Guide and materials from the Elections and Democracy website. To provide even more flexibility for using this lesson, a blended learning adaptation is available on Google Drive.
For a quick overview of the lesson and some great tips on how to teach it, take a look at this short video.
Don’t forget to share your students’ concepts and your experience with us! (Twitter or Facebook)