Federal Electoral District Fact Sheets
-
Electoral District:
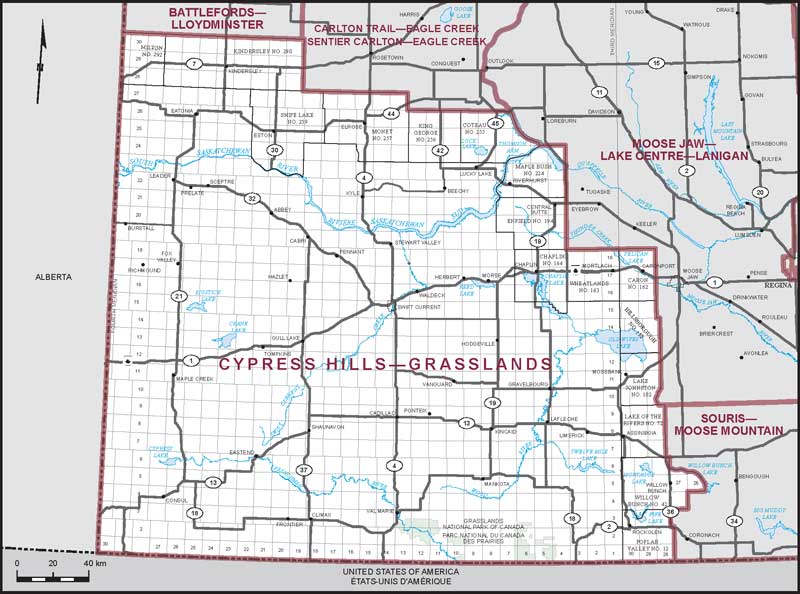
Carlton Trail—Eagle CreekProvince/Territory:
Saskatchewan-
Population:
84,111 -
Area:
23,198 km² -
Population density:
4.00/km² -
Population change:
n/a -
Average age:
39 -
Average income:
$55,300 -
Voter turnout:
75%
Language spoken most often at home:
-
English:
79,105 -
French:
275 -
Indigenous language:
110 -
Most popular other language:
-
German:
735
-
-
All others:
1,890
-
-
Electoral District:
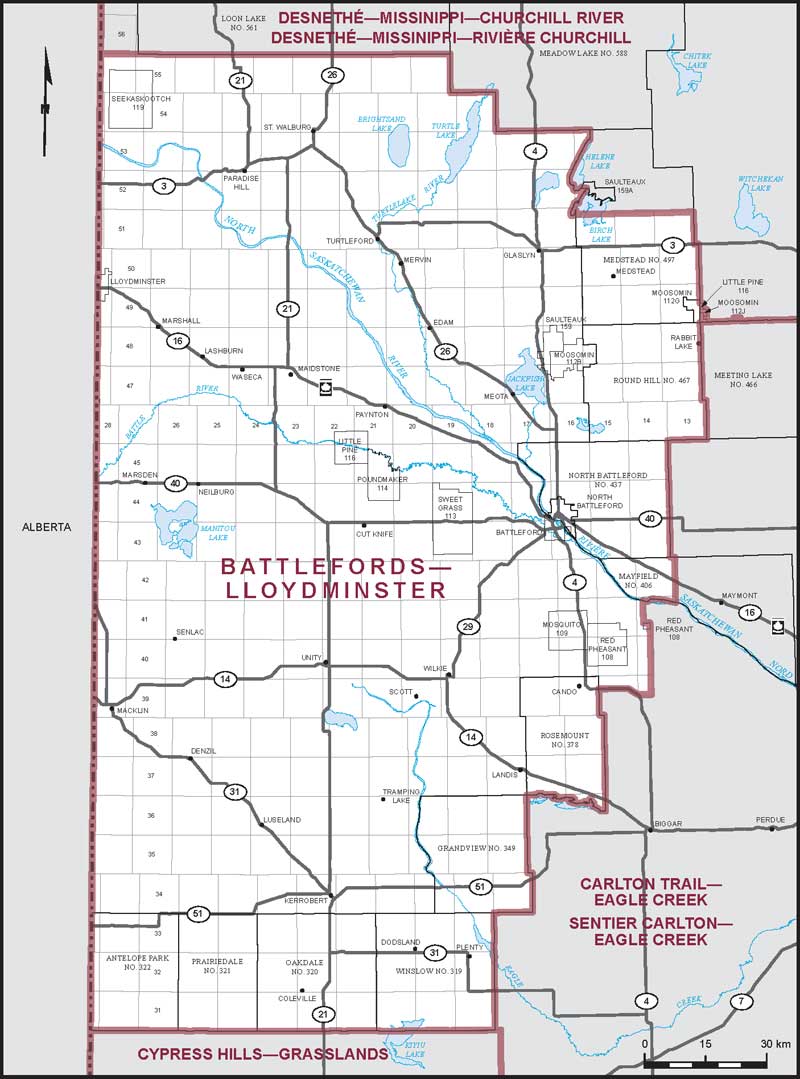
Battlefords—Lloydminster—Meadow LakeProvince/Territory:
Saskatchewan-
Population:
83,248 -
Area:
35,065 km² -
Population density:
2.00/km² -
Population change:
n/a -
Average age:
39 -
Average income:
$48,280 -
Voter turnout:
63%
Language spoken most often at home:
-
English:
75,730 -
French:
135 -
Indigenous language:
1,175 -
Most popular other language:
-
Tagalog (Pilipino, Filipino):
1,170
-
-
All others:
2,015
-
-
Electoral District:
Winnipeg WestProvince/Territory:
Manitoba-
Population:
94,074 -
Area:
651 km² -
Population density:
145.00/km² -
Population change:
n/a -
Average age:
44 -
Average income:
$61,600 -
Voter turnout:
76%
Language spoken most often at home:
-
English:
84,245 -
French:
340 -
Indigenous language:
75 -
Most popular other language:
-
Tagalog (Pilipino, Filipino):
1,080
-
-
All others:
4,420
-
-
Electoral District:
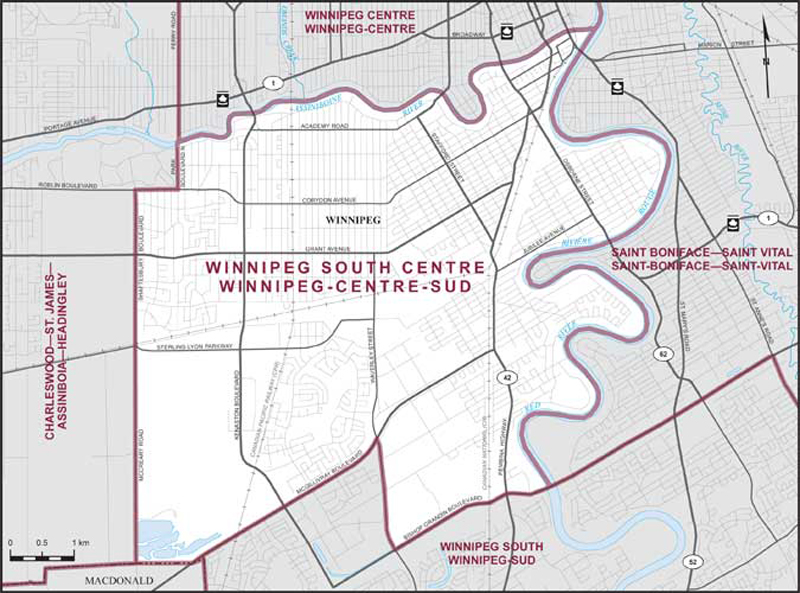
Winnipeg South CentreProvince/Territory:
Manitoba-
Population:
95,882 -
Area:
45 km² -
Population density:
2,131.00/km² -
Population change:
n/a -
Average age:
43 -
Average income:
$60,400 -
Voter turnout:
75%
Language spoken most often at home:
-
English:
79,890 -
French:
500 -
Indigenous language:
15 -
Most popular other language:
-
Mandarin:
1,405
-
-
All others:
9,840
-
-
Electoral District:
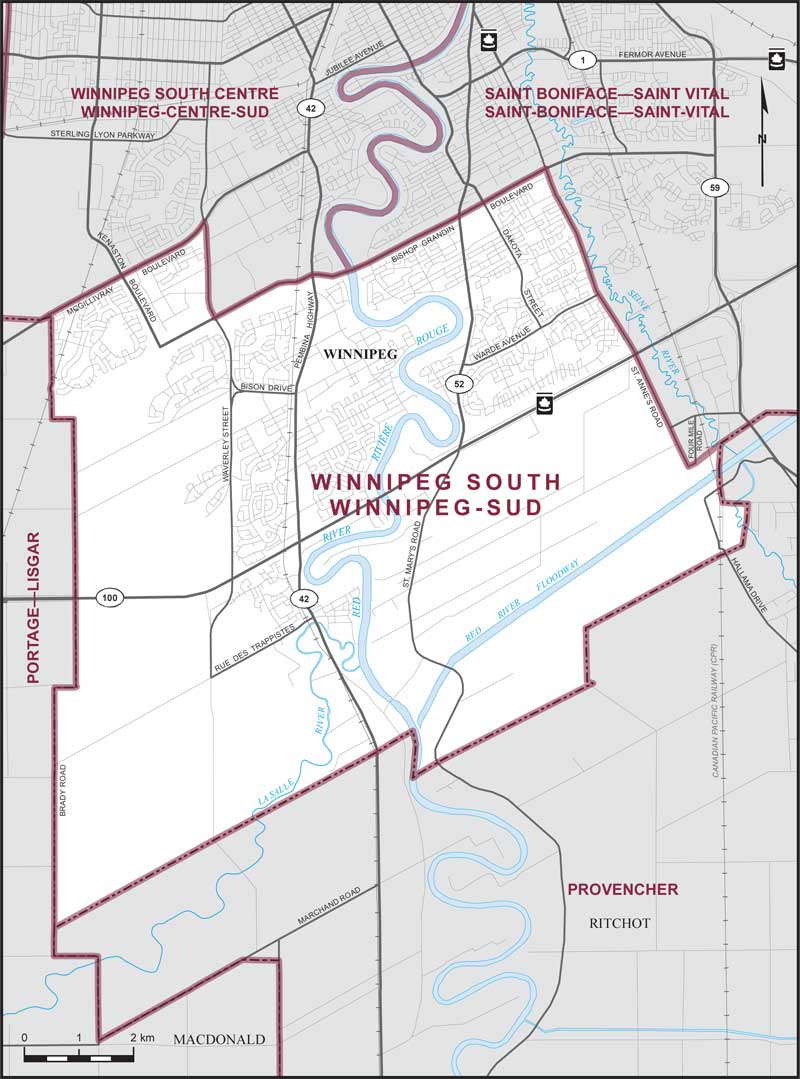
Winnipeg SouthProvince/Territory:
Manitoba-
Population:
99,793 -
Area:
94 km² -
Population density:
1,062.00/km² -
Population change:
n/a -
Average age:
38 -
Average income:
$52,150 -
Voter turnout:
72%
Language spoken most often at home:
-
English:
67,055 -
French:
1,400 -
Indigenous language:
55 -
Most popular other language:
-
Mandarin:
6,140
-
-
All others:
17,900
-
-
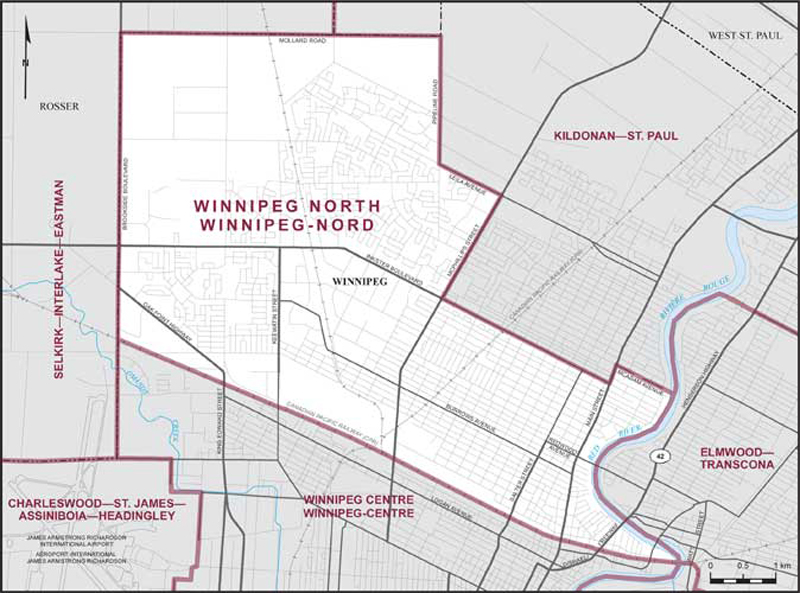
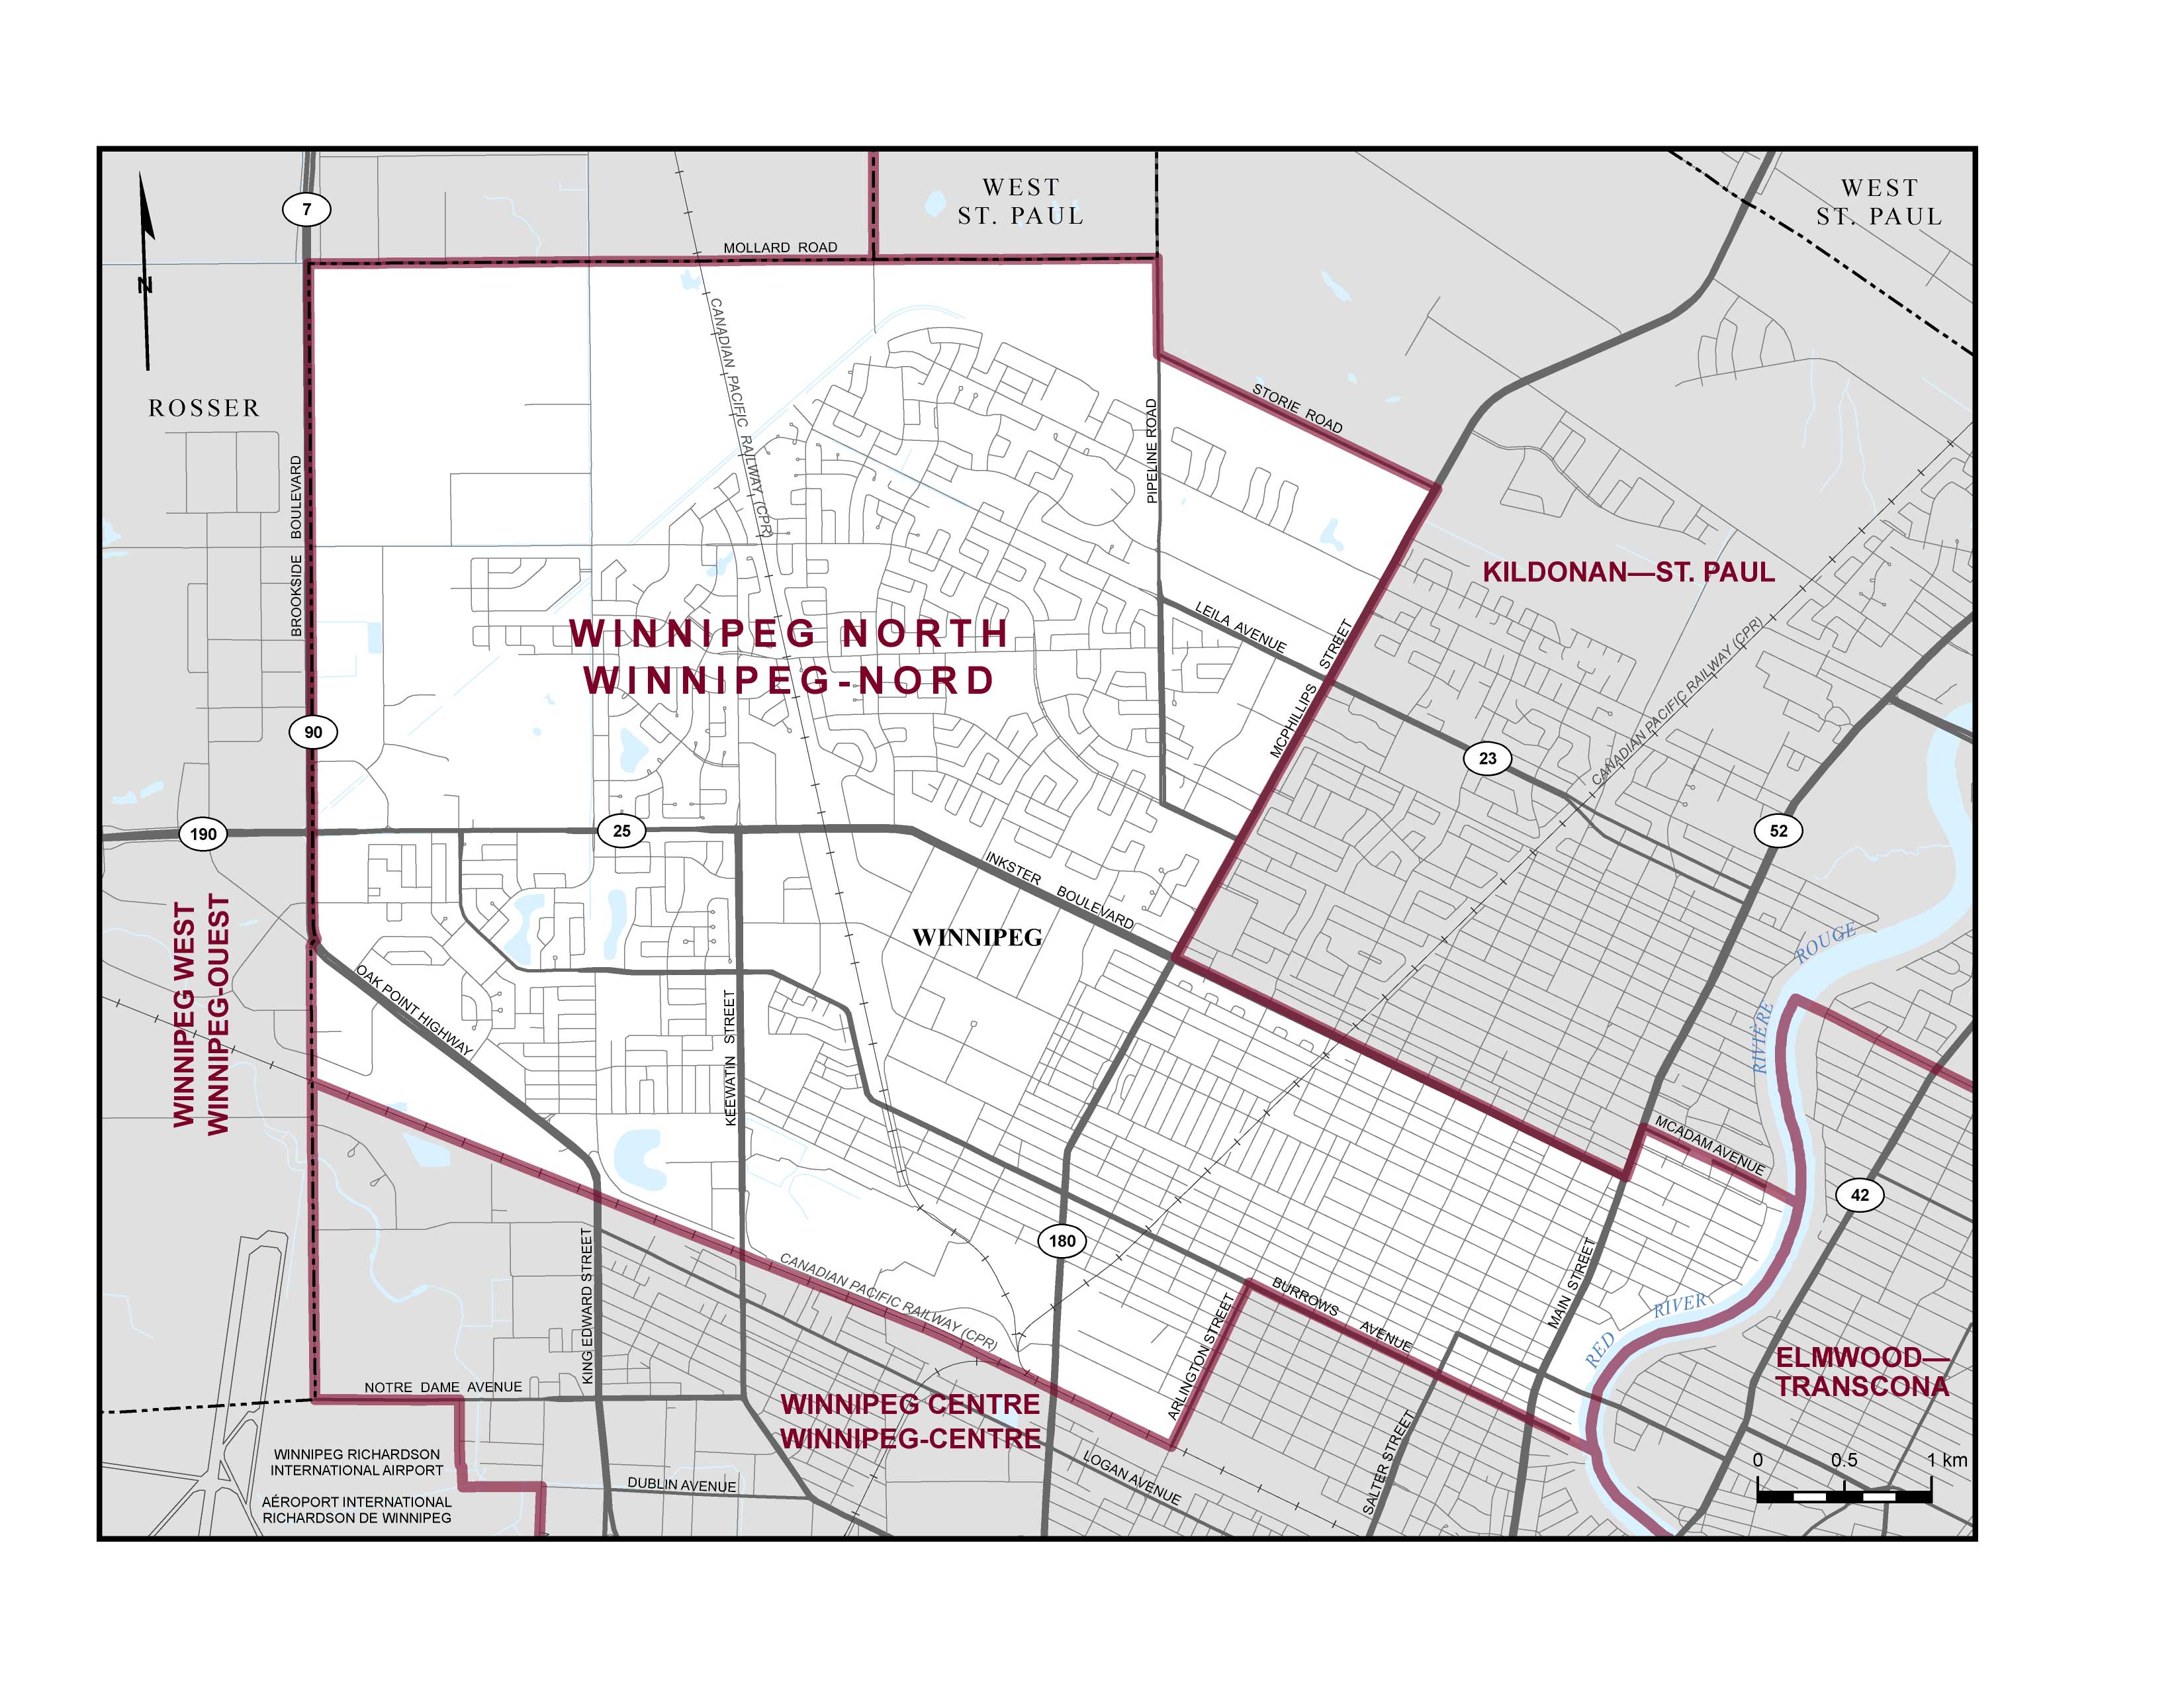
Electoral District:
Winnipeg NorthProvince/Territory:
Manitoba-
Population:
95,082 -
Area:
36 km² -
Population density:
2,641.00/km² -
Population change:
n/a -
Average age:
38 -
Average income:
$39,520 -
Voter turnout:
59%
Language spoken most often at home:
-
English:
54,905 -
French:
85 -
Indigenous language:
130 -
Most popular other language:
-
Punjabi (Panjabi):
13,485
-
-
All others:
17,145
-
-
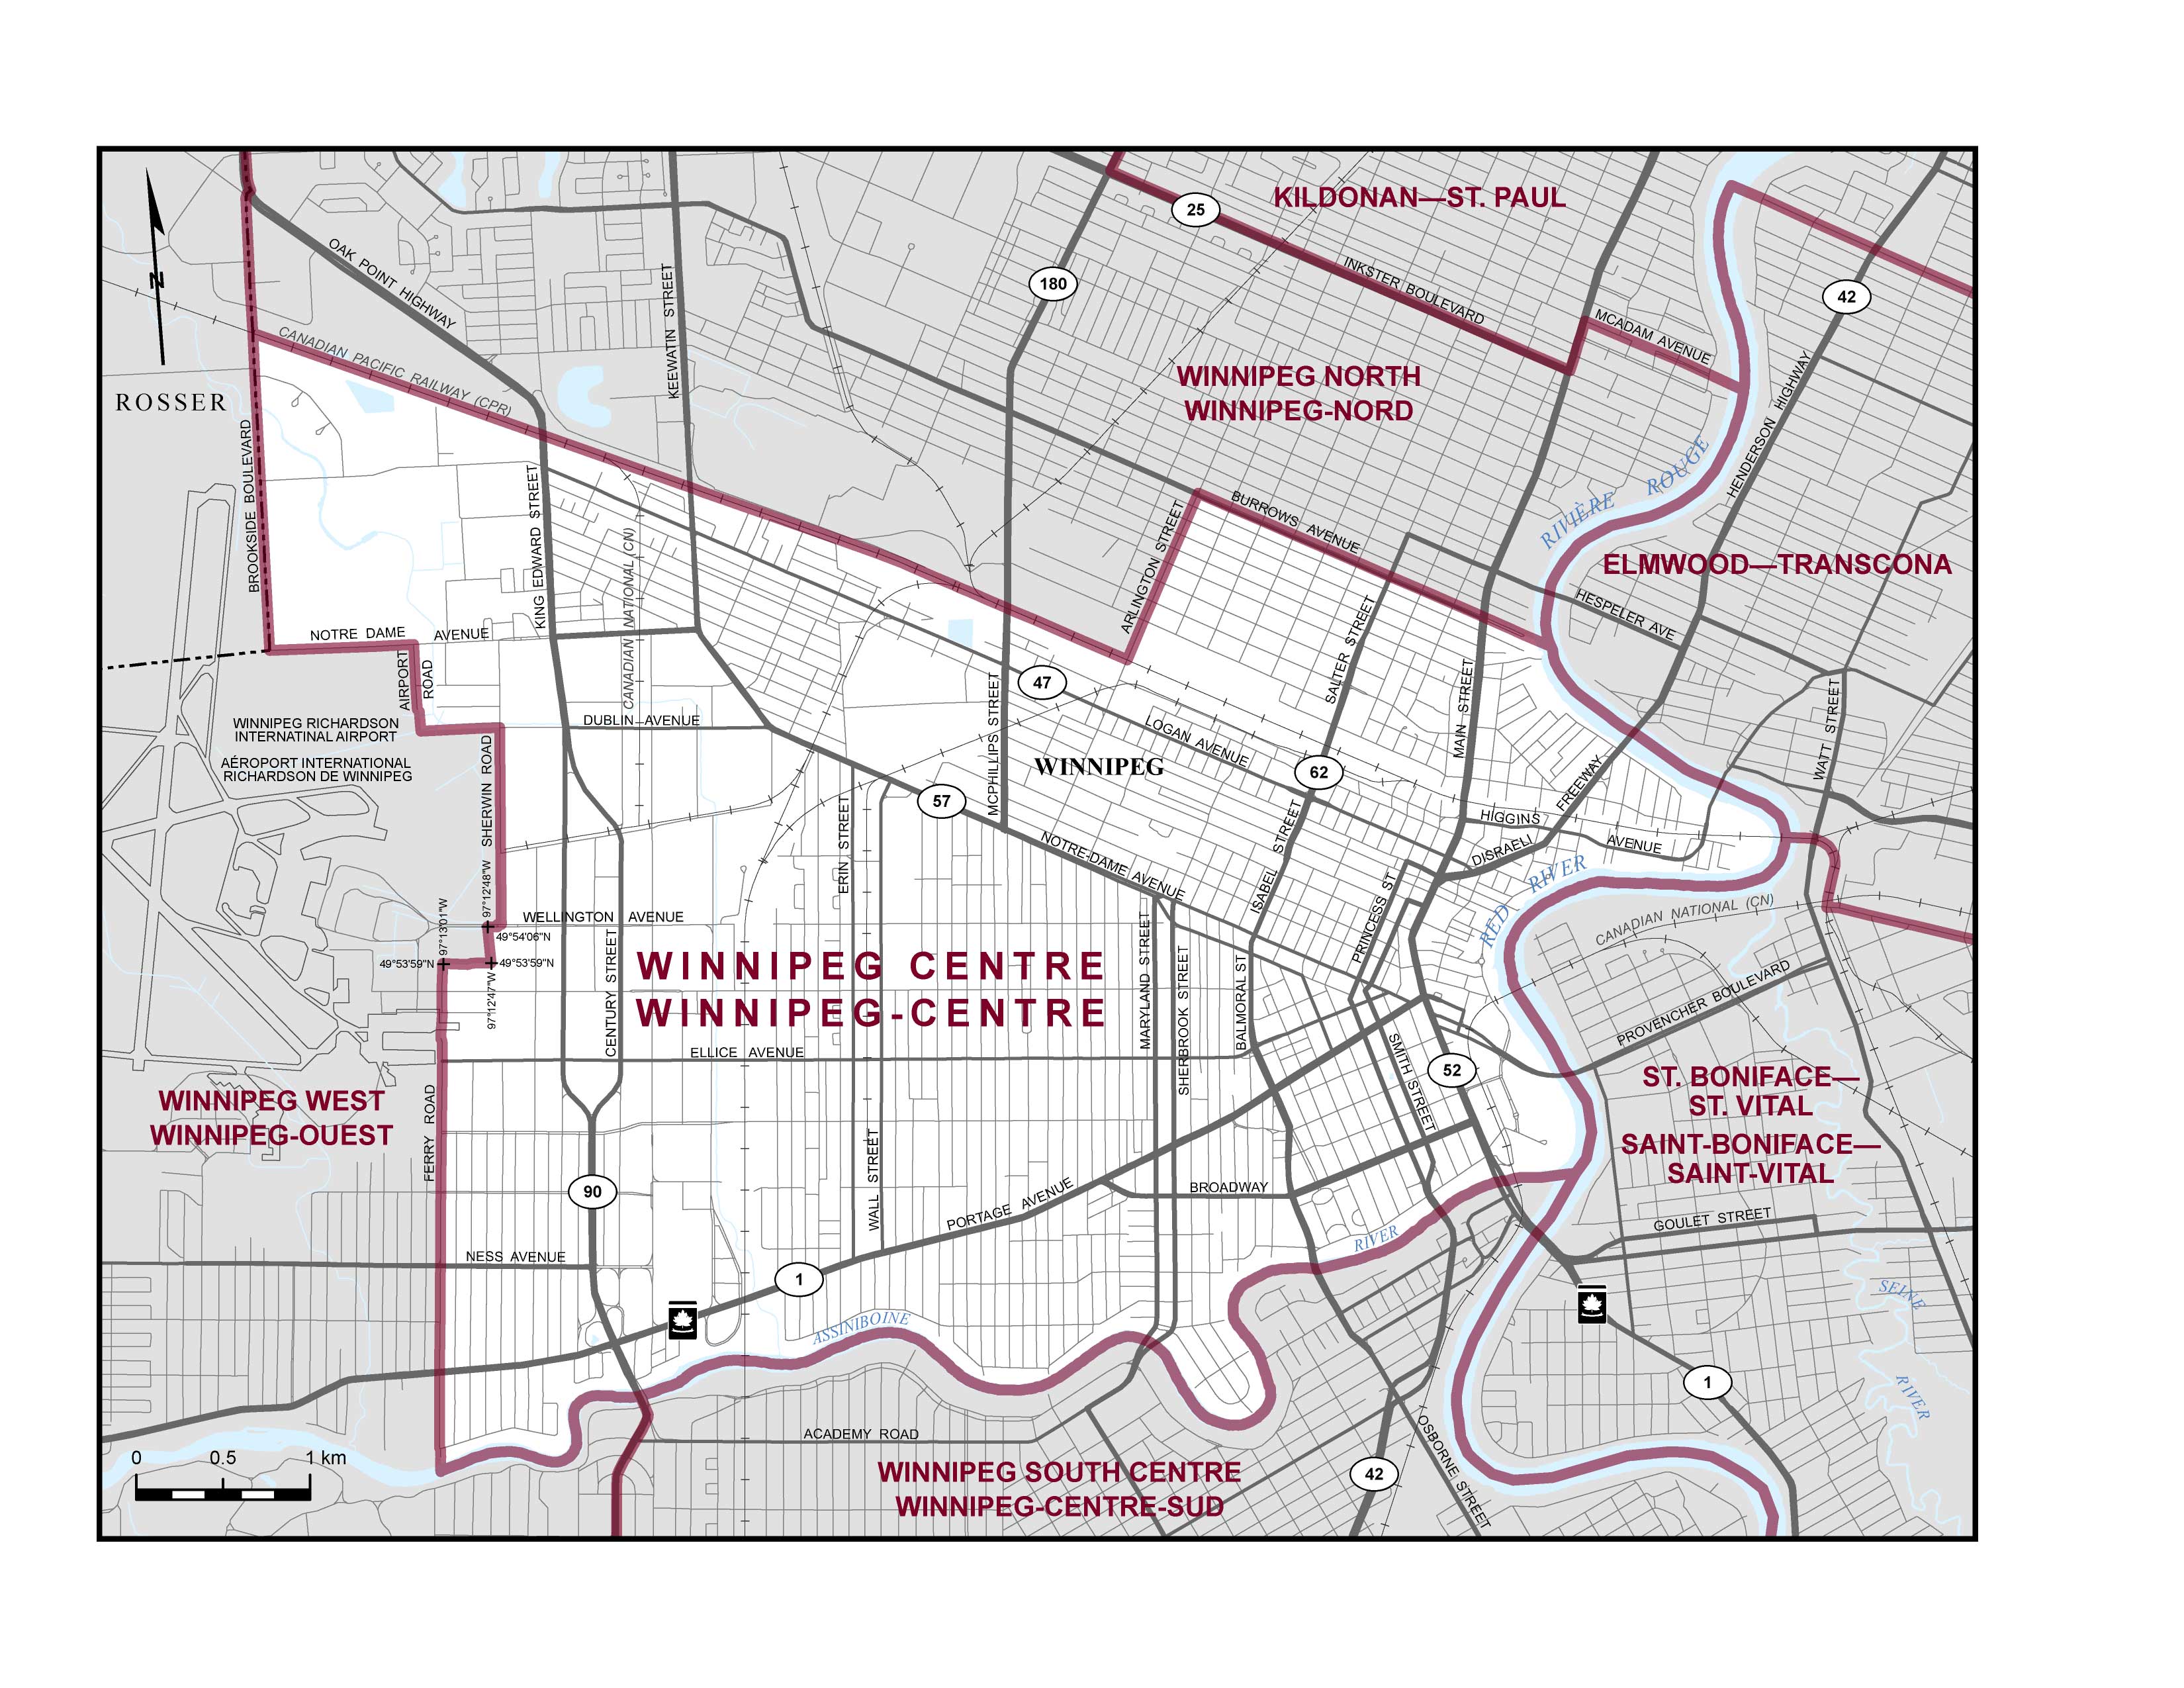
Electoral District:
Winnipeg CentreProvince/Territory:
Manitoba-
Population:
96,951 -
Area:
31 km² -
Population density:
3,127.00/km² -
Population change:
n/a -
Average age:
38 -
Average income:
$39,120 -
Voter turnout:
54%
Language spoken most often at home:
-
English:
70,125 -
French:
510 -
Indigenous language:
400 -
Most popular other language:
-
Tagalog (Pilipino, Filipino):
7,275
-
-
All others:
10,675
-
-
Electoral District:
Selkirk—Interlake—EastmanProvince/Territory:
Manitoba-
Population:
98,620 -
Area:
19,064 km² -
Population density:
5.00/km² -
Population change:
n/a -
Average age:
44 -
Average income:
$49,880 -
Voter turnout:
71%
Language spoken most often at home:
-
English:
91,525 -
French:
405 -
Indigenous language:
40 -
Most popular other language:
-
German:
1,625
-
-
All others:
1,775
-
-
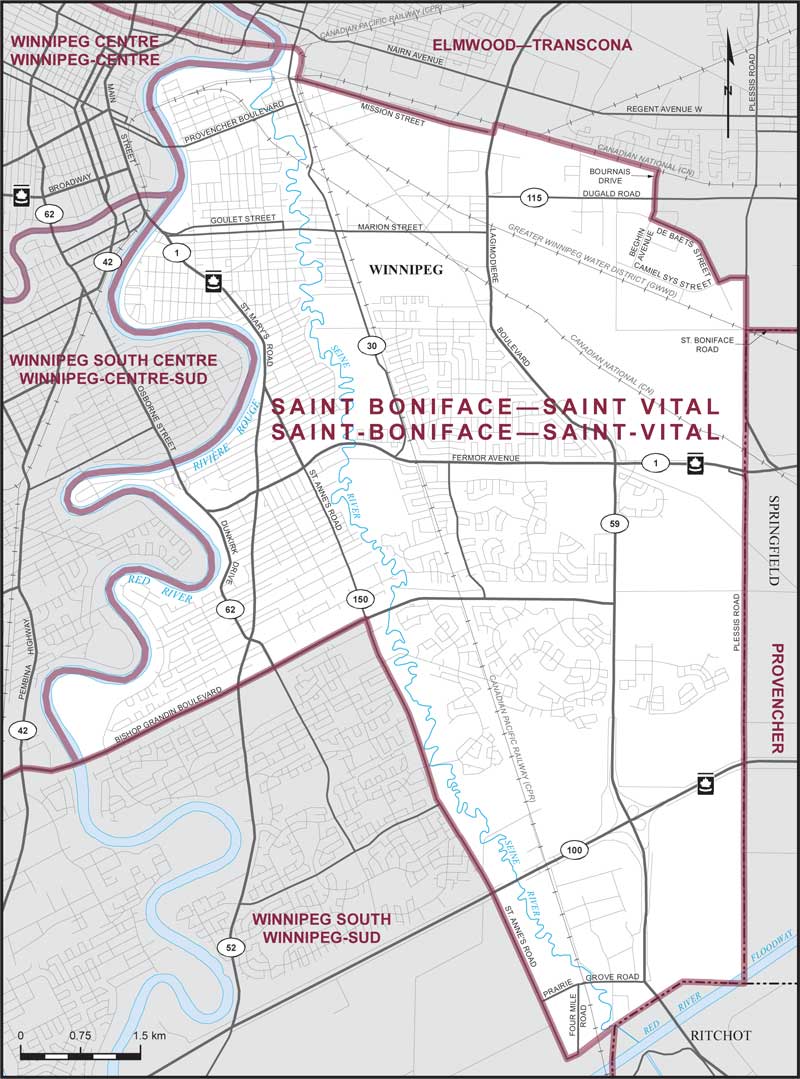
Electoral District:
St. Boniface—St. VitalProvince/Territory:
Manitoba-
Population:
99,975 -
Area:
65 km² -
Population density:
1,538.00/km² -
Population change:
n/a -
Average age:
42 -
Average income:
$54,000 -
Voter turnout:
72%
Language spoken most often at home:
-
English:
80,370 -
French:
4,665 -
Indigenous language:
40 -
Most popular other language:
-
Punjabi (Panjabi):
1,145
-
-
All others:
8,395
-
-
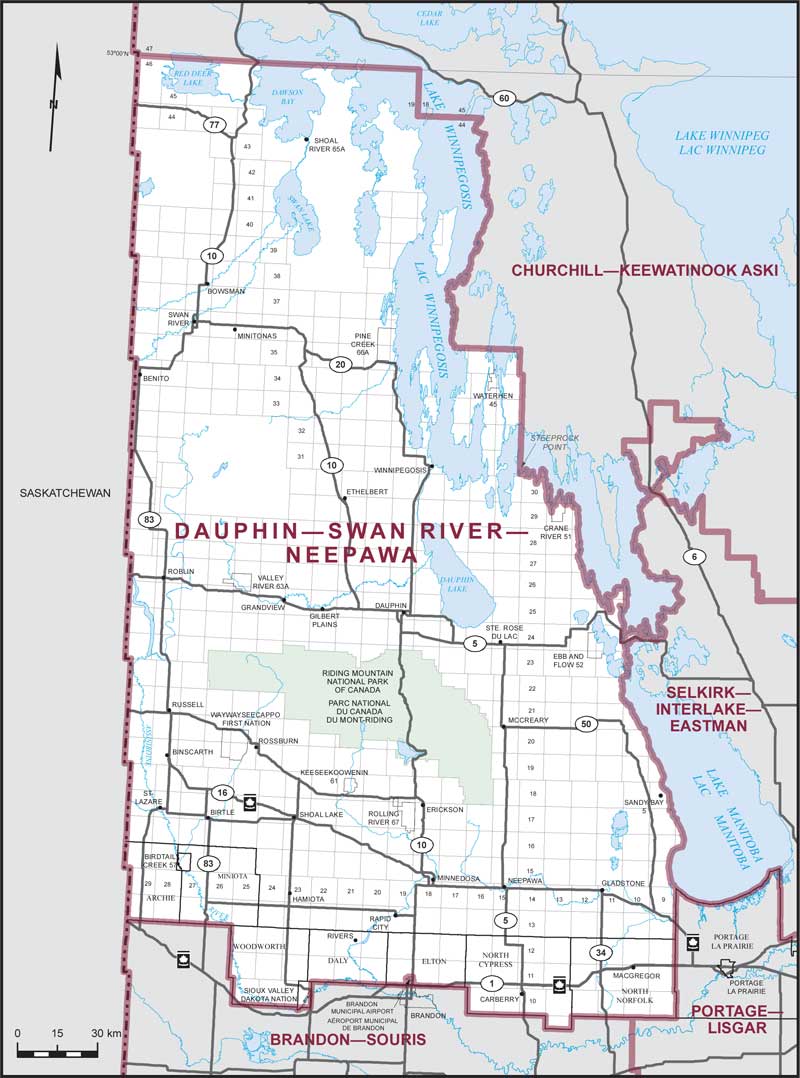
Electoral District:
Riding MountainProvince/Territory:
Manitoba-
Population:
90,962 -
Area:
51,479 km² -
Population density:
2.00/km² -
Population change:
n/a -
Average age:
41 -
Average income:
$43,320 -
Voter turnout:
65%
Language spoken most often at home:
-
English:
82,030 -
French:
300 -
Indigenous language:
500 -
Most popular other language:
-
German:
2,435
-
-
All others:
3,000
-
-
Electoral District:
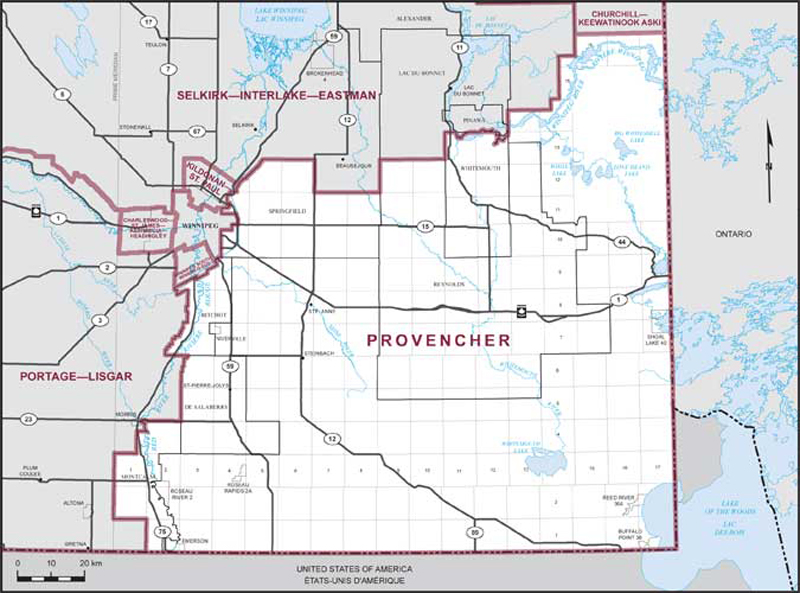
ProvencherProvince/Territory:
Manitoba-
Population:
100,332 -
Area:
17,780 km² -
Population density:
6.00/km² -
Population change:
n/a -
Average age:
37 -
Average income:
$47,480 -
Voter turnout:
71%
Language spoken most often at home:
-
English:
83,045 -
French:
4,195 -
Indigenous language:
25 -
Most popular other language:
-
German:
5,305
-
-
All others:
4,145
-
-
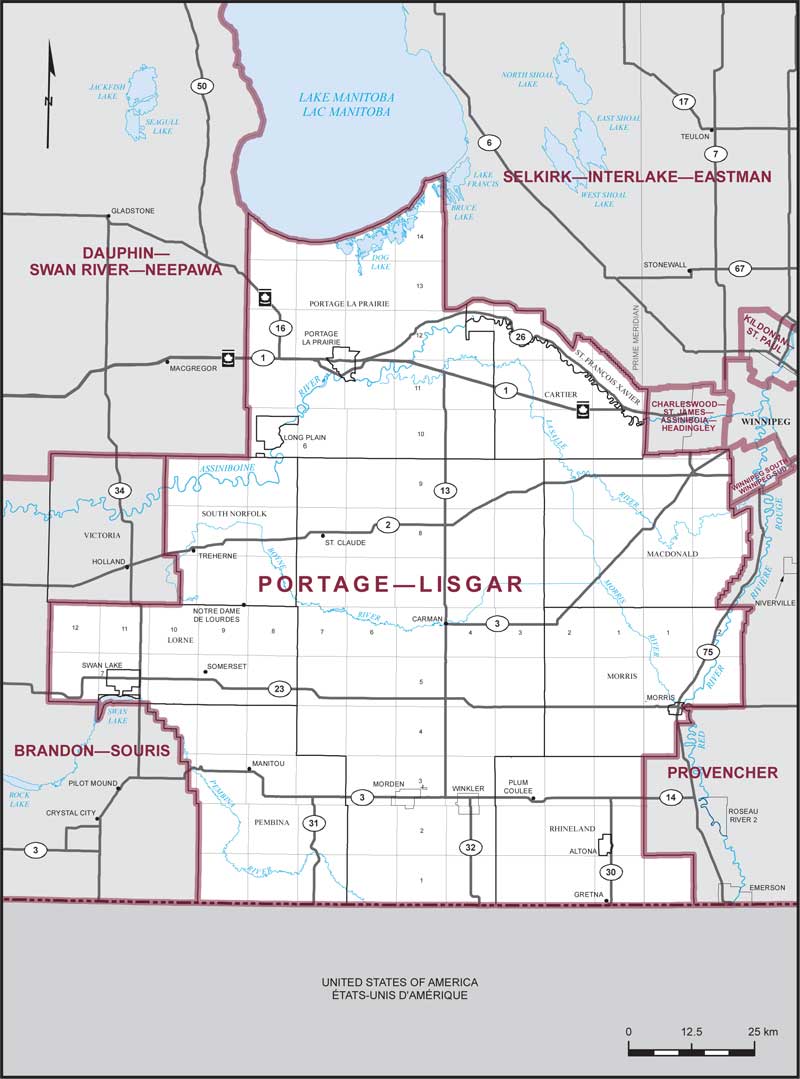
Electoral District:
Portage—LisgarProvince/Territory:
Manitoba-
Population:
94,840 -
Area:
10,568 km² -
Population density:
9.00/km² -
Population change:
n/a -
Average age:
38 -
Average income:
$47,480 -
Voter turnout:
68%
Language spoken most often at home:
-
English:
77,515 -
French:
960 -
Indigenous language:
40 -
Most popular other language:
-
German:
6,550
-
-
All others:
6,345
-
-
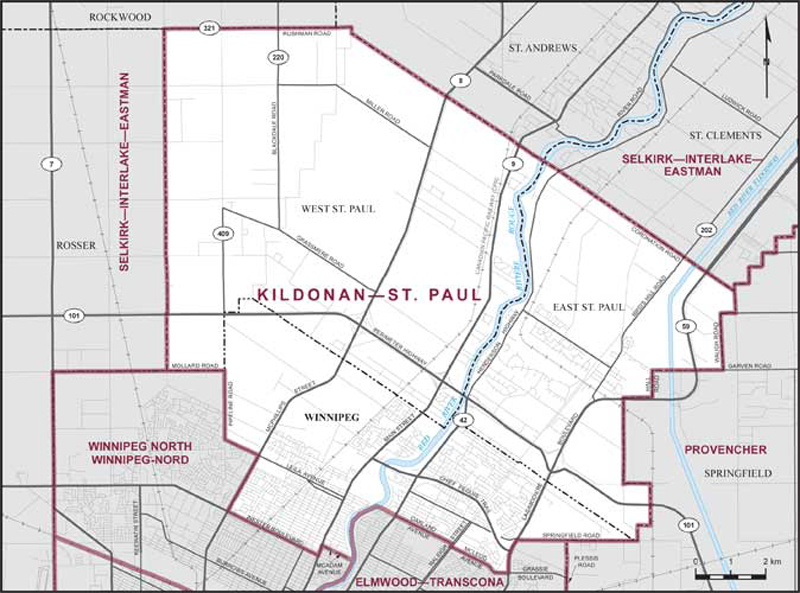
Electoral District:
Kildonan—St. PaulProvince/Territory:
Manitoba-
Population:
99,467 -
Area:
298 km² -
Population density:
334.00/km² -
Population change:
n/a -
Average age:
42 -
Average income:
$54,450 -
Voter turnout:
72%
Language spoken most often at home:
-
English:
83,325 -
French:
220 -
Indigenous language:
60 -
Most popular other language:
-
Tagalog (Pilipino, Filipino):
3,515
-
-
All others:
7,980
-
-
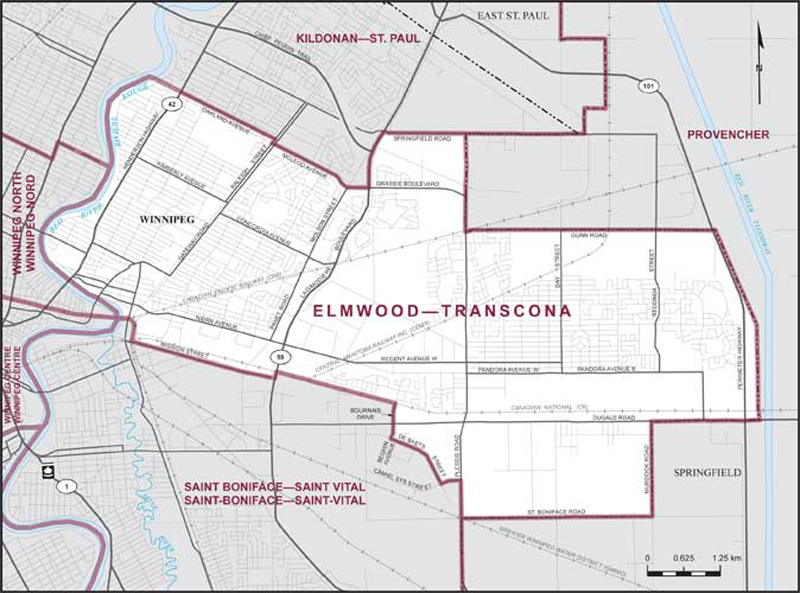
Electoral District:
Elmwood—TransconaProvince/Territory:
Manitoba-
Population:
99,504 -
Area:
170 km² -
Population density:
585.00/km² -
Population change:
n/a -
Average age:
39 -
Average income:
$46,160 -
Voter turnout:
66%
Language spoken most often at home:
-
English:
80,365 -
French:
690 -
Indigenous language:
65 -
Most popular other language:
-
Punjabi (Panjabi):
3,810
-
-
All others:
9,370
-
-
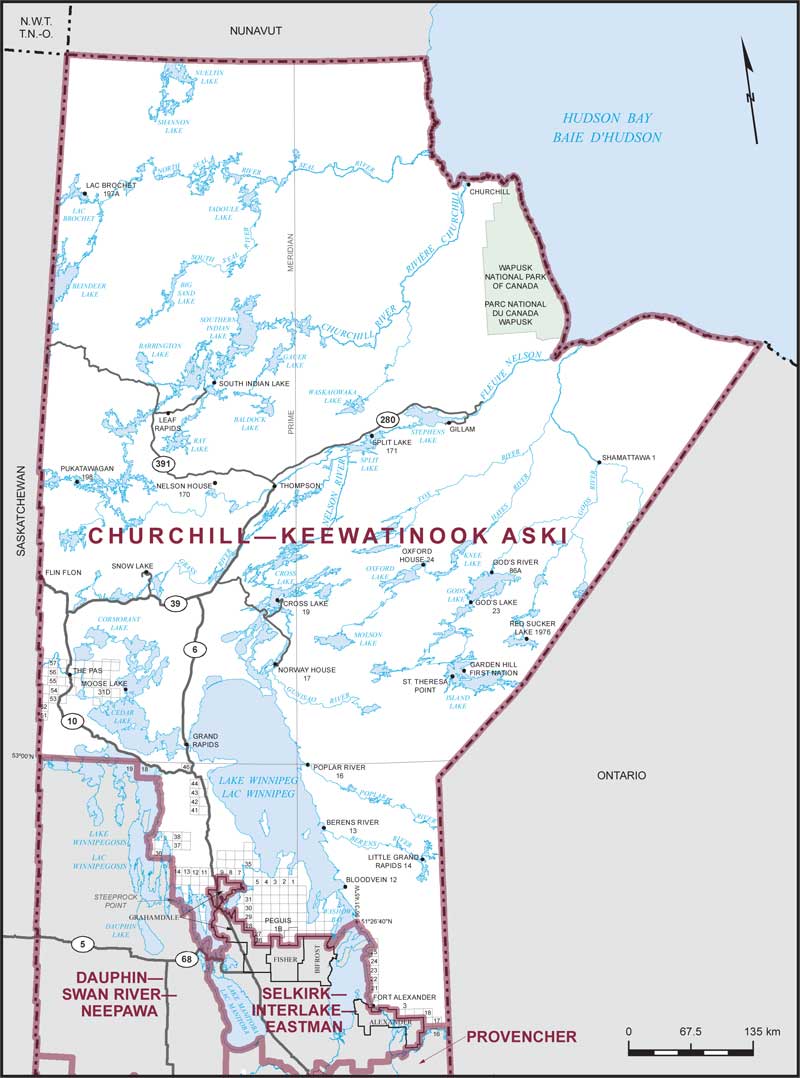
Electoral District:
Churchill—Keewatinook AskiProvince/Territory:
Manitoba-
Population:
82,741 -
Area:
420,680 km² -
Population density:
0.20/km² -
Population change:
n/a -
Average age:
32 -
Average income:
$40,880 -
Voter turnout:
42%
Language spoken most often at home:
-
English:
69,555 -
French:
150 -
Indigenous language:
6,065 -
Most popular other language:
-
Punjabi (Panjabi):
360
-
-
All others:
965
-
-
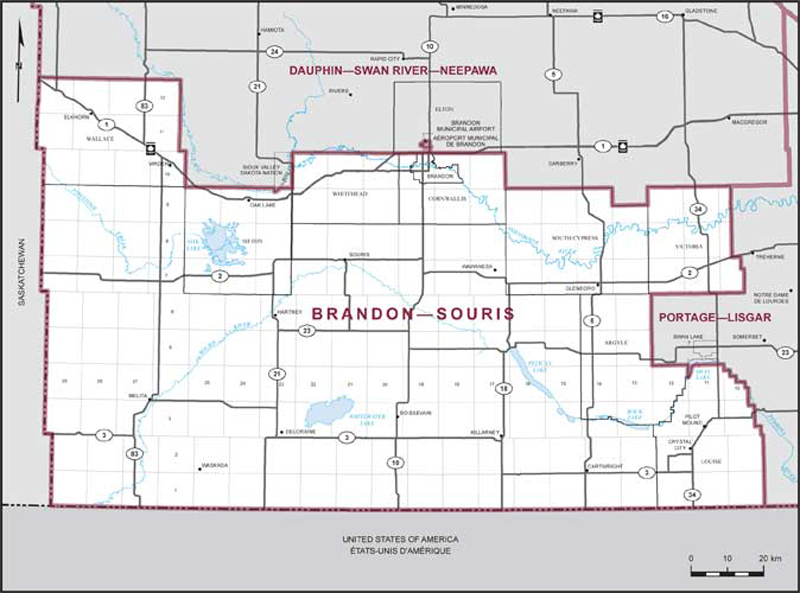
Electoral District:
Brandon—SourisProvince/Territory:
Manitoba-
Population:
93,930 -
Area:
19,348 km² -
Population density:
5.00/km² -
Population change:
n/a -
Average age:
40 -
Average income:
$48,360 -
Voter turnout:
69%
Language spoken most often at home:
-
English:
80,960 -
French:
285 -
Indigenous language:
115 -
Most popular other language:
-
Spanish:
1,645
-
-
All others:
7,210
-