Federal Electoral District Fact Sheets
-
Electoral District:
Kingston and the IslandsProvince/Territory:
Ontario-
Population:
134,415 -
Area:
628 km² -
Population density:
214.00/km² -
Population change:
n/a -
Average age:
43 -
Average income:
$54,250 -
Voter turnout:
67%
Language spoken most often at home:
-
English:
120,240 -
French:
1,810 -
Indigenous language:
5 -
Most popular other language:
-
Mandarin:
1,070
-
-
All others:
6,110
-
-
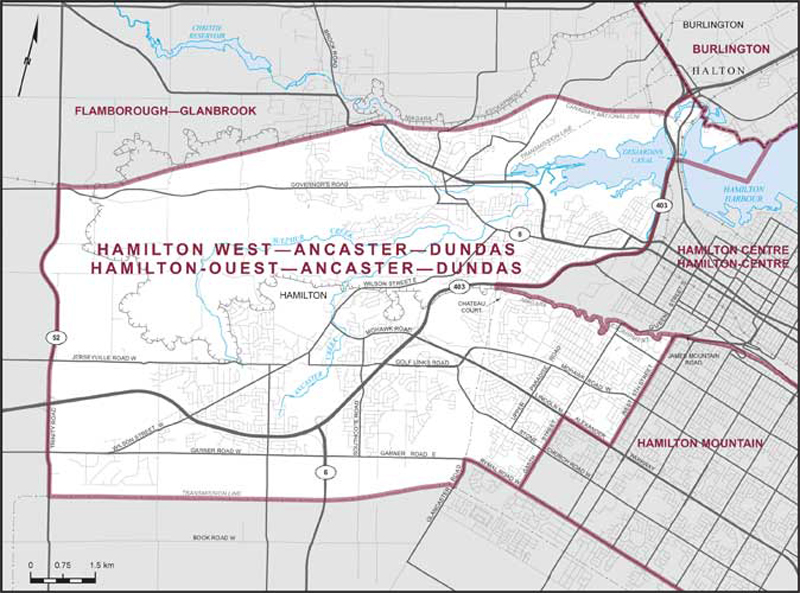
Electoral District:
Hamilton West—Ancaster—DundasProvince/Territory:
Ontario-
Population:
120,551 -
Area:
101 km² -
Population density:
1,194.00/km² -
Population change:
n/a -
Average age:
43 -
Average income:
$68,700 -
Voter turnout:
70%
Language spoken most often at home:
-
English:
99,705 -
French:
380 -
Indigenous language:
0 -
Most popular other language:
-
Mandarin:
2,140
-
-
All others:
12,265
-
-
Electoral District:
Hastings—Lennox and Addington—TyendinagaProvince/Territory:
Ontario-
Population:
106,468 -
Area:
8,419 km² -
Population density:
13.00/km² -
Population change:
n/a -
Average age:
46 -
Average income:
$48,000 -
Voter turnout:
66%
Language spoken most often at home:
-
English:
101,565 -
French:
530 -
Indigenous language:
10 -
Most popular other language:
-
German:
215
-
-
All others:
1,115
-
-
Electoral District:
Humber River—Black CreekProvince/Territory:
Ontario-
Population:
111,593 -
Area:
31 km² -
Population density:
3,600.00/km² -
Population change:
n/a -
Average age:
39 -
Average income:
$37,240 -
Voter turnout:
49%
Language spoken most often at home:
-
English:
64,545 -
French:
310 -
Indigenous language:
5 -
Most popular other language:
-
Vietnamese:
5,665
-
-
All others:
30,350
-
-
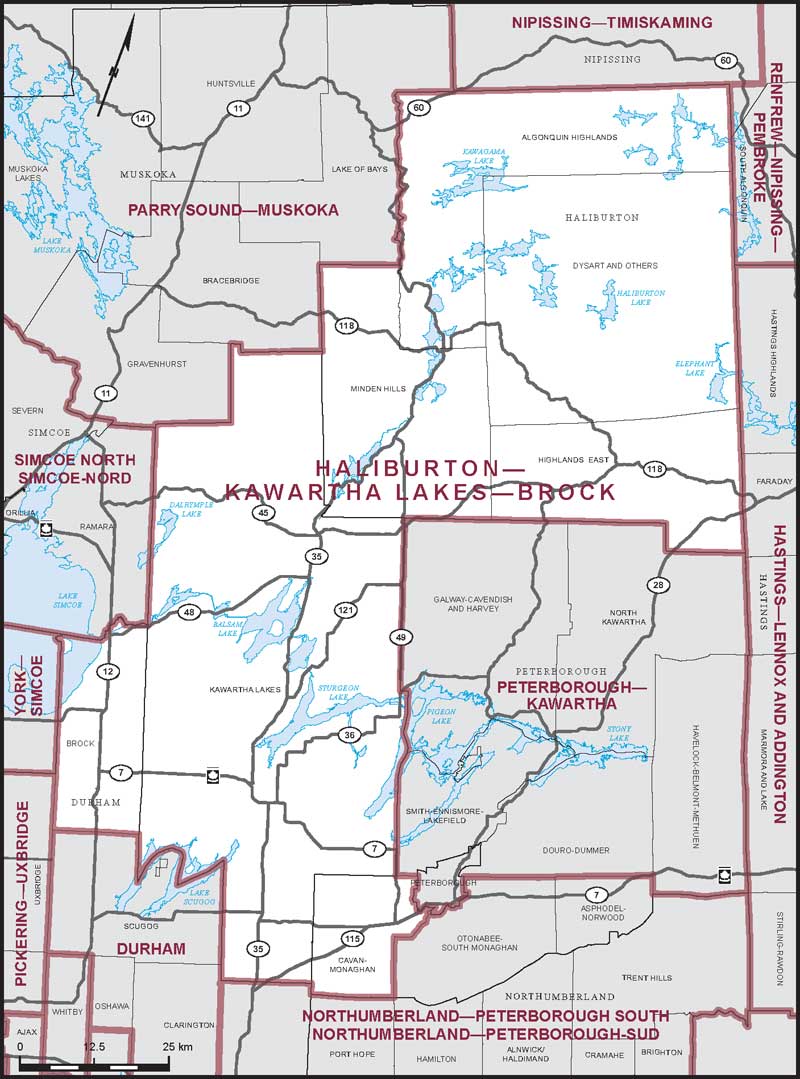
Electoral District:
Haliburton—Kawartha LakesProvince/Territory:
Ontario-
Population:
119,150 -
Area:
8,927 km² -
Population density:
13.00/km² -
Population change:
n/a -
Average age:
48 -
Average income:
$51,650 -
Voter turnout:
67%
Language spoken most often at home:
-
English:
115,060 -
French:
225 -
Indigenous language:
0 -
Most popular other language:
-
German:
175
-
-
All others:
1,340
-
-
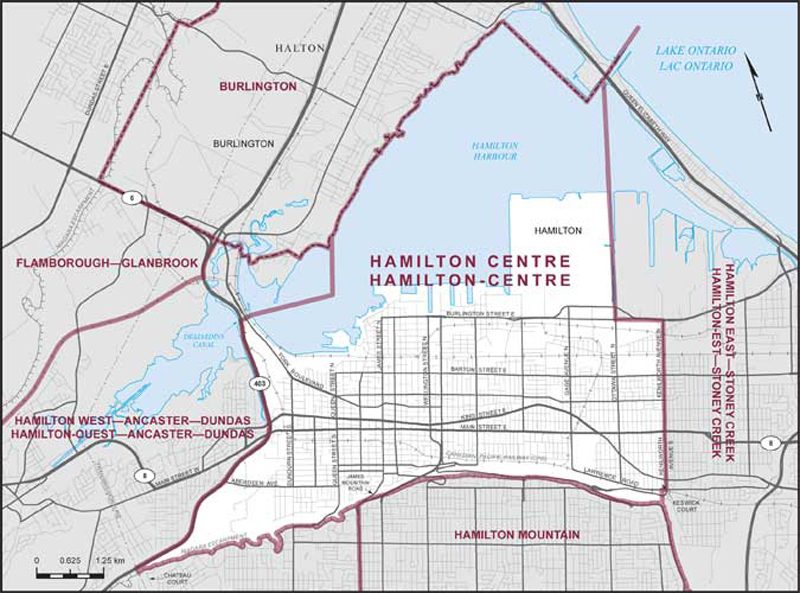
Electoral District:
Hamilton CentreProvince/Territory:
Ontario-
Population:
126,188 -
Area:
43 km² -
Population density:
2,935.00/km² -
Population change:
n/a -
Average age:
40 -
Average income:
$44,640 -
Voter turnout:
56%
Language spoken most often at home:
-
English:
105,565 -
French:
610 -
Indigenous language:
15 -
Most popular other language:
-
Arabic:
1,645
-
-
All others:
12,285
-
-
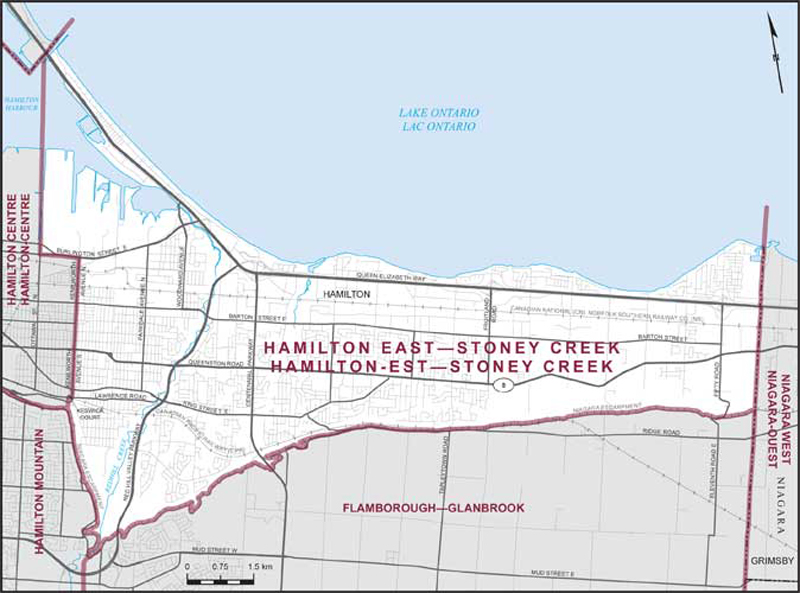
Electoral District:
Hamilton East—Stoney CreekProvince/Territory:
Ontario-
Population:
126,570 -
Area:
71 km² -
Population density:
1,783.00/km² -
Population change:
n/a -
Average age:
41 -
Average income:
$49,320 -
Voter turnout:
59%
Language spoken most often at home:
-
English:
97,665 -
French:
465 -
Indigenous language:
0 -
Most popular other language:
-
Punjabi (Panjabi):
2,765
-
-
All others:
18,530
-
-
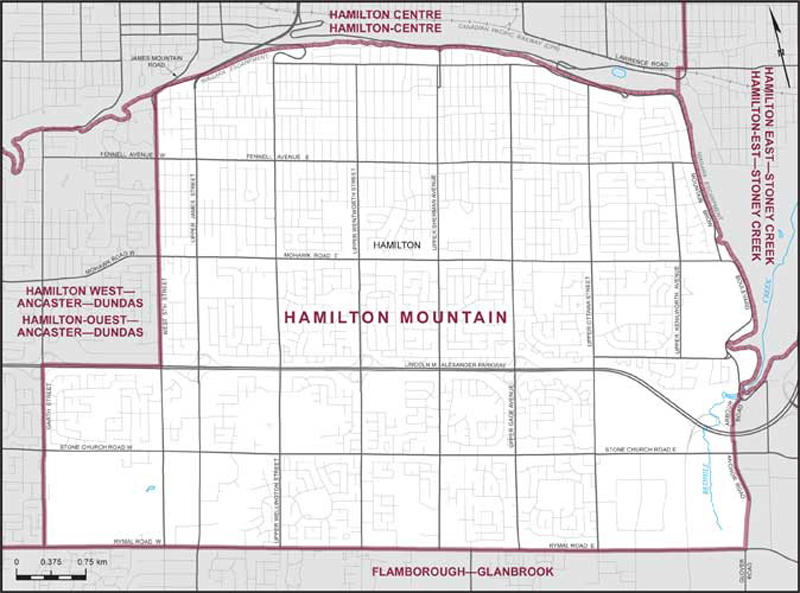
Electoral District:
Hamilton MountainProvince/Territory:
Ontario-
Population:
115,634 -
Area:
38 km² -
Population density:
3,043.00/km² -
Population change:
n/a -
Average age:
42 -
Average income:
$46,480 -
Voter turnout:
61%
Language spoken most often at home:
-
English:
92,765 -
French:
425 -
Indigenous language:
5 -
Most popular other language:
-
Arabic:
2,290
-
-
All others:
13,820
-
-
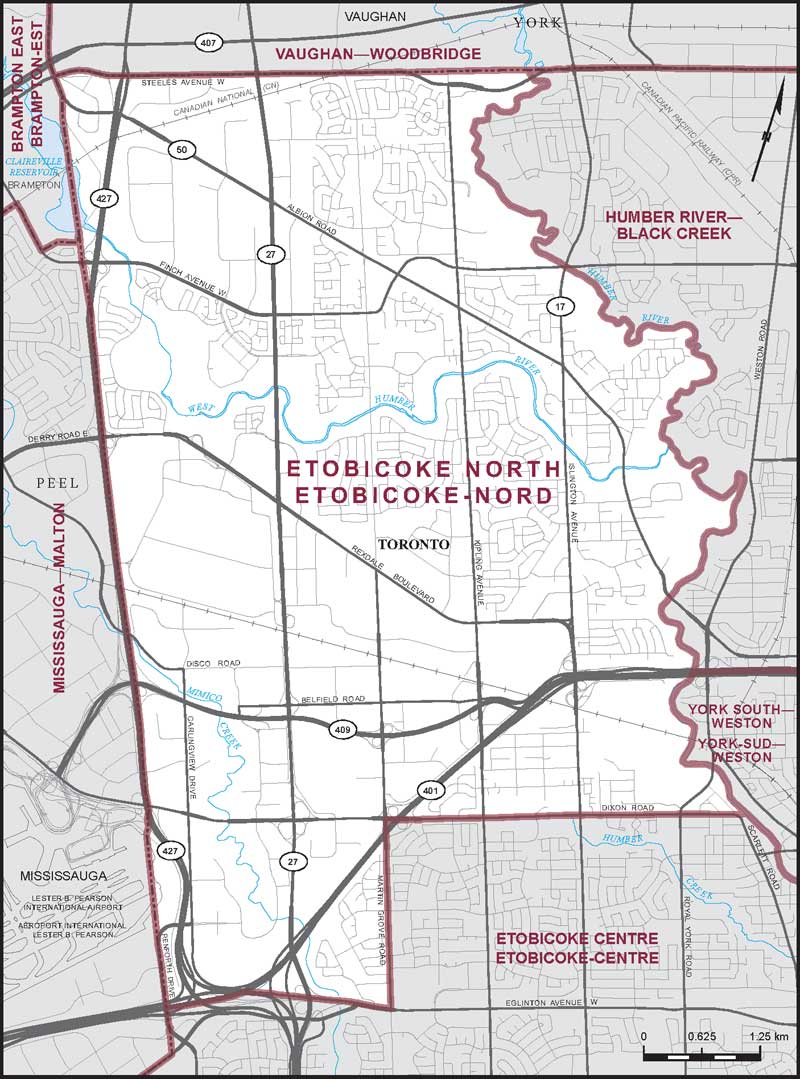
Electoral District:
Etobicoke NorthProvince/Territory:
Ontario-
Population:
116,886 -
Area:
48 km² -
Population density:
2,435.00/km² -
Population change:
n/a -
Average age:
40 -
Average income:
$40,200 -
Voter turnout:
51%
Language spoken most often at home:
-
English:
67,725 -
French:
460 -
Indigenous language:
0 -
Most popular other language:
-
Punjabi (Panjabi):
6,550
-
-
All others:
30,210
-
-
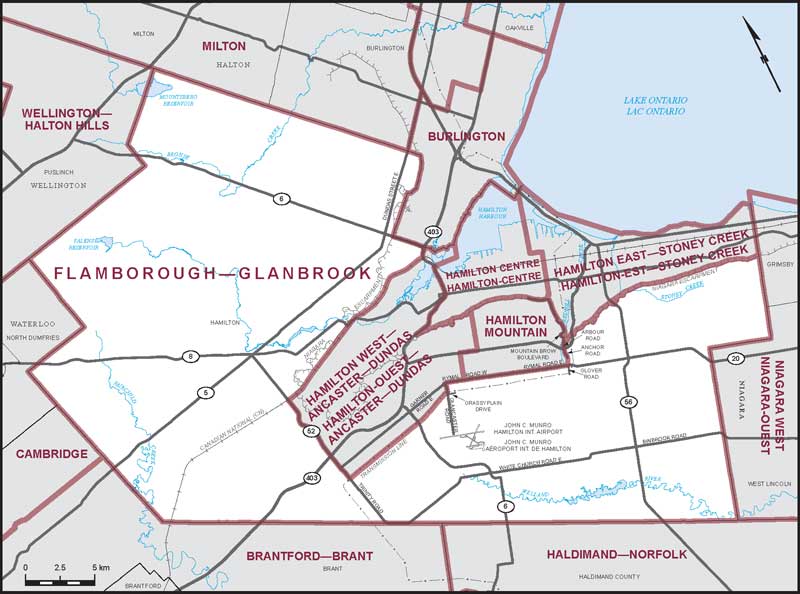
Electoral District:
Flamborough—Glanbrook—Brant NorthProvince/Territory:
Ontario-
Population:
103,836 -
Area:
1,097 km² -
Population density:
95.00/km² -
Population change:
n/a -
Average age:
41 -
Average income:
$62,350 -
Voter turnout:
68%
Language spoken most often at home:
-
English:
95,520 -
French:
315 -
Indigenous language:
0 -
Most popular other language:
-
Punjabi (Panjabi):
670
-
-
All others:
4,650
-
-
Electoral District:
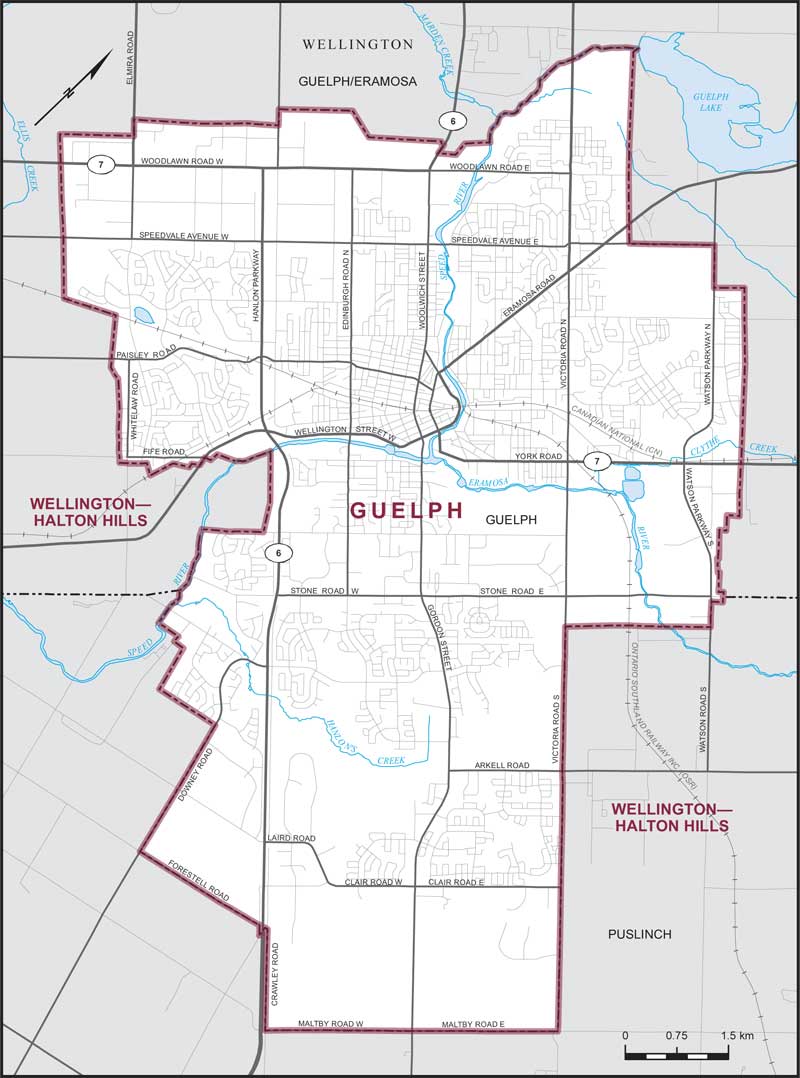
GuelphProvince/Territory:
Ontario-
Population:
118,498 -
Area:
64 km² -
Population density:
1,852.00/km² -
Population change:
n/a -
Average age:
41 -
Average income:
$53,550 -
Voter turnout:
65%
Language spoken most often at home:
-
English:
100,475 -
French:
380 -
Indigenous language:
5 -
Most popular other language:
-
Vietnamese:
1,155
-
-
All others:
11,705
-
-
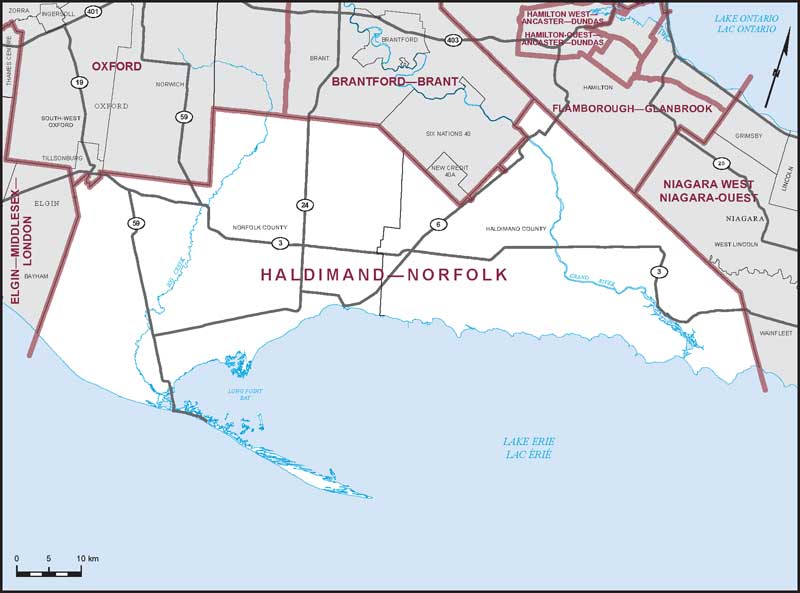
Electoral District:
Haldimand—NorfolkProvince/Territory:
Ontario-
Population:
116,706 -
Area:
2,848 km² -
Population density:
41.00/km² -
Population change:
n/a -
Average age:
44 -
Average income:
$49,480 -
Voter turnout:
67%
Language spoken most often at home:
-
English:
111,075 -
French:
180 -
Indigenous language:
0 -
Most popular other language:
-
German:
915
-
-
All others:
2,650
-
-
Electoral District:
Elgin—St. Thomas—London SouthProvince/Territory:
Ontario-
Population:
112,448 -
Area:
2,048 km² -
Population density:
55.00/km² -
Population change:
n/a -
Average age:
42 -
Average income:
$50,240 -
Voter turnout:
64%
Language spoken most often at home:
-
English:
102,165 -
French:
220 -
Indigenous language:
0 -
Most popular other language:
-
German:
1,545
-
-
All others:
5,130
-
-
Electoral District:
EssexProvince/Territory:
Ontario-
Population:
131,691 -
Area:
1,246 km² -
Population density:
106.00/km² -
Population change:
n/a -
Average age:
43 -
Average income:
$58,400 -
Voter turnout:
67%
Language spoken most often at home:
-
English:
121,600 -
French:
770 -
Indigenous language:
0 -
Most popular other language:
-
Punjabi (Panjabi):
820
-
-
All others:
5,615
-
-
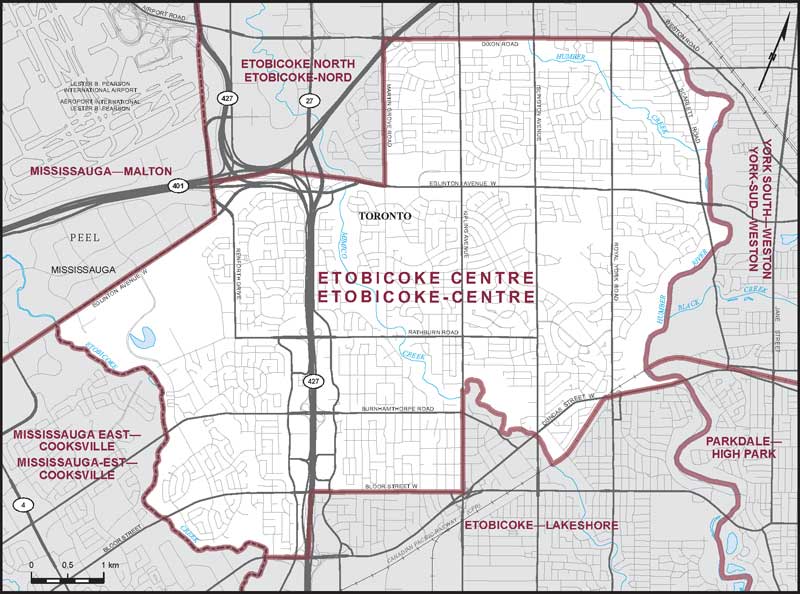
Electoral District:
Etobicoke CentreProvince/Territory:
Ontario-
Population:
125,606 -
Area:
38 km² -
Population density:
3,305.00/km² -
Population change:
n/a -
Average age:
44 -
Average income:
$68,100 -
Voter turnout:
63%
Language spoken most often at home:
-
English:
89,155 -
French:
610 -
Indigenous language:
0 -
Most popular other language:
-
Ukrainian:
2,325
-
-
All others:
24,520
-
-
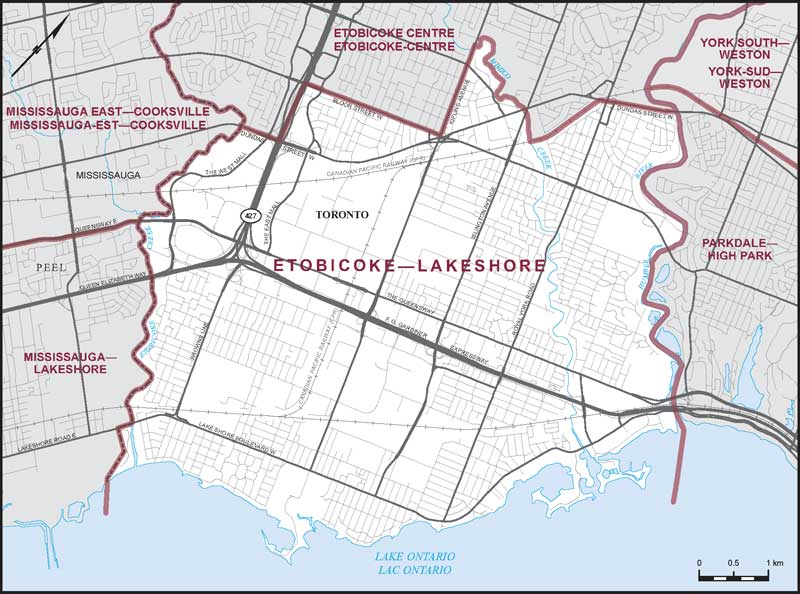
Electoral District:
Etobicoke—LakeshoreProvince/Territory:
Ontario-
Population:
120,956 -
Area:
36 km² -
Population density:
3,360.00/km² -
Population change:
n/a -
Average age:
42 -
Average income:
$73,700 -
Voter turnout:
63%
Language spoken most often at home:
-
English:
92,700 -
French:
680 -
Indigenous language:
0 -
Most popular other language:
-
Polish:
2,300
-
-
All others:
18,090
-