Federal Electoral District Fact Sheets
-
Electoral District:
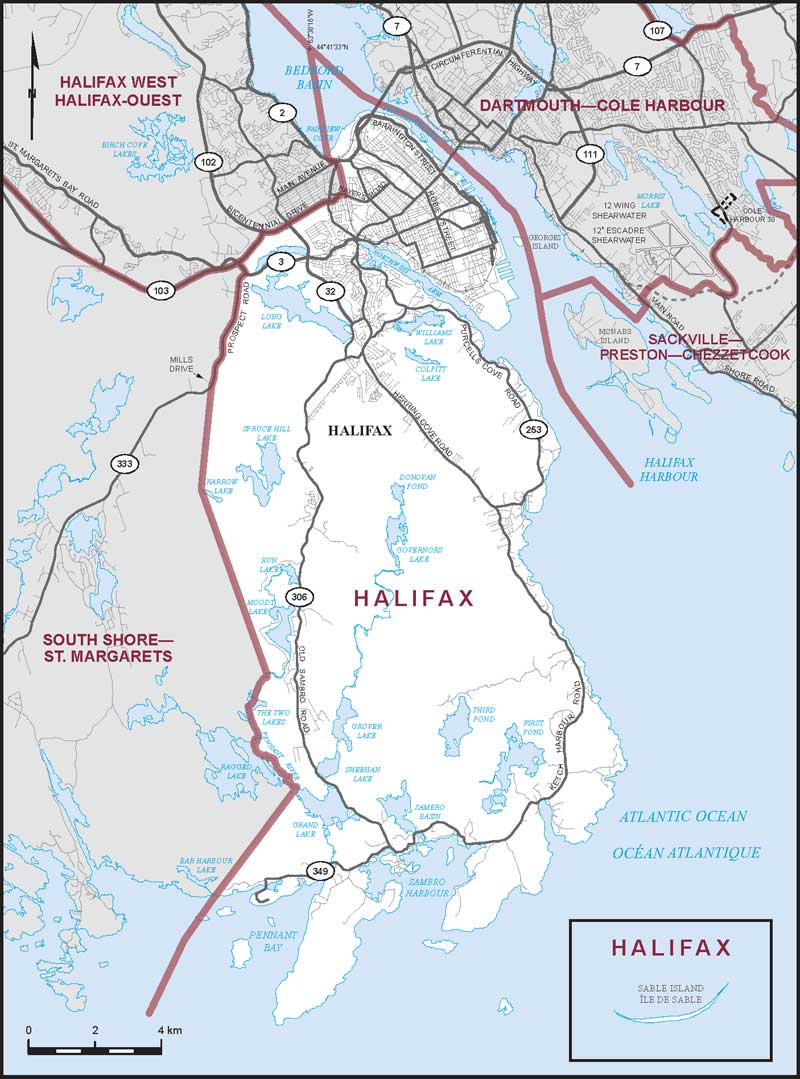
Halifax WestProvince/Territory:
Nova Scotia-
Population:
99,228 -
Area:
506 km² -
Population density:
196.00/km² -
Population change:
n/a -
Average age:
41 -
Average income:
$52,500 -
Voter turnout:
73%
Language spoken most often at home:
-
English:
84,725 -
French:
580 -
Indigenous language:
0 -
Most popular other language:
-
Arabic:
2,080
-
-
All others:
8,705
-
-
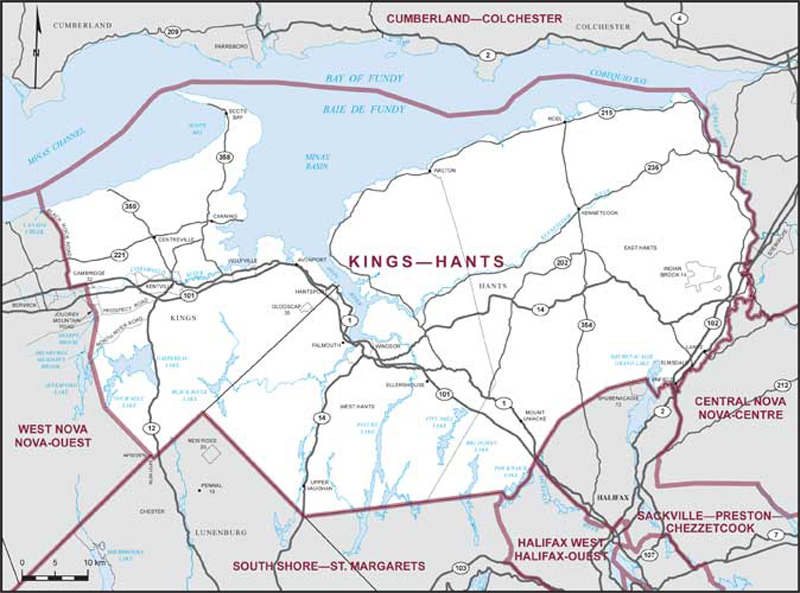
Electoral District:
Kings—HantsProvince/Territory:
Nova Scotia-
Population:
95,063 -
Area:
4,502 km² -
Population density:
21.00/km² -
Population change:
n/a -
Average age:
45 -
Average income:
$44,520 -
Voter turnout:
72%
Language spoken most often at home:
-
English:
91,865 -
French:
270 -
Indigenous language:
15 -
Most popular other language:
-
German:
290
-
-
All others:
1,080
-
-
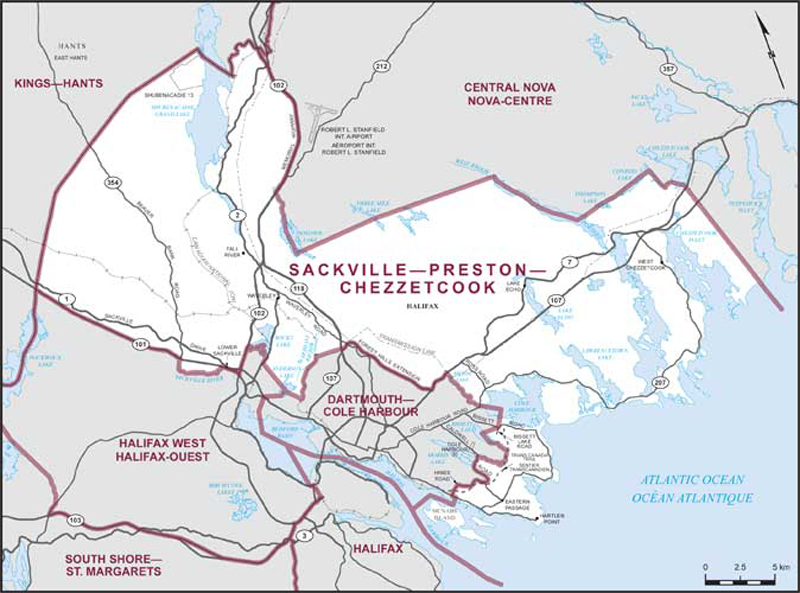
Electoral District:
Sackville—Bedford—PrestonProvince/Territory:
Nova Scotia-
Population:
100,416 -
Area:
559 km² -
Population density:
180.00/km² -
Population change:
n/a -
Average age:
41 -
Average income:
$56,550 -
Voter turnout:
73%
Language spoken most often at home:
-
English:
91,720 -
French:
715 -
Indigenous language:
5 -
Most popular other language:
-
Arabic:
925
-
-
All others:
3,550
-
-
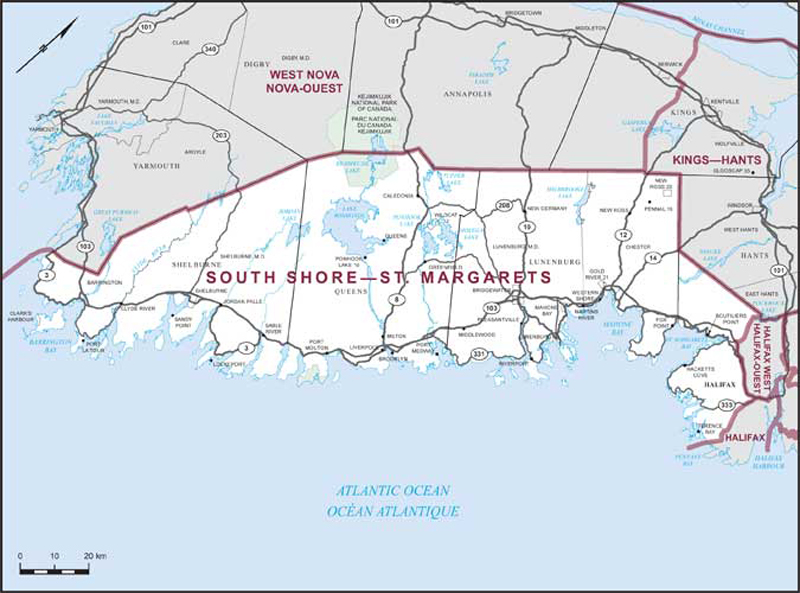
Electoral District:
South Shore—St. MargaretsProvince/Territory:
Nova Scotia-
Population:
79,130 -
Area:
8,068 km² -
Population density:
10.00/km² -
Population change:
n/a -
Average age:
49 -
Average income:
$45,120 -
Voter turnout:
72%
Language spoken most often at home:
-
English:
76,945 -
French:
205 -
Indigenous language:
0 -
Most popular other language:
-
German:
145
-
-
All others:
595
-
-
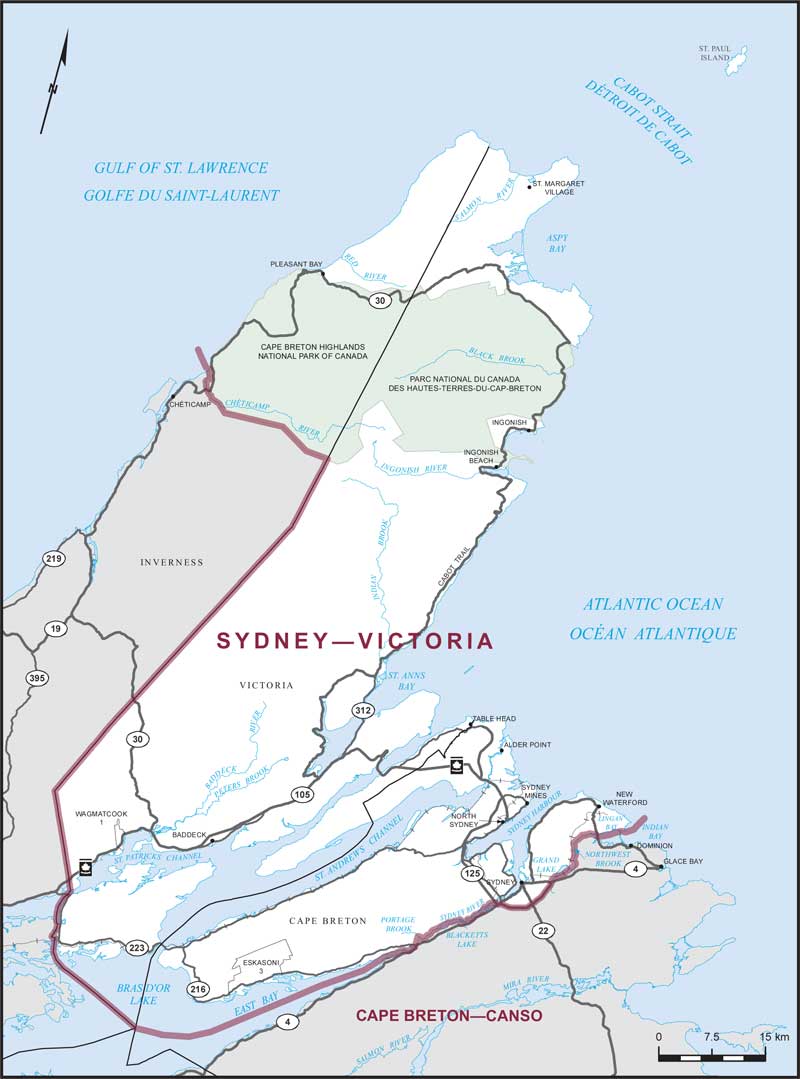
Electoral District:
Sydney—Glace BayProvince/Territory:
Nova Scotia-
Population:
82,219 -
Area:
483 km² -
Population density:
170.00/km² -
Population change:
n/a -
Average age:
46 -
Average income:
$41,000 -
Voter turnout:
69%
Language spoken most often at home:
-
English:
78,540 -
French:
160 -
Indigenous language:
75 -
Most popular other language:
-
Punjabi (Panjabi):
470
-
-
All others:
1,120
-
-
Electoral District:
Acadie—BathurstProvince/Territory:
New Brunswick-
Population:
79,581 -
Area:
5,118 km² -
Population density:
16.00/km² -
Population change:
n/a -
Average age:
49 -
Average income:
$39,840 -
Voter turnout:
70%
Language spoken most often at home:
-
English:
14,460 -
French:
62,250 -
Indigenous language:
0 -
Most popular other language:
-
Tagalog (Pilipino, Filipino):
50
-
-
All others:
240
-
-
Electoral District:
BeauséjourProvince/Territory:
New Brunswick-
Population:
88,591 -
Area:
3,988 km² -
Population density:
22.00/km² -
Population change:
n/a -
Average age:
46 -
Average income:
$47,800 -
Voter turnout:
77%
Language spoken most often at home:
-
English:
35,735 -
French:
47,415 -
Indigenous language:
20 -
Most popular other language:
-
Tagalog (Pilipino, Filipino):
370
-
-
All others:
1,220
-
-
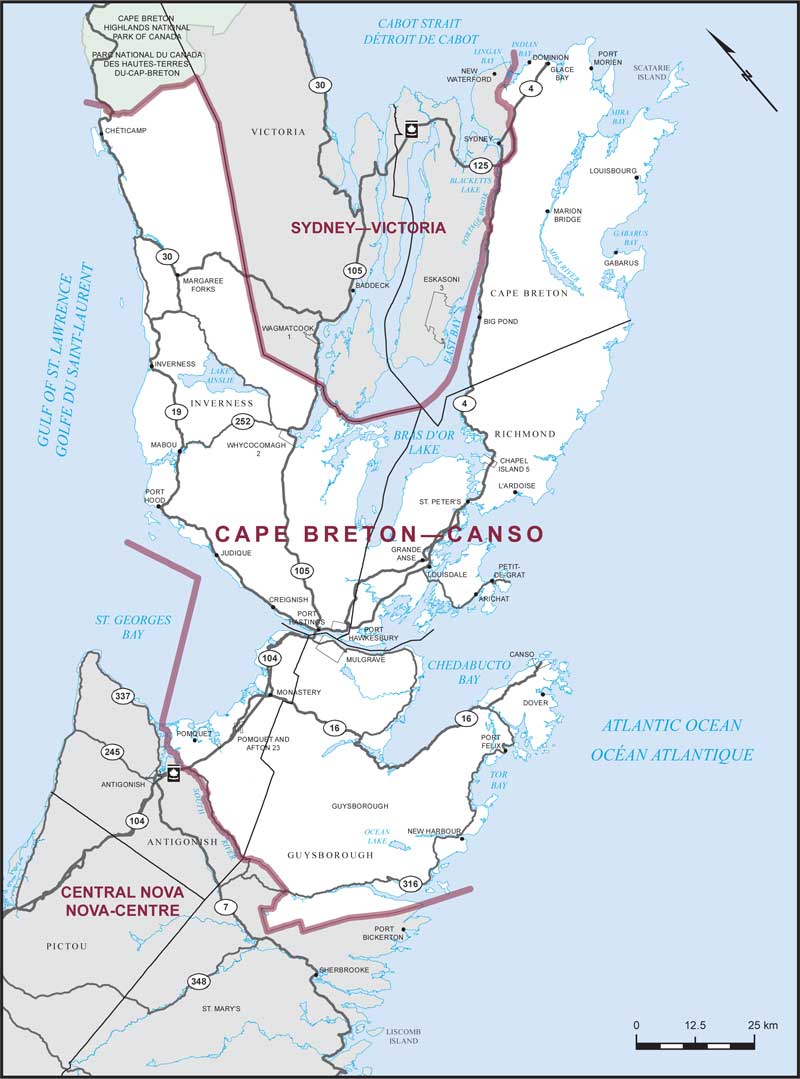
Electoral District:
Cape Breton—Canso—AntigonishProvince/Territory:
Nova Scotia-
Population:
75,141 -
Area:
13,463 km² -
Population density:
6.00/km² -
Population change:
n/a -
Average age:
47 -
Average income:
$44,160 -
Voter turnout:
75%
Language spoken most often at home:
-
English:
68,525 -
French:
2,065 -
Indigenous language:
1,875 -
Most popular other language:
-
German:
155
-
-
All others:
645
-
-
Electoral District:
Central NovaProvince/Territory:
Nova Scotia-
Population:
76,210 -
Area:
8,549 km² -
Population density:
9.00/km² -
Population change:
n/a -
Average age:
46 -
Average income:
$45,960 -
Voter turnout:
75%
Language spoken most often at home:
-
English:
74,255 -
French:
270 -
Indigenous language:
45 -
Most popular other language:
-
Tagalog (Pilipino, Filipino):
80
-
-
All others:
420
-
-
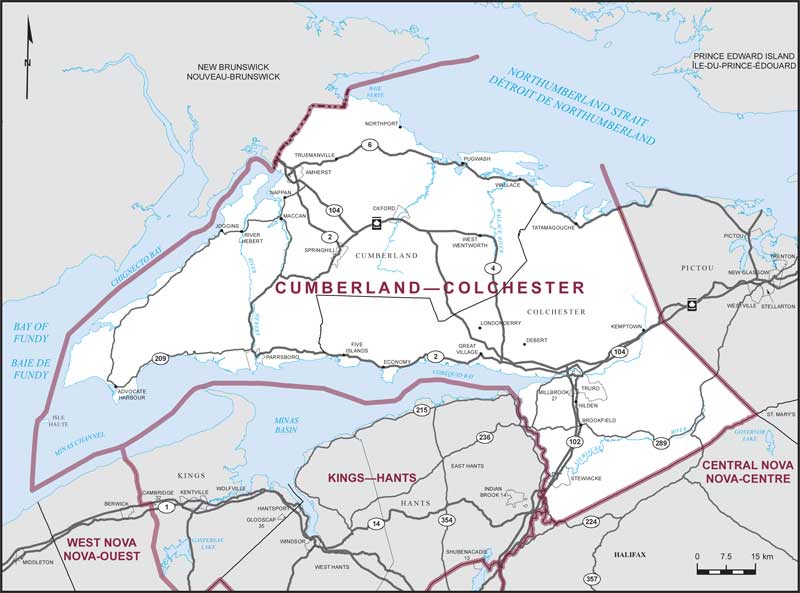
Electoral District:
Cumberland—ColchesterProvince/Territory:
Nova Scotia-
Population:
82,014 -
Area:
7,903 km² -
Population density:
10.00/km² -
Population change:
n/a -
Average age:
46 -
Average income:
$43,680 -
Voter turnout:
70%
Language spoken most often at home:
-
English:
78,995 -
French:
145 -
Indigenous language:
25 -
Most popular other language:
-
Punjabi (Panjabi):
205
-
-
All others:
825
-
-
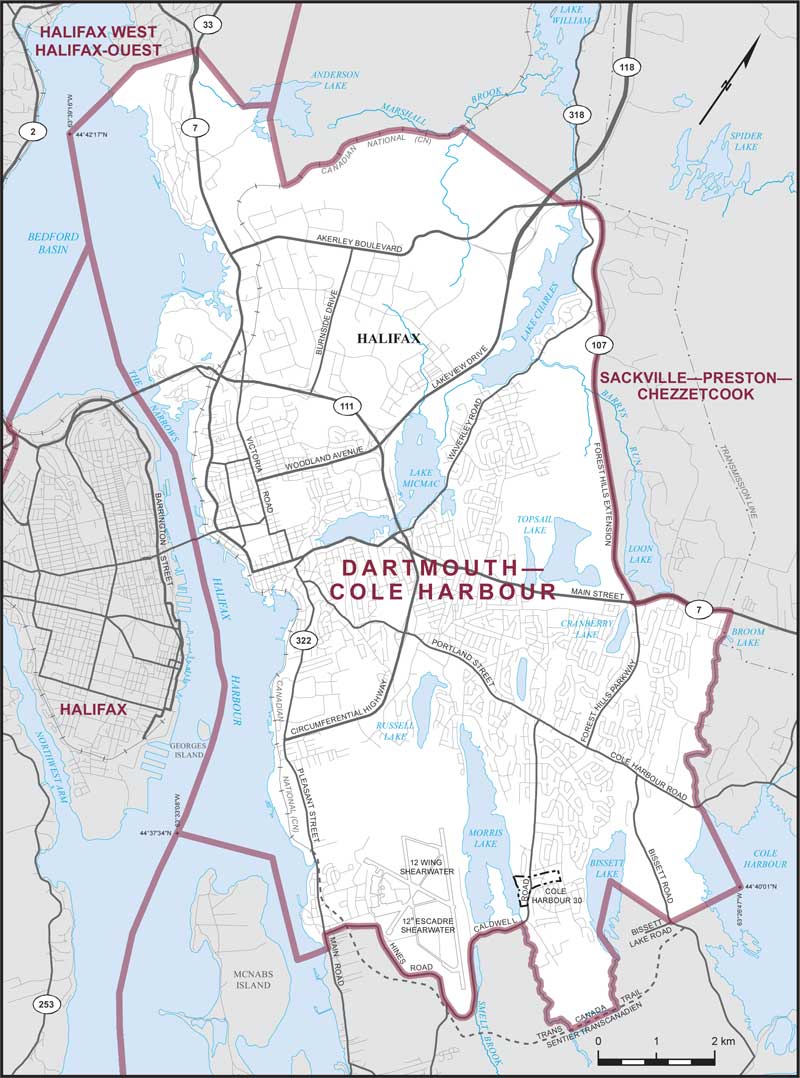
Electoral District:
Dartmouth—Cole HarbourProvince/Territory:
Nova Scotia-
Population:
104,825 -
Area:
96 km² -
Population density:
1,092.00/km² -
Population change:
n/a -
Average age:
43 -
Average income:
$50,560 -
Voter turnout:
72%
Language spoken most often at home:
-
English:
97,385 -
French:
1,220 -
Indigenous language:
10 -
Most popular other language:
-
Punjabi (Panjabi):
830
-
-
All others:
3,060
-
-
Electoral District:
Acadie—AnnapolisProvince/Territory:
Nova Scotia-
Population:
76,252 -
Area:
8,485 km² -
Population density:
9.00/km² -
Population change:
n/a -
Average age:
47 -
Average income:
$40,320 -
Voter turnout:
72%
Language spoken most often at home:
-
English:
67,565 -
French:
6,420 -
Indigenous language:
5 -
Most popular other language:
-
Spanish:
80
-
-
All others:
550
-
-
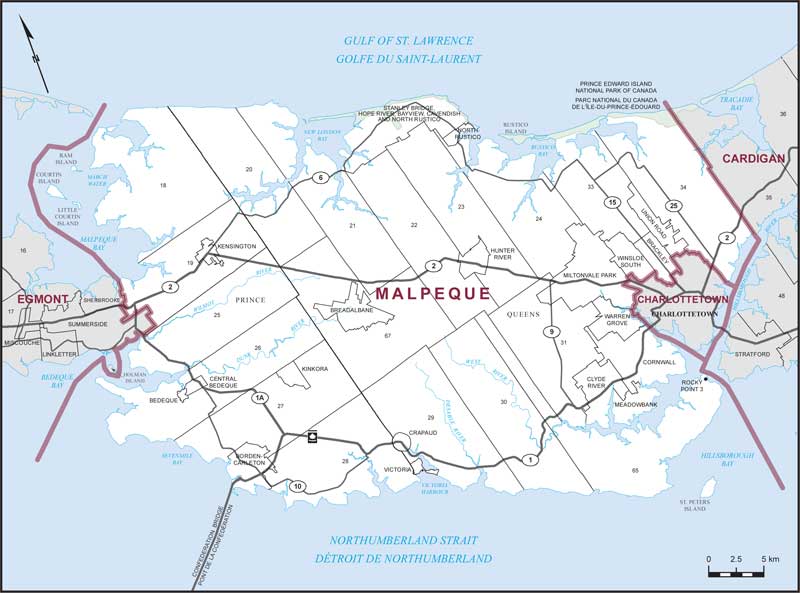
Electoral District:
MalpequeProvince/Territory:
Prince Edward Island-
Population:
38,535 -
Area:
1,570 km² -
Population density:
25.00/km² -
Population change:
n/a -
Average age:
43 -
Average income:
$47,840 -
Voter turnout:
82%
Language spoken most often at home:
-
English:
36,910 -
French:
280 -
Indigenous language:
0 -
Most popular other language:
-
Mandarin:
160
-
-
All others:
735
-
-
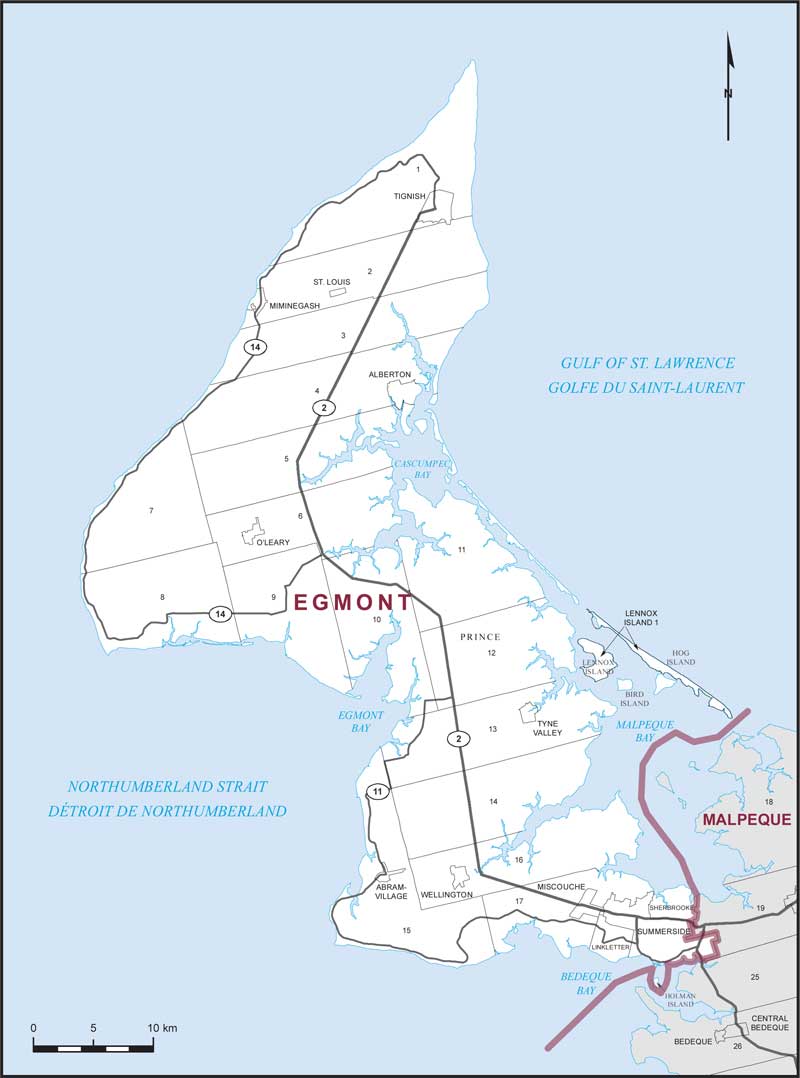
Electoral District:
EgmontProvince/Territory:
Prince Edward Island-
Population:
37,751 -
Area:
1,548 km² -
Population density:
24.00/km² -
Population change:
n/a -
Average age:
45 -
Average income:
$42,840 -
Voter turnout:
77%
Language spoken most often at home:
-
English:
34,310 -
French:
1,330 -
Indigenous language:
5 -
Most popular other language:
-
Tagalog (Pilipino, Filipino):
535
-
-
All others:
715
-
-
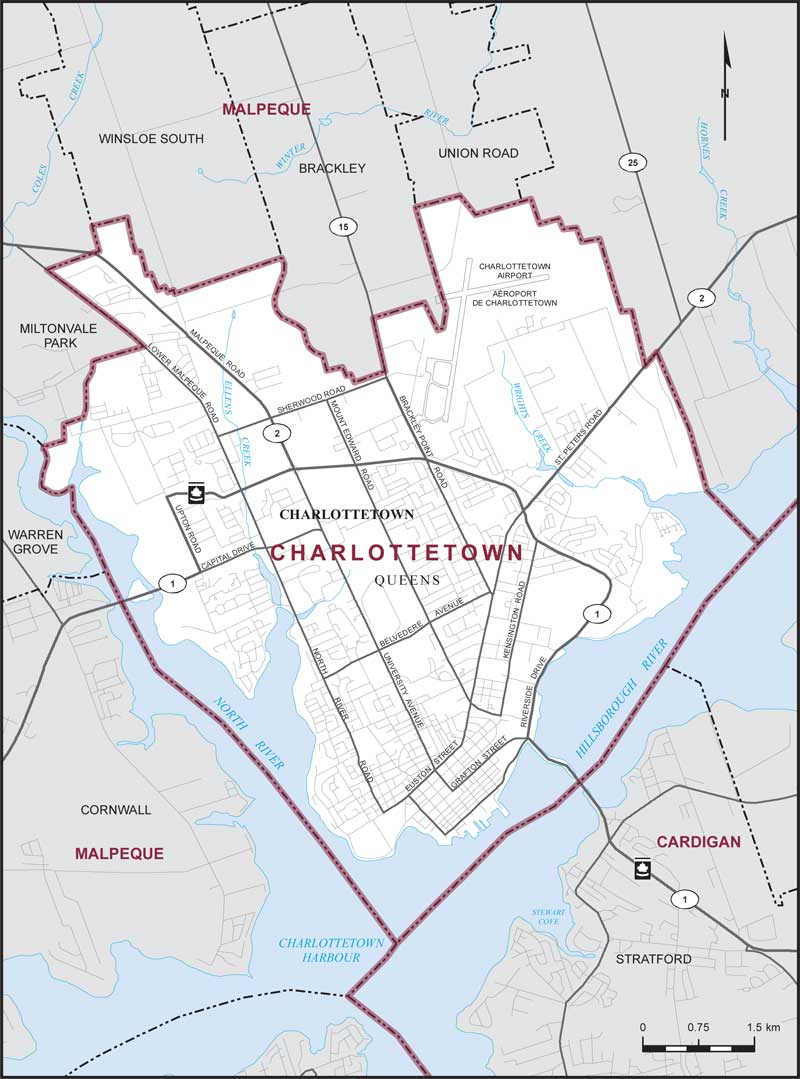
Electoral District:
CharlottetownProvince/Territory:
Prince Edward Island-
Population:
38,809 -
Area:
45 km² -
Population density:
862.00/km² -
Population change:
n/a -
Average age:
42 -
Average income:
$46,160 -
Voter turnout:
76%
Language spoken most often at home:
-
English:
32,020 -
French:
265 -
Indigenous language:
0 -
Most popular other language:
-
Mandarin:
1,215
-
-
All others:
3,290
-
-
Electoral District:
Terra Nova—The PeninsulasProvince/Territory:
Newfoundland and Labrador-
Population:
76,121 -
Area:
17,906 km² -
Population density:
4.00/km² -
Population change:
n/a -
Average age:
50 -
Average income:
$40,080 -
Voter turnout:
64%
Language spoken most often at home:
-
English:
74,980 -
French:
45 -
Indigenous language:
0 -
Most popular other language:
-
Punjabi (Panjabi):
40
-
-
All others:
150
-